A Project on the Applications of Ground Penetrating Radar Geophysical Method
Received: 28-Aug-2015 / Accepted Date: 10-Sep-2015 / Published Date: 20-Sep-2015 DOI: 10.4172/2157-7617.1000299
11943Introduction
The Ground penetrating radar (GPR) is a high-resolution technique for imaging shallow soil and ground structures using electromagnetic (EM) waves in the frequency band of 10-1000 MHz this geophysical method has become increasingly applicable and popular among geoscientists over the last 20-30 years [1], its application has been carried out in a geophysical field work in the southeast outskirts of Enschede, The Netherlands. The area is a flat land covered by grass and sparse deciduous trees, used for mainly agricultural practices since the area is dominantly inhabited by farmers. The soil composition is mostly of clay and sand or a mixture of both, which initiates the aim of this preliminary fieldwork (Figures 1 and 2).
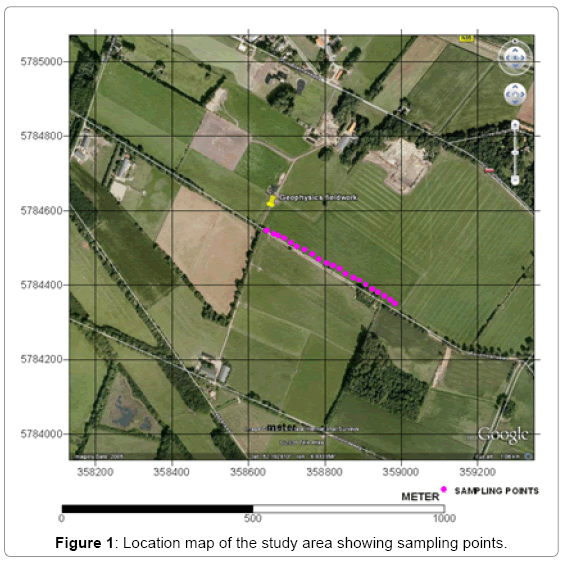
Figure 1: Location map of the study area showing sampling points.
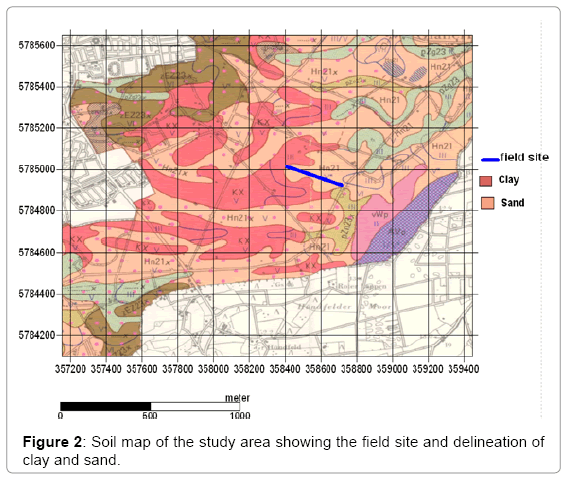
Figure 2: Soil map of the study area showing the field site and delineation of clay and sand.
Objective
The purpose of this project is to carry out an analysis using data acquired from fieldwork to delineate sand and clay interface for geologic and geomorphologic structure, and to assess the variation in groundwater table and the impact of moisture variation on the recorded signals, also to make a clear distinction between groundwater and geology/geomorphology.
Method
Ground penetrating radar (GPR) offers a new way of viewing shallow soil and rock complexities. The necessity to have a better understanding of activities such as geochemical sampling, geotechnical investigations and placer exploration as well as factors guiding the flow of groundwater has resulted in an increasing demand for techniques which can image the subsurface with higher resolution than was previously possible [2]. GPR has a lot of applications which include rock mechanics, mineral and ground water exploration, geotechnical and archaeological investigations, mapping bedrock depth, rock type variation, and fractures in bedrock, soil strata and the water table in coarse-grained soils. GPR possesses a very high resolution as a result of its relatively high frequency, and this in effect reduces it depth range, but basically the penetration depth is controlled by the conductivity of the material, a highly conductive material does not allow much penetration but a material with a low electrical conductivity allows deeper penetration. A study carried out in northern Wisconsin by Lowry [3], where the low electrical conductivity of water saturated peat permitted high resolution image to a depth of 16 m. GPR functions with transmitting and receiving antennae, sending pulses to the subsurface and recording the reflections respectively. The velocity of radar through the subsurface is dependent on the dielectric constant (εr) of the materials, which is the ratio of the amount of stored electrical energy when a potential is applied, relative to permittivity of a vacuum [3]. It is defined thus

Where;
εr = dielectric constant
εs = the static permittivity of the material
ε0 = the electric constant.
The higher the dielectric constant the less velocity as shown in the table below (Table 1).
| Material | εr | v |
|---|---|---|
| Air Ice Fresh water Salt water Dry sand Wet sand Shale and clay Silts Limestone Granite Dry salt |
1 3-4 80 80 3-5 20-30 5-20 5-30 4-8 4-6 5-6 |
0.30 0.16 0.033 0.01 0.15 0.06 0.08 0.07 0.12 0.13 0.13 |
Table 1: Typical values of some radar parameters for some materials [4].
Data Processing And Results
With these parameters in mind the GPR was calibrated and measurements were made by pushing it along the line section for a distance of 420 m, and after that, processing of the data was carried out using Rad Explorer 1.4 which was also used for the time – depth conversion by estimating the velocity, and the following results were obtained (Figure 3).
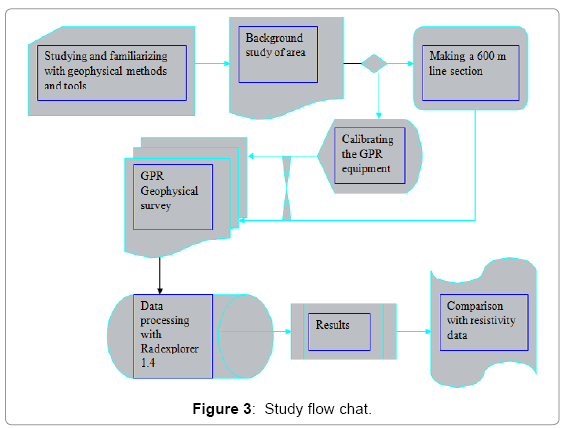
Figure 3: Study flow chat.
The radar gram above shows the result for the first 100 m distance, the first 0.5 m (red arrows) is not taken into account because it is as a result of the space between the sensor and the grounds surface, on the ground surface down till a few inches is sand because of its texture, further below the yellow green and blue arrows, point out areas of possible clay (wet) content, a discontinuity in layer and area of possible sand (wet) contents respectively. The areas with the yellow arrow are considered clay because clay has a lower dielectric constant than sand; as a result it has a smoother texture on the radagram, while sand with (blue arrows) has a higher dielectric constant thereby having a coarser texture on the radargram due to it agitation of the radar (Figure 4).
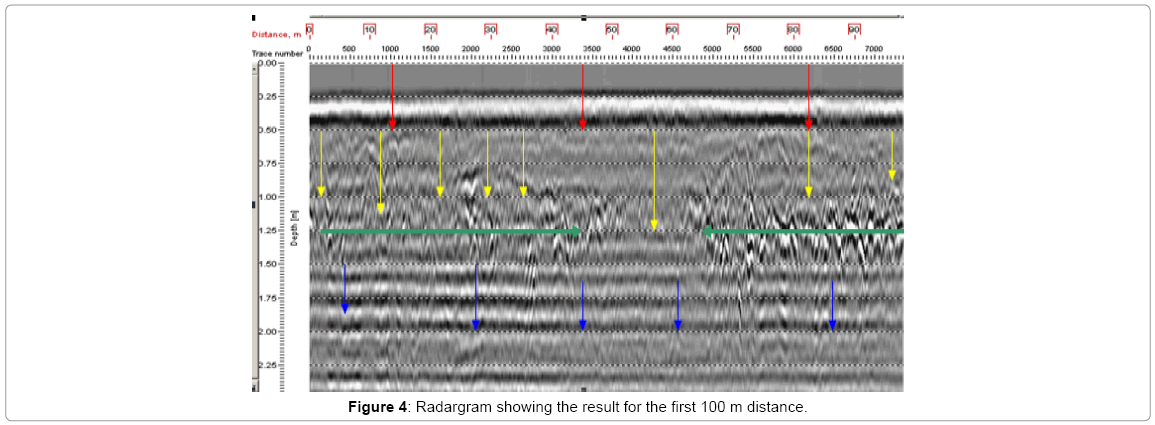
Figure 4: Radargram showing the result for the first 100 m distance.
From the second 100 m distance the red, yellow and green arrows are also as explained in the first image but at the187 m distance a sudden upwelling of possible clay or a mix of clay and sand is seen (Figure 5).
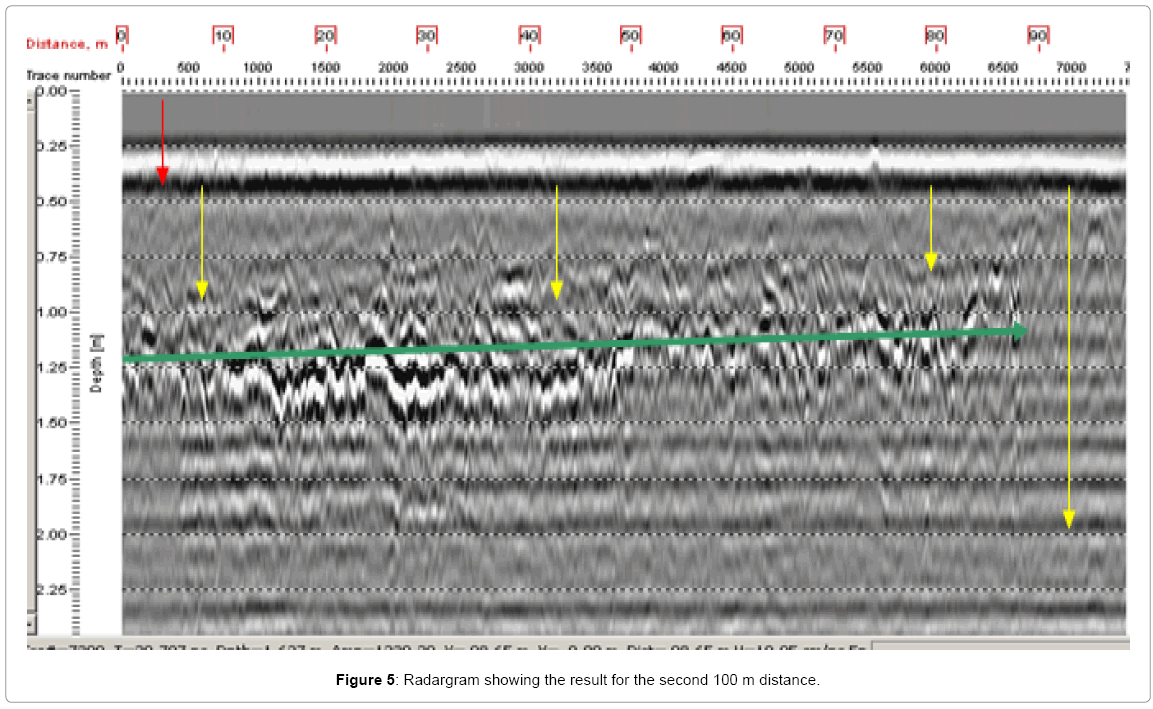
Figure 5: Radargram showing the result for the second 100 m distance.
From the third 100 m distance the continuation of the clay or mixed clay and sand layer is seen pointed out by the yellow arrow, and the red oval sign points out a tree root. All other features remain similar in the preceding 120 m. Groundwater was not detected because the profile measured was only about 2 m deep which is too shallow to reach the Groundwater table (Figure 6).
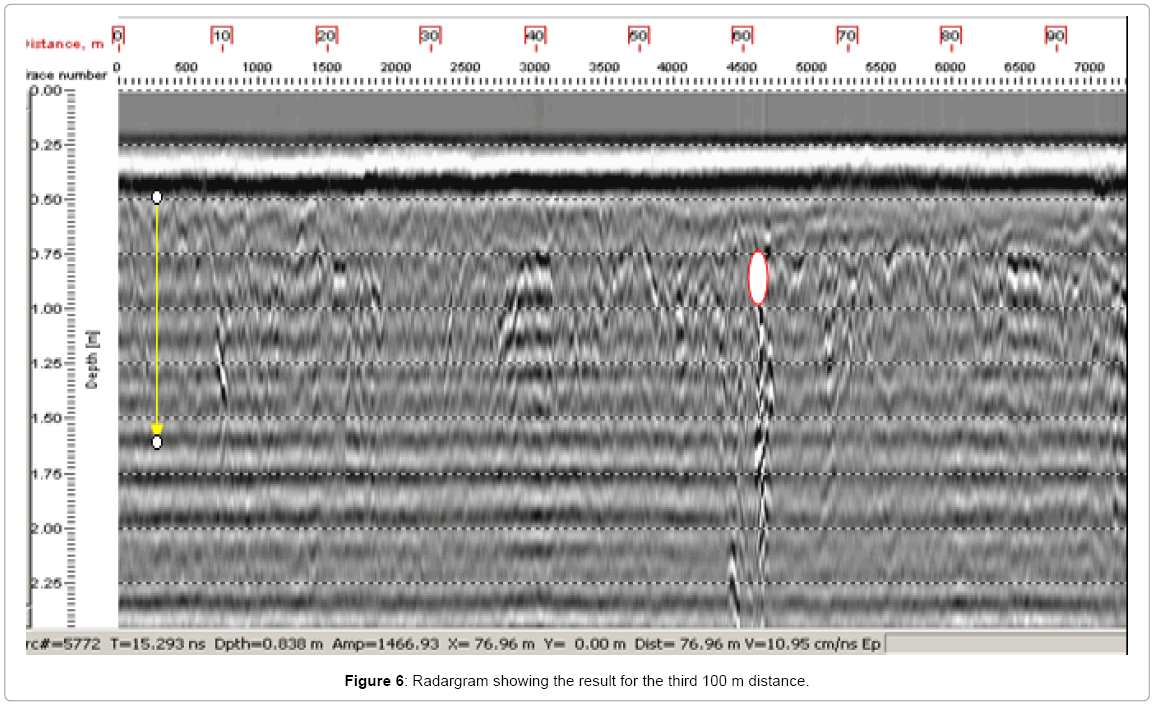
Figure 6: Radargram showing the result for the third 100 m distance.
Comparison With Resistivity Data
Measurements made using the Resistivity geophysical method produced a similar result with that of GPR, as can be seen below. The results from the GPR data are more or less similar to that of resistivity, looking at the inverted resistivity section the top 1 m depth has a higher resistivity value showing possible sand, and shows a lower resistivity at the 2.6 m depth denoting possible clay and it can be see that there is a significant change in the resistivity values at about 187 m distance showing possible clay or a mixture with sand, all these reflect the same trend in the GPR data as illustrated and explained in section 4 (Figures 7 and 8).
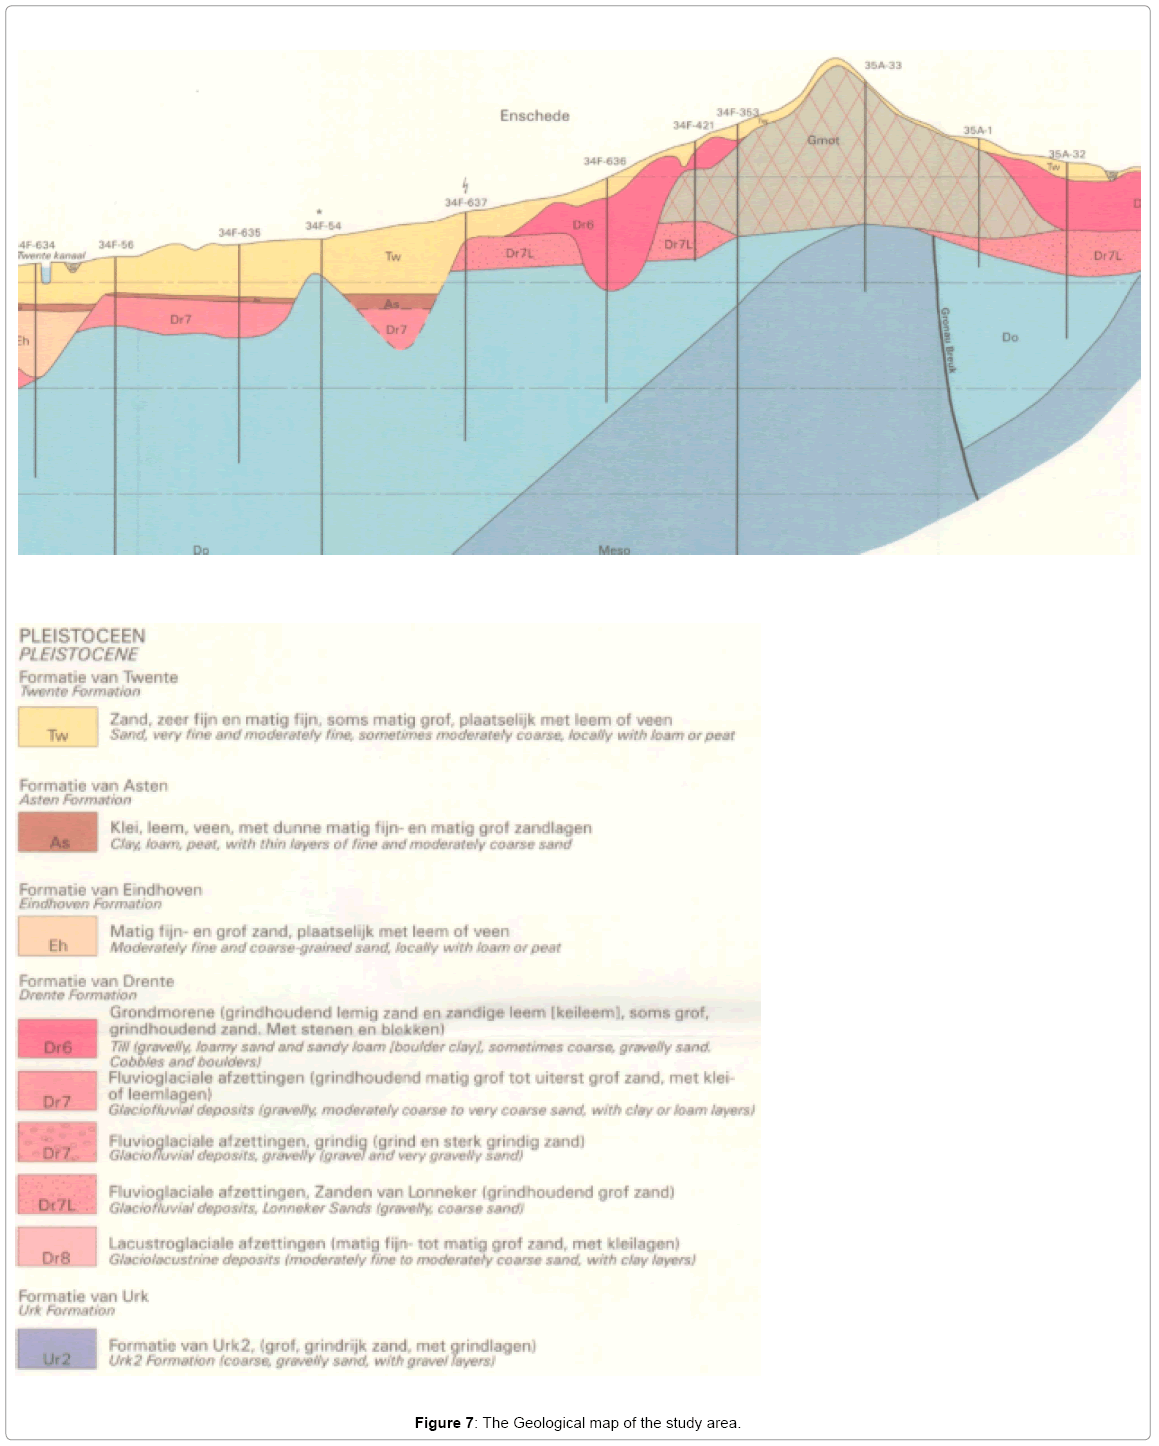
Figure 7: The Geological map of the study area.
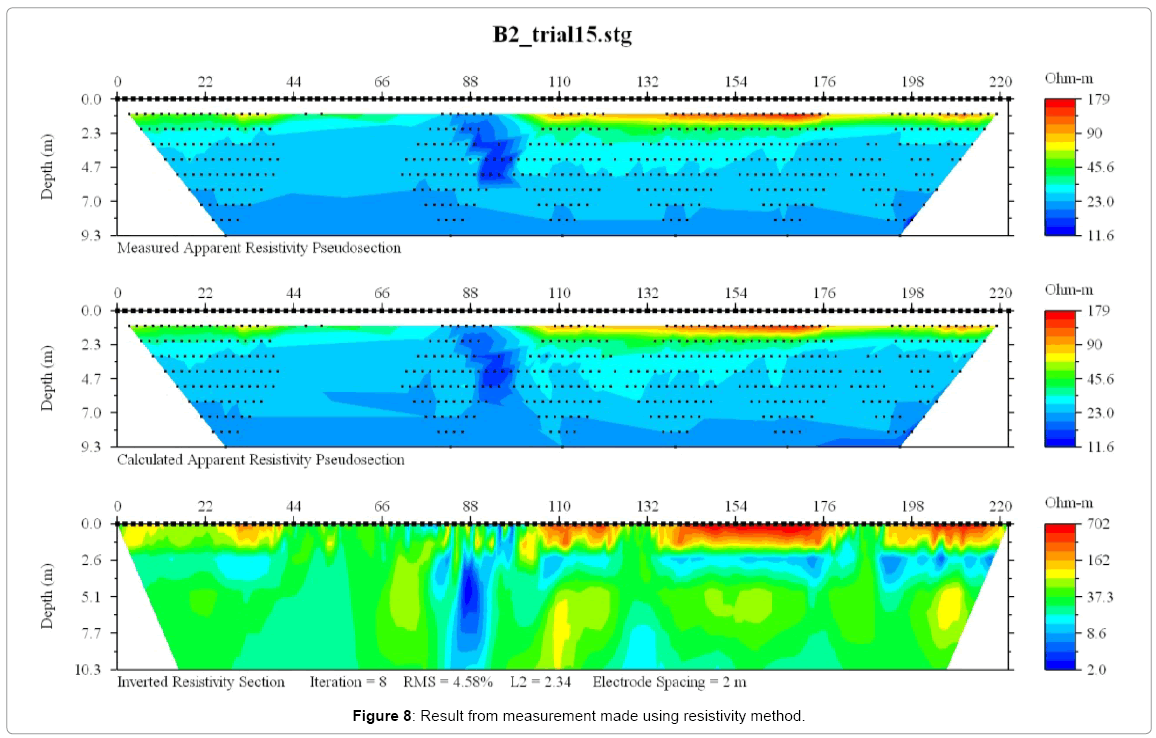
Figure 8: Result from measurement made using resistivity method.
Because of the shallow depth of penetration which was about 2 m the groundwater table was not accounted for in this project, but generally from the study and similarity in the results from the different methods it is evident that GPR and other geophysical methods are efficient and accurate for geophysical exploration.
References
- Nielsen L, Müller C (2009) Preface to the Special Issue on Techniques of Near-Surface Seismic and Ground-Penetrating Radar Imaging. J Applied Geophysics 68: 1-2.
- Davis JL, Annan AP (1989) Ground penetrating radar for high resolution mapping of soil and rock stratigraphy. Geophysical Prospecting 37: 531-551.
- Lowry CS, Fratta D, Anderson MP (2009) Ground penetrating radar and spring formation in a groundwater dominated peat wetland. J Hydrol 373: 68-79.
- Milson J (2003) Field Geophysics, the geological field guide series 232.
Citation: Nze OKE (2015) A Project on the Applications of Ground Penetrating Radar Geophysical Method. J Earth Sci Clim Change. 6: 299. DOI: 10.4172/2157-7617.1000299
Copyright: © 2015 Nze OKE. This is an open-access article distributed under the terms of the Creative Commons Attribution License, which permits unrestricted use, distribution, and reproduction in any medium, provided the original author and source are credited.
Select your language of interest to view the total content in your interested language
Share This Article
Recommended Journals
Open Access Journals
Article Tools
Article Usage
- Total views: 19236
- [From(publication date): 10-2015 - Aug 29, 2025]
- Breakdown by view type
- HTML page views: 14247
- PDF downloads: 4989