Africa-Cordex Simulations Projection of Future Temperature, Precipitation, Frequency and Intensity Indices Over Mono Basin in West Africa
Received: 16-Jul-2018 / Accepted Date: 02-Sep-2018 / Published Date: 05-Sep-2018 DOI: 10.4172/2157-7617.1000490
Keywords: Frequency; Intensity; High-resolution; Mono basin; Rainfall; Temperature
Introduction
In recent decades, Earth's vulnerability to the effects of climate variability and climate change is one of the issues most addressed by the scientific community, institutions and the media. The research from scientific community on climate change has estimated and predicts that the frequency, intensity and extent of these phenomena (drought on continental regions and violent cyclonic storms) are and will be likely to increase across the world which will increase the exposure of populations in the years to come [1,2]. For example, the African continent was particularly hit in 2007 by floods which affected more than two million lives in the Central and Eastern parts in January, and 2.6 million victims in a large region from west to east in July and August of the same year [3]. According to the 4th report of the IPCC, the average global temperature will increase and could reach 4.5°C in 2100. Precipitation will change and the frequency of extreme events in climate variability will be increasingly recurring. However, the results of several studies vary from one region to another, from country to country and even from one local area to another within the same country [2-6]. For Africa as example, many previous studies have investigated extreme events and have showed that changes in extreme temperature and precipitation are contrasting [7]: Indeed, current and future trends suggest that regions in West Africa, including the Sahara, the Horn of Africa, part of central Africa and southern hemispheres, could undergo a warming of order from 3 to 6°C by 2100. Fluviometric regimes will also be affected and may decrease of more than -20 to -30% compared to the reference level 1961-1990 selected by WMO [8] while other studies indicated an increase in extreme rainfall events, particularly in western Niger [5] but also a decrease in Nigeria [9,10], Guinea Conakry [11] in eastern Niger [12], Ivory-Coast [13], in Benin [7] and in South Africa [14]. For the specific case of Togo, according the report of republic of Togo [15], the floods, drought, late rains, high temperatures and high winds, are the major risks in the country. Mono basin which is our study ear would not be spared by these events. In the large Mono basin in Togo rainfed agriculture is the major source of livelihood. Due to high population growth the demand for water supply and food increases permanently. To date, however, no publication has clearly described the future impact of climate change on Mono catchments in Togo. This means that there are no more details for the near and far futures about the impact of climate change on Mono river basin in Togo (West-Africa). Therefore, it urges to conduct studies on climate change projection in this eara in order to take adaptation measures to accompany these communities in their development. We have found necessary to evaluate the future changes of climate indices using the recent World Meteorological Organization (WMO) reference period 1981-2010. In this study, rain and temperature simulated by 8 RCMs from the Africa-CORDEX program have been analyzed through temperatures, average rainfall and extreme precipitation events in 2040, 2070 and 2100 under the greenhouse gas emission scenario RCP4.5 and RCP8.5 over the Mono basin The objective of this work is therefore to provide knowledge and more details about extreme rainfall and temperature for the population of Mono river basin. In particular, it concerns farmers, fishermen, breeders and water resource managers. Regional decision-makers will have the privilege of having the basic elements assessment to guide the policies on adaptation strategies to climate change. The study area used data and the methods are described in the next section 2. Section 3 is only reserved to the results and discussions. The section 4 represents the concluding remarks.
Data and Methods
Study area
Located on the coast of the Gulf of Guinea in West Africa, Togo has a surface area of 56600 km2, bordering the Atlantic Ocean in the south, Burkina Faso in the north, Benin in the east, and Ghana in the west. The Togolese population was estimated more than at 6.3 million inhabitants in 2007 according to the report of UNDP in 2007. The main important rivers are Oti, Mono, kara, keran, Koumongou, Anie, Zio and Haho. Mono basin, which is the study area, is located in the Gulf of Guinea region, more precisely Between 06°16 and 09°20 N and 0°42 and 20°25 E. The Mono basin is almost entirely in Togo although its lower course is between Togo and Benin. Our study considered the part in Togo (Figure 1). It houses a dam of hydroelectric power plant called Nangbeto. Elongated, covering 25400 km2, the Mono basin is the major river of Togo. In general, West Africa's climate is controlled by the interaction of two air masses the inuence of which varies throughout the year with the north-south movement of the Intertropical Convergence Zone (ITCZ). Hot and dry continental air masses originating from the high-pressure system above the Sahara Desert give rise to dusty Harmattan winds over most of West Africa from November to February. In summer, moist equatorial air masses originating over the Atlantic Ocean bring annual monsoon rains [5]. Within this West African context, rainfall in the study area is characterized by two types of rainfall regimes. In southern basin there are two rainy seasons which extend from mid-March to mid-July and from mid-August to October. In northern basin, there is one rainy season which extends from April to October. Indeed, according to the report of PANA-Togo, the country is inuenced by two large climate systems. The tropical Sudanian system in the north with a wet season running from May to October and a dry season from November to April. In this area pluviometry varies from 900 to 1100 mm per year with an average temperature of 28°C. the tropical Guinean system in the south is characterized by two dry seasons and two wet seasons of unequal duration with pluviometry located between 1000 and 1600 mm/year and an average temperature of 27°C. According to the report of WAEMU in 2006, the population of the basin is approximately two million, with an annual increase of 2.9%. This population also distributed at high densities in the south of the basin has as main activities, agriculture (mainly rainfed); in the lower valleys, fishing and salt-farming are the major activities.

Figure 1: Localization of the study area.
Data and sources
The observed daily rainfall and temperature data used in this study, are provided by the Togo National Meteorology Agency (Mateo Togo) for the period 1980-2010 for eight stations spatially located as shown in Figures 1 and 2 and complemented by other sources such as the archives of ORTM Togo and the Mangbetu dam. The missing data values were replaced statistically by similar day averages for the previous years where there were existing data values. Table 1 shows the Codex models used. In order to develop future climate change projections on Mono river basin, the most recent Regional Climate Models (RCMs) provided by the Coordinated Regional Downscaling Experiment (CORDEX) Africa were analyzed. These models were run using different emission scenarios, so-called Representative Concentration Pathways (RCPs) which provide different assumptions of greenhouse gas emission pathways. Two RCPs were selected in this study to cover a wide range from a medium low (RCP 4.5) to high (RCP8.5) global anthropogenic radiative forcing [16]. We made the choice to download the values of several climate variables of eight models available in a spatial resolution 0.44° or 50 km. It has already been used over West-Africa by certain authors [7,17].

Figure 2: Summary of mean projected changes in indices (%) relative to 1981-2010 in three horizons and under the greenhouse gas emission scenario RCP4.5 and RCP8.5 over Mono basin: In axe abscisse 1, 2, 3, 4, 5, 6, 7 and 8 represent R10 mm, R20 mm, CDD, CWD, RX 1 day, PRCPTOT, R90P and R99p, respectively.
| Global model name | Institute ID | Model short name |
|---|---|---|
| GFDL-ESM2M | NOAA-GFDL | NOAA |
| NorESM1-M | NCC | NCC |
| MPI-ESM-LR | MPI-M | MPI |
| MIROC5 | MIROC | MIROC |
| IPSL-CMA5-MR | IPSL | IPSL |
| EC-EARTH | ICHEC | ICHEC |
| CNRM-CM5 | CRNM-CERFACS | CNRM |
| CanESM2 | CCCma | CCCMA |
Table 1: Used climatic models institute of origin (column1), global model under which they are run (column 2) and the short of regional climate model (column 3).
Methods
The seasonal averages as well as the annual averages were calculated using the Climate Data Operator Commands [17]. Then, the free software R is used to compute all the statistical parameters and all the plots presented in the following. In this study, eight climatic indices associated to the precipitations and temperatures were considered as potentially impacting on the availability of water resources, population and agricultural productivity in this zone. These indices, computed with Climate Data Operator Commands, are defined in Table 2 as follow. To bias-correct the model future projection, the cumulative distribution function matching (CD FM) of the model in the reference period is used to identify the corresponding percentile values of the future period. Later the observation CD FM is used to find the climate variable value for the same future cumulative probability, which represents the bias corrected future value. The drawback of the above procedure of bias correction is the assumption of constant bias between the reference and future periods [18]. However, we will accept this assumption as most of the recent studies did [19,20]. As mentioned earlier, bias correction and spatial disaggregation relies on finer-scale observation data and consists of the following steps
• Aggregate finer-scale observed data to an RCM-specific scale.
• Correct the RCM's systematic biases through quantile mapping.
• Disaggregate bias-corrected outputs to a finer scale. An equitation cumulative distribution function matching (equitation CD FM).
| ID | Name | Definition | Units |
|---|---|---|---|
| Frequency indices (adapted from WMO 2009) | |||
| R10mm | Number of heavy rainfall days | Annual count of days when days rainfall > 10 mm | days |
| R20mm | Number of very heavy rainfall days | Annual count of days when days rainfall > 20 mm | days |
| CWD | Consecutive wet days | Maximum number of consecutive days with PRCP* >1 mm | days |
| CDD | Consecutive dry days | Maximum number of consecutive days with PRCP* <1 mm | days |
| Intensity indices (adapted from WMO 2009) | |||
| RX1day | Maximum daily rainfall amount Annual | Maximum consecutive 1-day precipitation | mm |
| PRCPTOT | Annual wet day rainfall total | Annual total precipitation in wet day RR* >1 mm | mm |
| R90 | wet day | Annual total precipitation when RR*>90 percentiles | mm |
| R99 | extremely wet day | Annual total precipitation when RR*>90 percentiles | mm |
Table 2: Selected indices and their Signification.
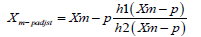
The statistical transformation can be written as:
 (1)
(1)
 (2)
(2)
With (equation 1) for precipitation and (equation 2) for temperature, where Fm-p is the cumulative distribution function (CDF) of the model for a future projection period, and F-1o-c and F-1m-c are quantile functions for observations and model in the reference period, respectively. h1 and h2 were defined by:
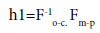 (3)
(3)
and
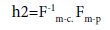 (4)
(4)
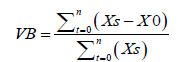
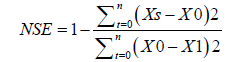
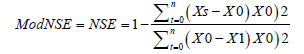
A complete description of this method is described by Gudmundsson et al. [21]. Further, the Figure 3 below is a description of the algorithm used for the rainfall and temperatures disaggregation procedure. Observational data were interpolated before calculations. We used method proposed by Lin et al. [22]. First, the observed climatological temperatures for the baseline period are calculated (Figure 1A) and then aggregated to the RCM specific grid scale (Figure 1B). Second, the factors (also called anomalies) exemplified in Figure 1D are obtained by subtracting the coarse-scale observed monthly means (Figure 1B) from the bias-corrected RCM outputs (Figure 1C) RCM outputs for short hereafter in this subsection). For precipitation, the ratios of RCMs outputs to climatological observations after aggregation are computed to create factor fields, in order to avoid negative, precipitation values [22]. Third, the factors are spatially bilinear-interpolated to the resolution (0.44° × 0.44°) of observation (Figure 1E). Finally, the coarse-scale RCMs outputs are translated to the finer scale (Figure 1F) the factor fields having been subjected to interpolation step (Figure 1E) are summed with observed means in original scale (Figure 1A). For precipitation, to generate the finer spatial pattern, the interpolated factors are multi-plied by the observed fine scale means. Before this procedure, statistical measures such as the Nash-Sutcliffe Efficiency (NSE), the modified Nash -Sutcliffe coefficient (modNSE) and the volume bias (VB) were used to describe and compare the observed and simulated variables. The criteria are defined as follows:
 (5)
(5)
 (6)
(6)
 (7)
(7)

Figure 3: Schematic illustration of the spatial disaggregation process. The downscaled temperature field is constructed from bias-corrected ensemble model mean values in Mono basin.
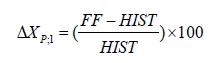
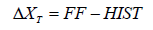
In which Xo is observed variables, Xs simulated variables, X1, mean observed variables and t is time. The range of NSE and modNSE is (←, 1), where 1 represents the perfect accordance of the simulated with the observed data, 0 means that the simulations are as accurate as the mean of the observations, and negative values imply that the observed mean is a better predictor than the regional climatic model (RCM); VB indicates over and underestimations. It estimates the critical variation common between variables (precipitation or temperature for this study). For the validation to be accepted, the coefficient of determination is (ModNSE) should be greater than 0.60 and the Nash- Sutcliffe model Efficiency (NSE) should be greater than 0.60 [23]. And finally, the changes from the reference period are assessed as shown by equations 8 and 9 respectively for pre- capitations and indices (ΔXP; I) and temperature (ΔXT).
 (8)
(8)
 (9)
(9)
where FUT and HIST represent respectively for the futures (2040, 2070 and 2100) and the historical or reference period (1981-2010).
Results
RCMs models and their validation results that Table 3 give an overview of the performance criteria within the validation periods investigated. The validation was performed on the RCMs model over the Mono basin for the period 2001-2010. The RCM attain for the historical periods NSE values between 0.58 and 0.69, and modNSE reaches high values from 0.59 to 0.81. The volume bias indicates in general overestimations and underestimations. The volume bias values are between -14 and 12% and show that, there are differences between observations and simulations data for the validation historical periods. The higher bias between simulated and observed data, may be caused by errors in measuring data and errors associated with the model. The statistical analysis of the validation results shows that there is no enough an agreement between simulated and observed variables which such as mean temperature (Tm) and precipitations (Pm). Obviously, current RCMs still have substantial deficiencies in simulating the regional climate over Mono. To produce the reliable projections required for regional climate assessment, we need to bias-correct the raw RCM outputs. This is amelior an agreement between simulated and observed variables.
Projected changes in indices, temperature and precipitation
For a given time period (2011 to 2040, 2041 to 2070, or 2071 to 2100) and emission scenario (RCP4.5 or RCP8.5), projections from different RCMs are considered equally plausible in the representation of future climate, and subsequently the multimodal ensemble is built through the arithmetic mean. In this section, we first analyses the projected changes in indices, after temperature and then precipitation.
Changes in Frequency Indices
The projected changes in the future of R10 mm and R20 mm
Changes in the future of the number of heavy rainfall days (R10 mm) and very heavy rainfall days (R20 mm) are particular importance because of the link with flooding. The relative changes in mean of R10 mm and R20 mm, analyzed between the futures and the historical periods under two scenarios is represented on the (Figure 4). Under the RCP4.5 scenario, the mean- models predicts an increase of R20 mm of 15% (mean value) over the center of the basin, from 30 to 50% over the south and a rise from 20 to 60% over north by horizon 2040. The RCP8.5 scenario predicts, an increase of R20 mm averaging from 30 to 50% over the whole basin by 2040. By 2070 and under the RCP4.5 scenario, the multi-RCM ensemble mean projected show an increase of R20 mm ranging from 10 to 50% in some parts north. This increase is around from 30 to 70% the southward of Mono basin. On this same projection period and under the scenario RCP8.5, the mean-models provides, an increase of R20 mm the southward of the basin ranging from 5 to 40% against 20 to 40% the northward. Concerning the far future (horizon 2100) under the RCP4.5 scenario, the mean-models predicts an increase of R20 mm in the whole basin: the northward of the basin this increase is close from 30 to 50% in some locality whereas it is in average from 10 to 20% the southward of the basin. Under the RCP8.5 scenario, the mean-models projects an increase from 10 to 30% over basin by 2100. In Overall, the scenario RCP4.5 provide for an increase of R20 mm of 40% while the scenario RCP8.5 predicts an increase of R20 mm of 15% (Figure 4).

Figure 4: Relative change of the number of heavy rainfall days(R10) and extremely heavy rainfall days (R20) between the futures (2011-2040), (2041-2070) and (2071-2100) and the historical period (1981-2010) for the average multi-model forced by RCP4.5 and RCP8.5 greenhouse gas scenarios in Mono basin.
Considering the R10 mm, under the RCP4.5 scenario, mean-models predicts a slight variation from 10 to 20% on average southward of basin, while it presents a nuance the northward of the basin with an increase of 25% (mean value) at the 2040 horizon in some area. However, over the same projection period, the RCP8.5 scenario provides for an average in R10 mm from -10% to 30% over the entire basin. By 2070 and under the RCP4.5 scenario, the mean-models provides an average in R10 mm from -5 to 5% over the northern part of the basin, while under the scenario RCP8.5, the mean-models projects a actuation from -8 to 15% over the northern part of the basin by 2070. Finally, by 2100 and under the RCP4.5 scenario, the mean-models predicts the increase of R10 mm from 5 to 10% on average over the northern basin, decrease -5% (mean alue) in the south of the basin while under the RCP8.5 scenario the mean-models predicts a variation over the southern part of basin and an increase from 0 to 5% over the other of basin. In Summary, the scenarios RCP4.5 and RCP8.5, provides a decrease in average R10 mm by -4.8% while R20 will increase of 26.6% (Figure 4).
The projected changes in the future of CDD and CWD
To characterize extreme events rainy, we have analyzed the following others climatic indices: the maximum duration of the number of consecutive wet days (CWD) and the maximum number of consecutive dry days (CDD). The changes relating to the CDD between the futures and the historical period are shown in Figure 5. Under the RCP4.5 scenario, the mean-models predicts a sharp increase in CDD of 40% (mean value) in the center of the basin, a variation from 40 to 70% in the south and a slight increase 30% (mean value) in some part of north and an increase on the rest of this locally by 2040. While under the RCP8.5 scenario predicts, an increase of CDD from 10 to 60% the southward and in the center, an increase of 35% (mean value) over part of the north and an increase 70% (mean value) on the other part by 2040 horizon. By 2070 horizon and under the RCP4.5 scenario, an increase in CDD is projected by the mean-models that can fluctuate from 30 to 50% on average in some areas in the south. This increase varies from 20 to 40% northward and from 10 to 70% in the basin center. On this same projection period and under the scenario RCP8.5, the mean-model also predicts a strong increase in CDD the southward of the basin ranging from 30 to 70% against 10 to 40% the northward. Regarding the far future (horizon 2100) under the RCP4.5 scenario, the mean-model predicts a variation of CDD in the whole basin: the northward of the basin, this change fluctuates between 10 and 40% whereas it varies on average from 40 to 60% in the south basin. Under the RCP8.5 scenario, the mean-model projects an increase from 40 to 60% in the north and 60% in the south of the basin by the horizon 2100.
The map plots in Figure 5 summaries also the degree of relative change of the CWD between the futures and the historical period for the average multi-models forced by RCP4.5 and RCP8.5 greenhouse gas scenarios in Mono basin. Over the entire basin, the mean-models predicts a decrease of CWD at the 2040 horizon: from -10 to -30% on average the northward against -10 to -20 the southward under RCP4.5 scenario and from -30 to 0% in the northward, a decrease of -10% (mean value) the southward of the basin under the scenario RCP8.5. If we consider this index by 2070, under the RCP8.5 scenario, the meanmodels predicts a slight in decrease from -30 to 0% on average in the center and northward of the basin, while it has a nuance in the south of the basin with a fluctuation from -20% to 20% by some areas. Over the same projection period, the scenario RCP4.5 predicts a sharp decrease in CWD on average from -10% to -30% in the north and a actuation between -20 and 10% southward of the Mono basin. By 2100 and under the RCP8.5 scenario, the mean-models predicts a decrease in CWD of from -10 to -15% over the south basin, against a fluctuation from -10 to 20% in the center and south. However, under the RCP4.5 scenario, the mean-models projects a sharp variation from -30 to 20% over the entire basin and by 2100. Overall, the RCP4.5 and RCP8.5 scenarios predict an increase in consecutive dry days of 35% and a decrease in consecutive wet days of -14% on the whole of the Mono watershed as shown in the Figure 5.

Figure 5: Relative change of the Maximum duration of dry sequences (CDD) and Maximum duration of wet sequences (CDW) between the futures (2011-2040), (2041-2070) and (2071-2100) and the historical period (1981-2010) for the average multi-models forced by RCP4.5 and RCP8.5 greenhouse gas scenarios in Mono basin.
Changes in Intensity Indices
The projected changes in the future of PRCPTOT and RX1day
The relative differences of the maximum daily rainfall amount Annual (RX1day) between the future and historical period are shown in the Figure 6. Under the RCP4.5 scenario, the mean-models foresees an actuation of RX1day between -45 and -60% on average over the entire basin against a decrease from -40 to -65% under the RCP8.5 scenario for a large part of the basin by 2040. By 2070 and under the RCP4.5 scenario, a decrease of RX1day will projected by the mean-models varying between -45 and -65 over the entire basin. The northward this drop will be from -55 to -65. whereas it varies from -60 to -50% in the south of the basin. On this same projection period and under the RCP8.5 scenario, the mean-models predicts a strong decrease of RX1day on the whole north basin varying from -65 to 55% against -55 to -50% in the southern part. For the horizon 2100, under the RCP4.5 scenario, the mean-models predicts a variation on the entire basin as follow: south of the pelvis a decrease of RX1day of -30% (mean value) whereas it fluctuates on average between -65 and -55% in the north of the basin Under the RCP8.5 scenario, the mean-models projects a decrease of RX1day from -65 to -50% in the north against -60 to -50% in the southern part of the basin by 2100. On the whole of the basin, the mean-models predicts a decrease of RX1day an average of -55% (mean value) under scenario RCP4.5 and a decrease of -52% (mean value) of RX1day under RCP8.5 scenario compared to the reference. For the PRCPTOT (Figure 6), Under the RCP4.5 scenario, the mean-models predicts a decrease of PRCPTOT from -40% to -10% on average in the north of the basin, while, it predicts a low the southward of the basin with a variation from -40 to -20% in some localities by 2040. However, the same projection period, the RCP8.5 scenario predicts a variation in the PRCPTOT on average from -30% to 15% in the north by 2040 horizon. By 2070 horizon and under the RCP4.5 scenario, the meanmodels provides a decrease of PRCPTOT by less than -10% (mean value) over the whole basin, while under the RCP8.5 scenario, the mean-models projects a decline in the PRCPTOT from -40 to -20% in the southern part and from -20 to -30 in the north of the basin by 2070. Finally, by 2100 and under the RCP4.5 scenario, the average multi-model predicts a decrease in the PRCPTOT from -40 to -20% on average overall of the basin. Under the RCP8.5 scenario, in the far future the mean-models predicts a decrease of the PRCPTOT from -10 to -40% over the Mono river.

Figure 6: Relative change the Annual wet total wet day (PRCPT) and the maximum daily rainfall amount Annual (RX1d) between the futures (2011-2040), (2041-2070) and (2071-2100) and the historical period (1981-2010) for the average multi-models forced by RCP4.5 and RCP8.5 greenhouse gas scenarios in Mono basin.
The projected changes in the future of R90P and R99P
The relative changes of the R90P between the future and historical period are shown in the Figure 7. Under the scenario RCP4.5, the meanmodels predicts a decrease of R90P from -40 to -30% on average in the south of the basin, a decrease from -20 to -10% in the north and from -50 to -40% in the center by 2040 horizon, while the RCP8.5 scenario predicts a decrease in average from -60% to -20% in the north, from -60 to -70% the southward by 2040. By 2070 and under the scenario RCP8.5, a decrease of R90P is projected by the mean-models up to an average from -50 to -30% in the north but, a decrease is around from -50 to -30% the southward of the basin. In this same projection period and under the RCP4.5 scenario, the mean-models predicts, an actuation in R90P over the entire basin varying from -60 to -30%. For the far future, under the RCP4.5 scenario, the mean-model provides an actuation on the whole basin: In the south of the basin a decrease of R90P is around -40% in some locality whereas it actuates on average between -30 and -10% the northward of the basin. Under the RCP8.5 scenario, the meanmodels projects a decrease in R90P from -60 to -10% over the entire basin by 2100. On the whole basin the mean-model predicts a decrease of -30% on average under RCP4.5 scenario and -45% (mean value) under RCP8.5 scenario compared to the reference. Regarding the R99P (Figure 7), under the RCP4.5 scenario, the mean-models predicts an increase of the R99P from 60% to 80% on average north of basin, while it is forecasting a variation in the southern basin with a variation from 20 to 40% by 2040 horizon. However, over the same projection period, the RCP8.5 scenario provides for an increase of the R99P on average from 20% to 60% in the south of the basin, some areas of the north, will see a much smaller an increase with an average of 30% (mean value) by 2040 horizon. By 2070 horizon and under the RCP4.5 scenario, the mean-models provides a variation of the R99P from 20 to 40% over the whole basin, while under the scenario RCP8.5, the mean-models projects an increase from 10 to 40% over the north, it is forecasting a slight increase in the southern basin with an increase from 25 to 10% by horizon 2070. Finally, by 2100 and under the RCP4.5 scenario, the mean-models projects an increase of R99P from 20 to 50% on average over the whole of the south basin while at north some localities will experience a rise from 20 to 35%. Under the RCP8.5 scenario, in the far future the mean-models predicts an increase of R99P from 20 to 40% in the south and 40 to 70% on the whole basin. The Table 4 shows the results presented above for the average multi-models.

Figure 7: Relative change the wet day (R90P) and extremely wet day (R99P) between the futures (2011-2040), (2041-2070) and (2071-2100) and the historical period (1981-2010) for the average multi-models forced by RCP4.5 and RCP8.5 greenhouse gas scenarios in Mono basin.
Seasonal Changes of Temperatures and Rainfall
Seasonal variations of temperatures
The projected changes in Mono basin average temperatures from all RCMs runs are portrayed by boxplots in Figure 8. Mono basin average temperatures are expected to increase from 1.0 to 2.5°C, from 1.2 to 4.7°C, and from 2.3 to 7.8°C, depending on the calendar month, for the beginning, middle, and end of the 21st century, respectively, under the both RCP. The boxplots in Figure 8 measure the model dispersion through five statistics: sample minimum, lower quartile, median, up-per quartile, and sample maximum. Obviously, the dispersion described by the maximum minus minimum increases steadily from 1 to 4.10C under RCP4.5 from the beginning to the end of the 21st century, which implies the intermodal dispersion tends to broaden with time for all calendar months, reacting the increase in uncertainty when we move further into the future. Additionally, for the minimum to maximum range of RCM-projected temperature change, there is no substantial variation with respect to the seasonal cycle. For the period 2011-2040 (Figures 8A and 8B), the magnitudes of temperature increase for RCP4.5 and RCP8.5 are similar due to the small difference between the two emission pathways. As a result of the rising radiative forcing pathway leading to 8.5 Wm2 by 2100 for scenario RCP8.5, the climatological temperature begins to show vastly different features after the mid-century. The monthly temperature increase can reach from 4 to 7.8°C under RCP8.5, but only about from 2.3 to 4.2°C under RCP4.5 for the end-of-century.

Figure 8: Projected changes average precipitation (°C. month-1) for each calendar month from the reference period (1981-2010) to (a, b: 2011-2040, top row), (c, d: 2041-2070, middle row), and (e, f: 2071-2100, bottom row) under two emissions scenarios (columns), showing all model results by means of boxplots. The band near the middle of the box shows the median and the bottom and top of the central rectangle spans the first quartile to the third quartile. Whiskers above and below the box show the location of the maximum and minimum.
Seasonal variations of rainfall, Figure 9 displays the changes in climatological monthly precipitation, averaged across Mono basin, for the periods 2011-2040, 2041-2070 and 2071-2100 under two emissions scenarios. In any time, slices, results from the multimodal medians suggest a decrease in precipitation for all seasons, with no significant differences between the two scenarios. The magnitude of the decrease peaks in rainy season (April to October), with the smallest change in dry season (November to March). Also, seasonal differences in rainfall tend to become significant toward the late 21st century. In terms of the minimum to maximum range, the intermodal dispersion decreases by approximately 13 mm from the beginning to the end of century, with a month-to-month range from 2 to 45 mm under RCP4.5. However, the interquartile range decreases only slightly, by about 5 mm, with a high value of 11 mm. The uncertainties in the projections have a marked seasonal signature with high intermodal dispersion in the rainy season. Unlike RCM runs. However, the majority temperature, changes in precipitation is not expected to have a consistent change in sign among all the of horizons show decreases in precipitation.

Figure 9: Projected changes average precipitation (mm. month-1) for each calendar month from the reference period (1981-2010) to (a, b: 2011-2040, top row), (c, d: 2041-2070, middle row), and (e, f: 2071-2100, bottom row) under two emissions scenarios (columns), showing all model results by means of boxplots. The band near the middle of the box shows the median and the bottom and top of the central rectangle spans the first quartile to the third quartile. Whiskers above and below the box show the location of the maximum and minimum.
Discussion
The analysis of extreme weather indices show that all climate projections indicate an overall increase in temperatures in the Mono catchment. But we have realized that there is no enough consensus on some precipitating clues. Some climate projections suggest an increase in these indices and others indicate a decrease (Figure 2). The variations of the indices will depend strongly on emission scenarios and horizons as showed on Figure 2. To have better comprehension of results of in this paper it is important to look at the results of other regions or countries. The great disparity observed in precipitation changes could be due to the type of forcing or the type of convection used in West Africa. We estimated that the spatially inconsistent changes of climate indices noticed are likely linked to the high of the heterogeneousness of the rainfall. Indeed, the Mono basin is characterized by two types of rainfall regimes. In southern there are two rainy seasons which extend from mid-March to mid-July and from mid-August to October. In northern basin, there is one rainy season extends from April to October. The temperature increases, and some precipitation indices projected by the average multimodal are consistent with other studies in West Africa: Kouakou et al. [24] applied the RegCM3 regional climate model driven by the ECHAM5 model to simulate temperatures and precipitation over Ivory-Coast. The results of this simulation predicted an increase in average annual temperatures of 3°C to 4.2°C in the 21st century. Meehl et al. [25] have estimated that these areas of Guinean Africa can expect to experience more intense, more frequent and longer heat waves during the 21st century. Kouakou et al. [24] which estimated the decrease in precipitation on the Western Sahel to about -12.6% by 2091-2100. Diallo et al. [26] showed that the decrease in mean rainfall in this area of West Africa could probably be induced in part by a weakening of the moisture from local sources, slowing down the hydrological cycle. Diallo et al. and Tall et al. [26,27], found a strong decrease in precipitation by 2100 under the RCP8.5 scenario. In general, when considering the number of rainy days and the intensity of rainy days, (mostly declining or rising) is coherent with that of rain simulated average. In Additionally, this study therefore shows that extreme precipitation does not always correspond to a decrease in average rainfall. Extreme rains in some areas could lead to some extreme events such as floods. The analysis of the maximum duration of wet sequences shows a sharp decline in the basin Mono in the future. Ly et al. [28] showed a gradual decrease in the maximum duration of the number of wet sequences in West Africa since 1960. Our work shows that such a change diagnosed on the present climate is likely to persist of more and more in the future. The decrease of the maximum duration of wet sequences in Togo and particularly on the Mono basin appears to be consistent with the evolution of the maximum duration of dry sequences because a sharp decrease in the maximum duration of wet sequences could favor an increase in the maximum length of the dry sequences. This decrease (respectively increase) of the wet sequences (respectively dry sequences) on the basin Mono is a response to global warming [29]. Such a situation in Togo and particularly on the Mono basin could have adverse consequences on certain human activities depending heavily on summer rainfall such as rainfed agriculture and livestock in the future.
The contribution of our study in the area is the use of several variables (analyzed in several models) on the several horizons based exclusively on precipitation and temperature parameters and to analyze the rainfall patterns season and determine the factors of their temporal change. The results of this study could enable policy makers to adapt strategies needed for better management of water and natural disasters, and the development of a resilient agricultural system in the face of climate change.
Conclusion
This study, carried out with a mean of 8 RCMs from Africa-CORDEX program, shows changes in temperature and precipitation (average and extreme events) on the Mono basin. In the future, the Mono basin will be marked so by a climate context of decreasing rainfall and increasing temperatures. This recession will result in a downward change in total precipitation, consecutive wet days, wet days, the Annual wet total wet day and the maximum daily rainfall amount Annual and an increase in consecutive dry days, extremely wet days. These climatic indices have also been analyzed in order to characterize the events. Indie, according to the RCMs and the both scenarios, the number of heavy rainfall days and extremely heavy rainfall days, will decrease and rise for the both scenarios, respectively. However, for the dry and wet sequences, the scenarios RCP8.5 and RCP8.5 predict a rise of consecutive dry days from 26 to 41% and a decrease of consecutive wet days from -5 to 28.5%. For the intensity indices such as, the annual wet day rainfall total, we will observe a decrease from -4.8 to -10.3% while, for the maximum daily rainfall amount annual will decrease between -53.3 and -52.6% for the both scenarios. The wet day will decrease and extremely wet day (R99) will increase under for the both scenarios (RCP4.5 and RCP8.5) predicts in general at all horizons. It is thus evident that these future climate conditions may have important consequences, for soil erosion, replenishment of soil moisture, and occurrence of ash floods and droughts. The results of this study can help to increase resilience of certain human activities such as agriculture source of food and income very important for the populations. In short, further work is needed in order to improve the impact assessments of the climate change on water resources and on certain human activities such as agriculture, energy, fisheries and breeding.
Acknowledgments
We acknowledge the financial support from the Deutscher Akademischer Austausch Dienst (DAAD).
Conflicts of Interest
The authors declare no conflicts of interest.
References
- IPCC (2013) Summary for policymakers. Climate change scientific evidence. Contribution of working Group I to the fifth assessment report of the intergovernmental panel on climate change. Cambridge University Press, Cambridge, UK and New York (New York State), USA.
- IPCC (2013) Climate change. The physical science basis. Contribution of working Group I to the fifth assessment report of the intergovernmental panel on climate change. Inter-governmental Panel on Climate Change p : 1535.
- Wade S, Faye S, Dieng M, Kaba M, Kane NR (2017) Tele-detection of urban flood disasters: The case of the dakar region (Senegal). Journ D Animat Sci 9: 29.
- Suppiah R, Hennessy KJ (1990) Trend in total rainfall, heavy rain events and number of dry days in Australia. Int J Climatol 10:1141-1164.
- Nicholson SE, Webster PJ (2007) A physical basis for the inter annual variability of rainfall in the Sahel. Meteorol Soc 133: 2065-2084.
- Goula BTA, Savane IB, Konan V, Fadika, Kouadio GB (2006) Comparative study of the impact of climatic variability on the water resources of the Nzo and Nzien Cote d voire basins. Vertigo 7: 1-12.
- Yekambessoun NTM, Emmanuel ID, Agnide Lawin ID, Benjamin KY, Ganiyu TO, et al (2017) Decreasing past and mid-century rainfall indices over the Ouemé river basin. Benin 5: 74.
- Bigot (2003) variabilite climatique interaction at modification environnement. Variabilite climatique. Interaction et Modification Environnement 4: 8141.
- Oguntunde PG, Abiodunb BJ, Lischeid G (2000) Rainfall trends in Nigeria. J Hydrol 411: 207-218.
- Easterling DR, Evans JL, Groisman PY, Karl TR, Kunkel KE, et al (2000) Observed variability and trends in extreme climate events: A brief review. Bull Am Meteorol Soc 81: 417-425.
- Aguilar E, Aziz Barry A, Brunet M, Ekang L, Fernandes A, et al. (2009) Changes in temperature and precipitation extremes in western central Africa. Guinea Conakry and Zimbabwe. J Geophys Res 114: 2115.
- Ozer A, Ozer PD (2005) Eserti_cation in the Sahel: Climatic or anthropic crisis. Seancel Acad R Sci d’Outre-Mer 51: 395-423.
- Soro GE, Nouf D, Goula BTA, Shorohou B (2016) Trend analysis for extreme rainfall at sub-daily and daily timescales in Cote d'Ivoire. Climate 4: 37
- Mason SJ, Waylen PR, Mimmack GM, Rajaratnam B, Harrison JM (1999) Changes in extreme rainfall events in South Africa. Clim Chang 41: 249-257.
- Togo MERF (2009) Plan d'action national d'adaptation aux changements climatiques. Lome 10: 24
- Moss R, Babiker M, Brinkman S, Calvo E (2007) Towards new scenarios for analysis of emissions climate change impacts and response strategies. IPCC expert meeting report.
- bazyomo sd, lawin ea, ouedraogo a (2017) Seasonal trends in solar radiation available at the earth's surface and implication of future annual power outputs changes on the photovoltaic sys-tems with one and two tracking axes. J Climatol Weather Forecasting 5: 201.
- Sherien F, Miguel Angel R, Han D (2017) Uncertainty of Intensity-Duration-Frequency (IDF) curves due to varied climate baseline periods. Journal of Hydrology 547: 600-612.
- Sarr MA, Seidou O, Tramblay Y, El Adlouni S (2015) Comparison of downscaling methods for mean and extreme precipitation in Senegal. J Hydrol 4: 369-385.
- Sunyer MA, Hundecha Y, Lawrence D, Madsen H, Willems P (2015) Inter comparison of statistical downscaling methods for projection of extreme precipitation in Europe. Hydrol Earth Syst Sci 19: 1827-1847.
- Gudmundsson L, Bremnes JB, Haugen JE, Engen Skaugen T (2012) Technical note: Downscaling RCM precipitation to the station scale using statistical transformations: A comparison of methods. Hydrol Earth Syst Sci 16: 3383-3390.
- Lin W, Wen C (2013) A CMIP5 multimodel projection of future temperature precipitation and climatological drought in China. Int J Climatol 34: 2059-2078.
- Awotwi A, Kumi M, Jansson PE, Yeboah F (2015) Predicting hydrological response to climate change in the White Volta Catchment. J Earth Sci Clim Change 6: 249.
- Kouakou KE, Kouadio ZA, Kouassi FW, Goula Bi TA, Savane I (2014) Modelisation de la temperature et de la pluviom_etrie dans un contexte de changement climatique: Cas de l'Afrique de l'Ouest. Afrique Sciences 10: 145-160.
- Meehl GA, Tebaldi C (2004) More intense, more frequent and longer lasting heat waves in the 21st century. Science 305: 994-997.
- Diallo I, Giorgi F, Deme A, Tall M, Mariotti L, et al (2016) Projected changes of summer monsoon extremes and hydroclimatic regimes over West Africa for the twenty-first century. Climate Dynamics. 49: 3931-3954
- Tall M, Sylla MB, Diallo I, Pal JS, Faye A (2016) Projected impact of climate change in the hydroclimatology. Theoretical and Applied Climatology 129: 655-665.
- Ly M, Traor SB, Alhassane A, Sarr B (2013) Evolution of some observed climate extremes in the West African Sahel. Weather and Climate Extreme 10: 19-25.
- Sylla MB, Nikiema PM, Gibba P, Kebe I, Klutse NAB (2016) Climate change over West Africa:Recent trends and future projections. Adaptation to climate change and variability in rural West Africa 1: 25-40
Citation: Batablinle L, Lawin E, Agnide S, Celestin M (2018) Africa-Cordex Simulations Projection of Future Temperature, Precipitation, Frequency and Intensity Indices Over Mono Basin in West Africa. J Earth Sci Clim Change 9: 490. DOI: 10.4172/2157-7617.1000490
Copyright: © 2018 Batablinle L, et al. This is an open-access article distributed under the terms of the Creative Commons Attribution License, which permits unrestricted use, distribution, and reproduction in any medium, provided the original author and source are credited.
Select your language of interest to view the total content in your interested language
Share This Article
Recommended Journals
Open Access Journals
Article Tools
Article Usage
- Total views: 4890
- [From(publication date): 0-2018 - Dec 09, 2025]
- Breakdown by view type
- HTML page views: 3877
- PDF downloads: 1013