Analysis of Climate Variability (ENSO) and Vegetation Dynamics in Gojjam, Ethiopia
Received: 23-Oct-2015 / Accepted Date: 06-Nov-2015 / Published Date: 16-Nov-2015 DOI: 10.4172/2157-7617.1000320
Abstract
This study analyses the regional climate variability, especially La Niña or El Nino Southern Oscillation events and their impact on rainfall variability and vegetation coverage. The temporal and spatial distributions of temperature, precipitation, and vegetation coverage have been investigated for the two agricultural productive seasons from (2000–2008), using data from 11 meteorological station and MODIS satellite data in Gojjam, Ethiopia. The normalized difference vegetation index (NDVI) is widely accepted as a good indicator for providing vegetation properties and associated changes for large spatial scale. The analyses indicated that climate variability is quite common particularly in the small rainy season, Belg and continues to affect the vegetation condition in the region. The statistical correlation analysis indicated that there is a strong positive correlation between NDVI and the seasonal rainfall in most years, whereas, the temperature increase decreases the vegetation coverage in both seasons. The effect of ENSO, climate variability has been high to the regional rainfall variability in mostly of the months or years. In the fully strong El Nino or La Nina episode years like 2000 and 2002 the SST and rainfall showed positive correlation with r2 values 0.75 and 0.63, respectively. The NDVI anomaly pattern is almost similar to that of the main documented precipitation and temperature anomaly pattern associated with ENSO. The spatial and temporal analyses of basic climate elements and NDVI values for the growing season showed that NDVI and rainfall are highly variable during the 9 years period. The ENSO analyses showed an increase in seasonal vegetation coverage during El Nino episodes contrasting to La Niña episodes. However, there has been a rainfall delay during El Niño episodes in the first one or two months of Kiremt season.
Keywords: Climate variability; La Niña or El Niño Southern Oscillation; Normalize different vegetation indices; Remote sensing; Spatial and temporal
10161Introduction
In recent years, ENSO events and resulting severe damage or rainfall variability have become more frequent globally [1]. The El Niño and La Niña (ENSO) events are the main causes of Ethiopian climate variability, including Gojjam region [2,3]. Climate variability and its impact in different sector becomes a national problem that attracts the attention of nation leaders or scientists due to the frequent occurrences of damage particularly in agricultural sector [4]. Agriculture is the backbone of region’s economy and 85% of the population lives in highlands depending on agriculture and favorable climatic conditions, which limits the productiveness of the area. However, nowadays climate variability becoming high and unseasoned rainfall is often observed [5]. The basic climatic elements such as rainfall and temperature show seasonal or annual fluctuations somewhat different from normal expected climatic conditions in the region, which are very important to agriculture productivity in the area [4]. Understanding the impact of vegetation dynamics to climate variability and response of vegetation on climate variability at the inter-annual to decadal time scales are desirable. The climate variability impact that was somehow common to semi-arid region is also expanding to the highlands as highland environment is intervened by human intervention and global change [6]. The vegetation coverage becomes sparse in many parts of the region and it is likely to become very sparse in places where the climate is highly variable [7]. Besides, there is a growing concern that the interaction between climate variability and vegetation dynamics is not well investigated, and the interaction differs from region to region. According to many previous studies, rainfall, temperature, and NDVI have a positive relation in some region [8-10]. However, there is negative in other regions depending on geographical position, geomorphology, vegetation type, climatic condition [11]. Rainfall is much more variable in both time and space than other climatic factors. All other factors of vegetation dynamics are most likely dependent of climatic factors and they do not vary temporally in a very short period of time like temperature and rainfall. El Niño originates in the Eastern Pacific, but its warming effect is rapidly spread by the winds that blow across the ocean altering the weather patterns in more than 60 percent of the planet’s surface [12]. Climate variability is the most important cause of food insecurity in the major part of Africa [12]. In Zimbabwe, the El Niño episode had been the cause for crop production deficit and decrease in NDVI due to the rainfall shortage in December, January, February, and March in ref. [13]. In Ethiopia, the El Niño has been the cause of crop failure, livestock death, food insecurity and others problems for many years. Since, the rainy season in Gojjam, Ethiopia mostly dependent on El Niño and La Niña events occurring in the Tropical Pacific Ocean [1]. Analyzing El Niño/La Niña-Southern Oscillation episodes together with other climatic parameters would be helpful for many sectors. Changes are rapidly occurring in the region relating to climate variability and vegetation conditions. Therefore, understanding the interaction between climate elements and vegetation condition in response to climate variability in regional scales would have great scientific importance. The main objective of this study is to analyze the NDVI, rainfall and Sea Surface Temperature (SST) anomalies in different time scales (monthly seasonally, and yearly) that are highly variable in Gojjam, Ethiopia for short (Belg) and long (Kiremt) rainy seasons using satellite remote sensing and geostatistical techniques. This study also aims at investigating the statistical relationship between rainfall, normalized difference vegetation indices, and Sea surface temperature anomalies in the study period from (2000- 2008).
Description Of Study Area
Location
Gojjam is located in the northwestern part of Ethiopia, in Eastern Africa, under Amhara region between 10°58'20.09"N and 37°29'23.68"E. It covers an area of about 28,076 km2 and a population of 4,260,394 [14]. This region is distinctive for lying entirely within the bend of the River Gihon (Blue Nile). The Region shares boundaries with Gonder in the North, Wolo in the East, Awi in the West, Welega, Addis Abebe and Shewa in the South. Depending on the administrative division of the country, the region Gojjam categorize into two zones eastern and western Gojjam. From digital elevation model of the region, the elevation ranges from the lowest 639 m in every border of the region to the highest 4038 m in the center. The topography of Gojjam divided into two parts, namely the highlands and lowlands. The highlands are above 1,800m above sea level and comprise the largest part of the central, southeastern, and southwestern part of region. From rugged largest continuous chains of mountains and plateaus in the region, choke (4038 m) is the largest and thinking to be the source of Blue Nile (Figure 1).
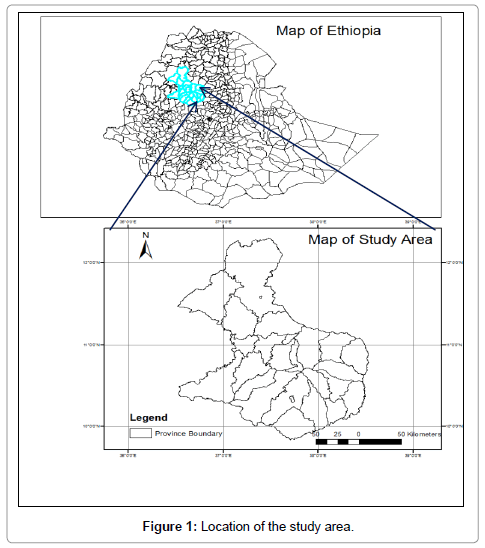
Figure 1: Location of the study area.
Land use-cover of the region
The most dominate land use and cover types in the region are forest, scrublands, grasslands, cultivated land, rural settlement and farmland, urban settlements, plantation, water body and croplands (Figure 2). Significant increases in demand for food have resulted in an expansion of croplands by influencing on uncultivated areas like forests, shrub, and marginal lands. The expansion of croplands toward forest, shrub, and marginal lands, including continuous and over cultivation, has resulted in deforestation and soil degradation. Similarly, increased demands for fuel wood in the absence of alternative sources of energy have led to the destruction of forests [15]. They have also led to the increased use of crop residues and animal dung for fuel rather than using these as sources of organic fertilizer to replace the fertility levels of the soils [16]. According to Zeleke and Hurni, even in small part of region the land use-cover change from (1957-1995) clearly indicated that there was a decrease of vegetation conditions or serious land degradation in the region [17]. The natural forest cover declined from 27% in 1957 to 2% in 1982 and 0.3% in 1995, while cultivated land increased from 39% in 1957 to 70% in 1982 and 77% in 1995.The changes have been dramatic for the traditional agricultural system, and the impacts are now highly visible. Vegetation cover has completely declined, the proportion of degraded lands has increased, the total annual soil loss rate is high, and soil productivity is decreasing [16]. Environmental and vegetation degradation has resulted from mismanagement of land resources, overgrazing, deforestation, and inappropriate land use systems [15].
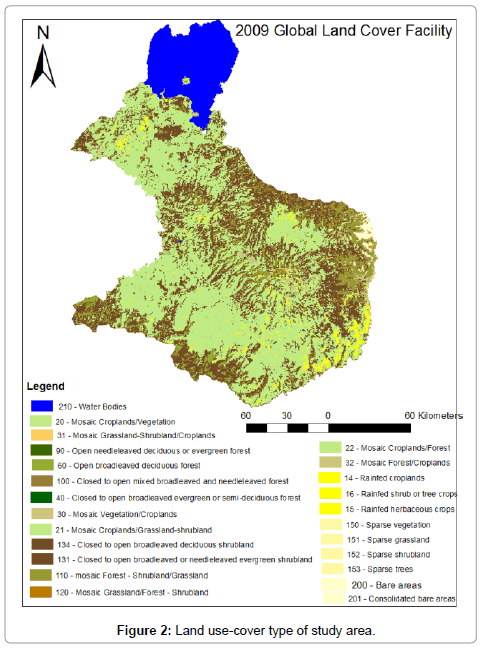
Figure 2: Land use-cover type of study area.
Climatic and vegetation characteristics of Gojjam
Gojjam, Ethiopia is located within the tropics so that the average annual temperature in the region is moderate and a variation is low [18]. Although latitude mainly influences the overall temperature, the great variations in altitude and slope aspects also have very significant effects on regional microclimates and temperature. The most dominant crop in this climatic zone is Barley [19-21]. Highlands above an altitude of 1500 m experiences relatively cool temperature conditions in contrast to the lowlands. Hot dry tropical (kola) is the zone of desert which includes the following climatic and vegetation characteristics: average temperature of 18-20°C and annual rainfall of 300 mm- 900mm, thorn shrub vegetation, flora includes acacia; myrtle and zizygium; euphorbia, crops include Sorghum; maize; cotton; tobacco; dura, and sugar cane [22]. Whereas, sub-tropical zone (Woina Dega) zone includes the following: is warm and moderate, the temperature between 15-18°C and annual rainfall varies from 500 mm-1500 mm, agricultural products or cereals are soft grains; barley; teff; maize; wheat. Cool (Dega) zone includes the following: the temperature between 10-15°C and rainfall varies from 700mm-1700mm [19]. This area is adapted for raising livestock and sustainable growing barley; wheat; teff; beans; flax; temperate fruits, trees include the wild olive; juniper; Kosso tree [23]. The climate of Gojjam, Ethiopia is mainly controlled by the seasonal migration of the Inter-tropical Convergence Zone (ITCZ), which follows the position of the sun relative to Earth and the associated atmospheric circulation, in conjunction with the country’s complex topography [24]. The mean minimum during the coldest season is 11°C and the mean maximum rarely exceeds 26°C. In most parts of the region, the hottest month come in May immediately before the main rainy season and the reduction of solar radiation by the heavy cloud cover [18]. Although the maximum temperature fluctuated over time in both seasons, Belg season particularly (March, April and May) shows the highest maximum temperature that ranges from 26°C to 29°C as compared to Kiremt season [25].
According to National Meteorological Agency, there are three seasons in the region: Bega (dry season) from October to December, Belg (small rainy season) from February to May and Kiremt (main rainy season) from June to September [26,27]. The Belg rains begin when the Saharan and Siberian High Pressures are weakened and various atmospheric activities occur around the Horn of Africa [25,28]. Besides, in the Belg season, Low-pressure air related to the Mediterranean Sea moves, and interacts with the tropical moisture and then that may bring precipitation to the region [24]. The high pressure in the Arabian Desert also pushes that low-pressure air from south Arabian Sea into mid and southeast Ethiopia, which in turn, creates the Belg rains [1,25,28]. The beginning of the Belg rain is also the period when the Inter-tropical convergences zone (ITCZ) begins to reach south and southwest Ethiopia in its south-north movement [3]. For example, the creation of strong low pressure and cyclones in the southern Indian Ocean reduces the amount and distribution of rainfall in Ethiopia [25]. The small rains also contribute to increased pasture for domestic and wild animals. Normal Belg rainfall adds moisture to the soil, enabling land preparation for the Kiremt or summer planting [29]. The short rainy season, the Belg is the result of moist easterly and southeasterly winds and produces rains in March, April, and May [30]. Rainfall mainly comes from June to September when the Inter-tropical Front, the zone of convergence of winds move towards the north of the country [28]. During this time of the year moist winds from the middle part of the Atlantic Ocean, often referred to as Equatorial Westerly, are down towards this area of low atmospheric pressure and providing rain [31]. Thus, most of the western parts and the highlands that are situated on the direct path of the moist winds capture more rainfalls than the rest of the regions [23]. In general, the western side of the region enjoys good and excess amount of rainfall than East, Northeast and Southeast part of the region [25]. The amount of rainfall, and the length of the rainy season, decreases north and northeastwards from the southwestern corner of the region [1,32]. Rainfall fluctuations in the region have had significant short and long-term effects on natural resources systems, particularly agricultures, and rivers.
Data And Methodology
Rainfall, temperature, and sea Surface temperature (SST) data
The temperature and rainfall data were recorded from 15 Meteorological stations placed in the study area for rainy seasons (February-September) during the period 2000-2008 (Table 1 and Figure 3). The mean monthly, seasonal and yearly rainfall, maximum, and minimum temperature were analyzed.
| Stations | Longitude (°E) | Latitude (°S) | Altitude (m) | Rainfall (mm) | Temperature (oC) | ||
|---|---|---|---|---|---|---|---|
| Belg( Feb-May) | Kiremt(Jun-Sep) | Belg( Feb-May) | Kiremt(Jun-Sep) | ||||
| Motta | 37.52 | 11.05 | 2440 | 34.01 | 220.53 | 23.11 | 22.21 |
| Debre Work | 38.08 | 10.44 | 2740 | 38.72 | 187.21 | 9.42 | 22.99 |
| Adet | 37.28 | 11.16 | 2080 | 25.21 | 210.3 | 29.02 | 23.69 |
| Ayehu | 36.55 | 10.45 | 1725 | 54.94 | 211.91 | 31.36 | 24.33 |
| Zege | 37.19 | 11.41 | 1800 | 14.5 | 336.12 | 31.09 | 26.42 |
| Bahar Dar | 37.25 | 11.36 | 1770 | 22.19 | 321.53 | 29.63 | 25.35 |
| Yetemen | 38.08 | 10.2 | 2060 | 37.59 | 255.99 | 26.01 | 22.14 |
| Gundil | 37.04 | 10.57 | 2540 | 61.13 | 473.23 | 24.14 | 19.88 |
| DengayBer | 37.33 | 10.43 | 2800 | 58.55 | 415.72 | 24.44 | 18.92 |
| Deke Istifanos | 37.16 | 11.54 | 1795 | 11.73 | 309.9 | 28.84 | 25.56 |
| Wegedade | 37.13 | 11.18 | 2000 | 39.2 | 213.68 | 29.29 | 26.00 |
| AbaySheleko | 38.41 | 10.21 | 2000 | 54.86 | 238.96 | 29.74 | 27.29 |
| Elias | 37.28 | 10.18 | 2140 | 50.82 | 337.76 | 29.17 | 22.42 |
| Shebelberenta | 38.2 | 10.27 | 2000 | 40.31 | 198.16 | 27.51 | 23.45 |
| Yetnora | 38.09 | 10.12 | 2540 | 38.62 | 215.42 | 24.63 | 19.84 |
Table 1: Geographical coordinates of the meteorological stations and their mean seasonal rainfall and mean maximum temperature.
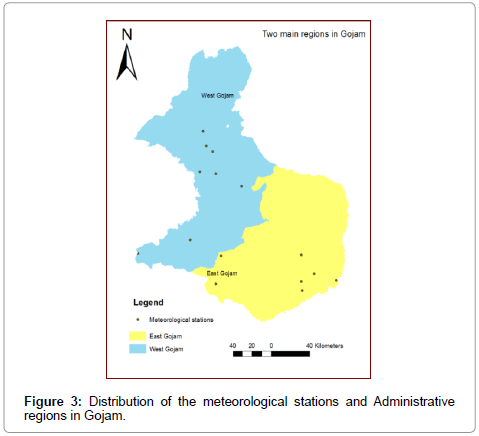
Figure 3: Distribution of the meteorological stations and Administrative regions in Gojam.
Preparation of gridded climate maps were made by interpolation of these records based on the longitude, latitude, and elevation of the weather stations. Different interpolation methods were tried in order to increase the prediction accuracy such as inverse distance weighting (IDW), simple kriging, Universal kriging, and ordinary kriging. Ordinary kriging method was the best for this study and all raster maps of seasonal precipitation for the study region were constructed using the geostatistical interpolation method known as ordinary kriging. OK relies on the spatial correlation structure of the data to determine the weighting values instead of weighting nearby data points by some power of their inverted distance [33]. Ordinary kriging is an effective spatial interpolation and mapping tool, because it honors data locations provides unbiased estimates at unsampled locations, and provides for minimum estimation variance, i.e. a best linear unbiased estimator [34,35]. Monthly mean sea surface temperature (SST) anomalies of NINO3.4, NINO3, and NINO4region were also used from National Oceanic and Atmospheric Administration (NOAA). Since NINO 3.4 has characteristics of both NINO3 and NINO4, most studies consider NINO3.4 SSTA for their study [1,26,28,36] (Figure 4). Therefore, that it was NINO3.4 SSTA that used for this study. To be classified as a full-fledged El Niño and La Niña episode the Oceanic Niño Index (ONI) must exceed +0.5 [El Niño] or -0.5 [La Niña] for at least five consecutive months.
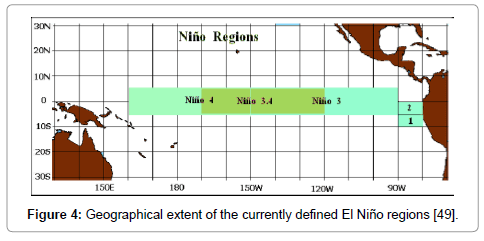
Figure 4: Geographical extent of the currently defined El Niño regions [49].
Satellite data
The multi-temporal images were acquired from the NASA Terra (AM-1) satellite’s Moderate Resolution Imaging Spectroradiometer (MODIS) sensor (Table 2). The MODIS 250 m NDVI product (MOD13Q1) 16-day composites provided the needed vegetation phenology data. The MODIS re-projection tool was used to convert HDf file to Geotif and images were resampled using a nearest neighbor operator from their native sinusoidal projection to geographic projection with datum WGS 84. Depending on the MODIS 250 m NDVI Quality Assessment Science Data Set (QASDS) information and requirement quality assessment also processed. NDVI pixels that fell below the acceptable QASDS quality level were deleted and flagged. The 16-days composite NDVI data sets were generated using a maximum value composite (MVC) procedure, which selects the maximum NDVI value within a 16-day period for every pixel. This procedure is used to reduce noise signal in NDVI data due to clouds or other atmospheric factors. The monthly NDVI raster map and others such as maximum, minimum, and mean NDVI values were extracted by averaging the 16-composite. Negative NDVI values indicate non-vegetated areas such as snow, ice, and water. Positive NDVI values indicate green, vegetated surfaces, and higher values indicate increase in green vegetation. Although the Normalize difference vegetation index (NDVI) value classification is not specific, depending on previous some studies the vegetation condition of the region classified as High vegetation (values above 0.5), medium vegetation (from 0.292 - 0.5), low vegetation (0.166- 0.292), no vegetation (from 0.1 -0.166) and water body [37-39].
| Satellite system | Sensor | Spatial resolution | Temporal resolution | Time-period/ Acquisition date |
|---|---|---|---|---|
| NASA | MODIS Terra |
MOD13Q1, 250mNDVI |
16 day composite |
From 2000-2008 |
Table 2: Satellite data used in the study.
Statistical analysis of vegetation or biomass condition
Quantitative analyses of land degradation were investigated using maximum minus minimum NDVI and coefficient of variation [40] (Table 3). Coefficient of variation represents the ratio of the standard deviation to the mean, and it is a useful statistic for comparing the degree of variation from one data series to another, even if the means are drastically different from each other. The higher the CV, the higher is instability or variability in data, and vice versa. It is used to determine the stability or consistency of a data. The dispersion of NDVI values relative to the mean value over time, which can be: 1 positively increasing, 2) positively decreasing, 3) negatively increasing, 4) negatively decreasing, or 5) constant (Table 3).
| Max-Min NDVI | NDVI CV | Interpretation of biomass variation |
|---|---|---|
| + | + | Increase of biomass but unstable |
| - | + | Decrease of biomass but unstable |
| + | - | Increase of biomass, stable |
| - | - | Decrease of biomass, stable |
Table 3: Combination of NDVI and Cv for biomass detection [40,41].
Results
Spatial and temporal variation of mean monthly NDVI for Belg and Kiremt season
Generally, there is high vegetation coverage in Kiremt season (June, July, August and September) than Belg (February, March, April and May) due to good amount of rainfall in Kiremt season meaning the northward movement of ITCZ for plants or crop to grow (Figure 5). Relating to the altitude there is better vegetation coverage in the central part of the region, around Choke Mountain (the highest plateau of the region) in both seasons. In the other hand, there is less vegetation coverage in the eastern periphery of the region, while better vegetation coverage in the western part of region (Figure 6). Kiremt season high vegetation coverage class ranges from the highest in 2002 (77.14%) and the lowest in 2003 (66.59%) (Tables 4 and 5). Highest Kiremt season medium vegetation coverage class is in 2003 (23.24%), while lowest medium vegetation coverage class and low vegetation coverage is in 2002 (12.74%). In the Belg season, the highest high vegetation coverage class year was 2007 (2.55%) and lowest high vegetation coverage class year was 2004 (0.48%). The highest medium vegetation coverage class year was 2000 (58.15%), while the lowest year was 2003 (26.69%). The highest low vegetation class also in 2003 (61.91%). The result of sea surface temperature anomaly analyses showed that 2000 and 2008 were strong La Niña years, but the National Oceanic and Atmospheric Administration (NOAA) include 2001 and 2007 as La Niña or close to La Niña year as well. In the other hand, 2002 is strong El Niño year and NOAA includes the years 2003, 2004, 2005 and 2006 . So that, there was a decrease in vegetation coverage in 2000 and 2008 particularly, in first two months (February and March) of Belg season due to La Niña episodes and decrease of rainfall amount (Figures 6 and 7). However, the total vegetation coverage of Belg season and La Niña episodes is not decrease because of the rest April and May vegetation coverage and rainfall amount increase (Figures 6 and 8). The highest vegetation coverage is in 2002 due to El Niño episodes. The El Niño episode increases the amount of rainfall in Belg season, while the amount of rainfall decreases in the beginning of Kiremt season. The spatial and temporal distribution of rainfall and vegetation coverage have similar pattern that is, maximum vegetation coverage and rainfall amount in the east and north east part of region, while decreasing of vegetation and rainfall west, south, north west and south west part of region. The 2008 strong La Nina year indicated that there was a decrease in high vegetation coverage particularly, in the start three months of Belg season, excluding May. The dominant class is the low vegetation coverage, which means that the NDVI value ranges from 0.166- 0.292. In connection to this, the La Nina year indicated a decrease in rainfall in the beginning of Belg season (Figures 6 and 7). The Kiremt season particularly, August and September showed a complete high amount of high vegetation coverage class during the strong La Nina year, which means that the NDVI values greater than 0.5. In Kiremt season, all months indicated high and medium vegetation coverage classes, excluding June. In the La Nina year, the dominant class was low vegetation coverage in the starting three months as it was stated above, whereas in the El Niño year there was medium vegetation coverage, the NDVI value ranges from 0.292-0.5 in a larger place in the Belg season (Figures 7 and 9). In the El Niño year, there was also a high vegetation coverage class in the very highlands area such as Choke Mountain, while there was a high vegetation coverage class in the La Nina year during the Belg season starting three months. In the El Niño year, the May high vegetation coverage that was in the La Nina year become very low and there was similar pattern spatial vegetation coverage in the whole four months. The Kiremt season, El Niño year vegetation coverage was the same to that of pattern of La Nina year, which is high vegetation class in the whole months, excluding June. Rainy season such as Kiremt and Belg mean vegetation coverage indicated that the dominated vegetation class was medium vegetation coverage, which means that the NDVI value ranges from 0.292-0.5 in most of the places (Figure 9). There was also the high vegetation coverage class next to the medium vegetation coverage class. The highest vegetation coverage class was mostly dominated in the west, southwest and northwest periphery of the region. The low vegetation class was quit small in the eastern part of the region.
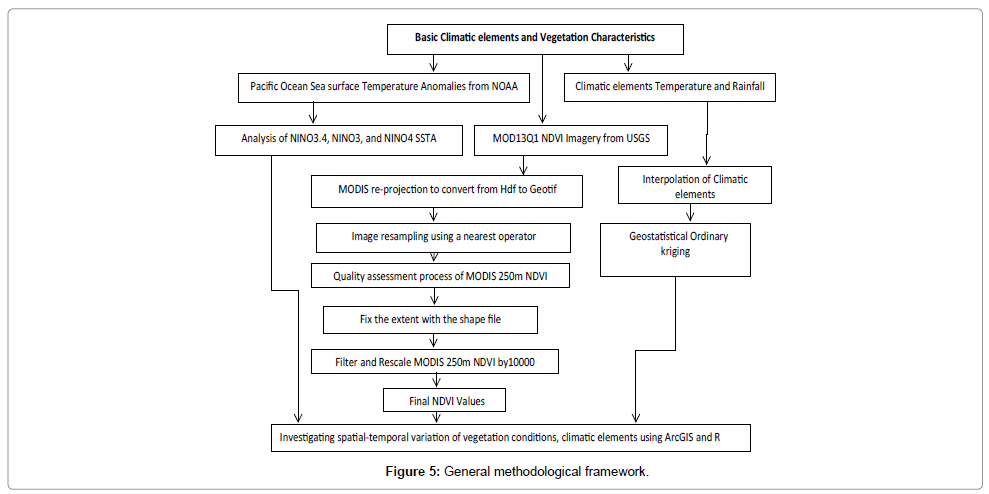
Figure 5: General methodological framework.
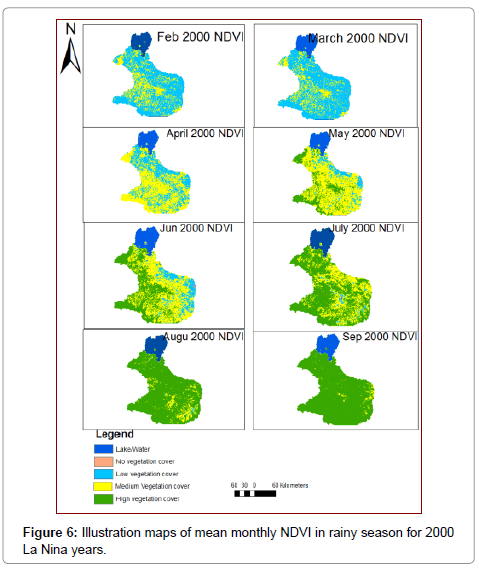
Figure 6: Illustration maps of mean monthly NDVI in rainy season for 2000 La Nina years.
| % of vegetation coverage per year | |||||||||
|---|---|---|---|---|---|---|---|---|---|
| Type of vegetation | 2000 | 2001 | 2002 | 2003 | 2004 | 2005 | 2006 | 2007 | 2008 |
| High Vegetation | 72.66 | 68.83 | 77.14 | 66.59 | 75.90 | 70.10 | 72.02 | 74.59 | 76.61 |
| Medium Vegetation | 17.03 | 20.85 | 12.74 | 23.24 | 13.97 | 19.69 | 17.78 | 15.19 | 13.19 |
| Low vegetation | 0.302 | 0.32 | 0.17 | 0.24 | 0.18 | 0.26 | 0.23 | 0.27 | 0.23 |
| No vegetation | 0.09 | 0.10 | 0.10 | 0.11 | 0.10 | 0.10 | 0.10 | 0.10 | 0.10 |
| Water | 9.92 | 9.89 | 9.83 | 9.83 | 9.85 | 9.85 | 9.86 | 9.86 | 9.85 |
Table 4: Kiremt season quantitative vegetation coverage.
| % of vegetation coverage per year | |||||||||
|---|---|---|---|---|---|---|---|---|---|
| Type of vegetation | 2000 | 2001 | 2002 | 2003 | 2004 | 2005 | 2006 | 2007 | 2008 |
| High Vegetation | 0.77 | 1.76 | 1.58 | 1.09 | 0.48 | 0.92 | 0.85 | 2.55 | 0.90 |
| Medium Vegetation | 58.15 | 58.01 | 36.85 | 26.69 | 30.42 | 38.99 | 47.16 | 50.47 | 50.44 |
| Low vegetation | 30.94 | 30.10 | 51.21 | 61.91 | 58.66 | 49.91 | 41.66 | 36.75 | 38.28 |
| No vegetation | 0.18 | 0.17 | 0.36 | 0.40 | 0.48 | 0.26 | 0.43 | 0.30 | 0.51 |
| Water | 9.96 | 9.97 | 9.99 | 9.91 | 9.96 | 9.92 | 9.90 | 9.92 | 9.87 |
Table 5: Belg season quantitative vegetation coverage.
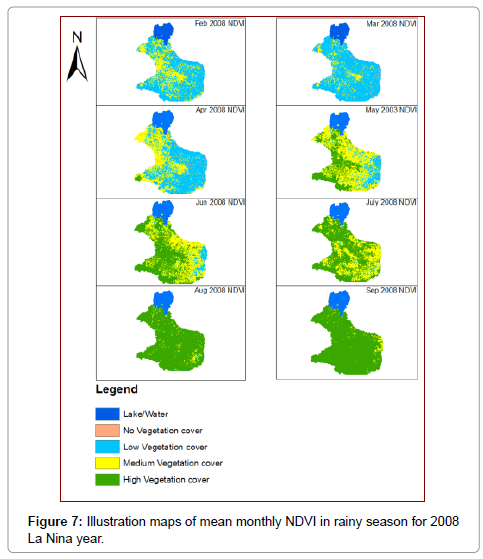
Figure 7: Illustration maps of mean monthly NDVI in rainy season for 2008 La Nina year.
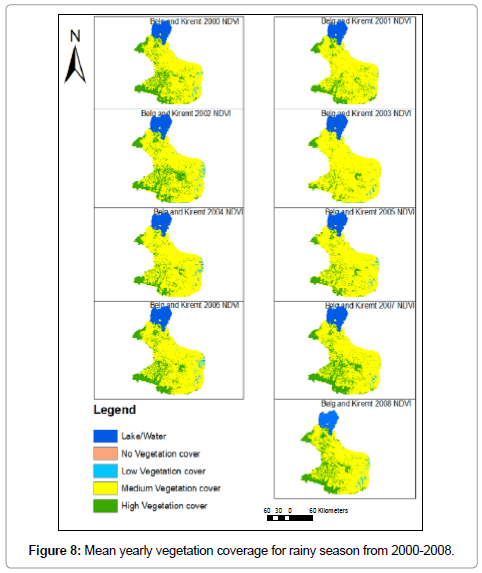
Figure 8: Mean yearly vegetation coverage for rainy season from 2000-2008.
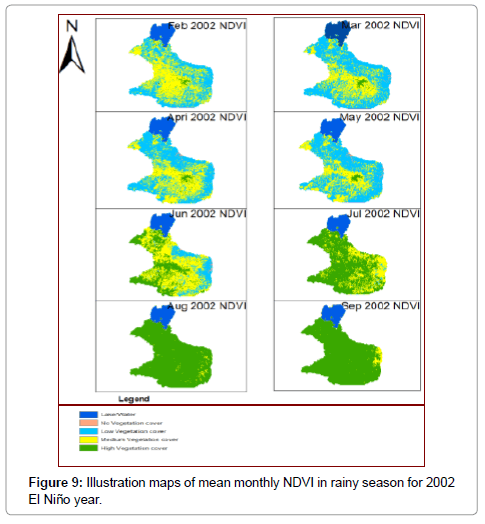
Figure 9: Illustration maps of mean monthly NDVI in rainy season for 2002 El Niño year.
Quantitative analyses of vegetation coverage in Belg and Kiremt season
The Kiremt season quantitative analyses of vegetation coverage indicated that the quantity of high vegetation coverage ranges from 70- 77 percent from 2000-2008. The highest high vegetation coverage was in the year 2002 strong El Niño year, which 77.14%. The Kiremt season, medium and low vegetation coverage classes were also ranges from 12- 23% and 0.12-0.3%, respectively. The Belg season quantitative analyses of vegetation coverage indicated similar pattern to that of the Kiremt season; however, the highest vegetation class was medium vegetation coverage in most of the years that ranges from 26-58% (Tables 4 and 5). The low vegetation coverage was also high in the Belg season in some of the years such as 2003 and 2004.
Spatial and temporal variation of mean seasonal rainfall in Belg and Kiremt
Ordinary kriging was considered to be the best method for spatial rainfall estimation, as it was provided the smallest [41] RMSE and ME value for nearly all years. The distribution of sample data point was uneven and sparse so that the quality of IDW interpolation technique was quit low. Ordinary kriging was selected for this study based on how well it performed on prior years data and because the statistical characteristics of the data in 2002 and 2003 make Ordinary Kriging the appropriate choice of estimator (Table 6). Exponential and stable type of models is used for ordinary Kriging interpolation of seasonal rainfall data. The NDVI value has been high based on the spatial and temporal distribution of rainfall in the region, obviously, whenever there is a good amount of rainfall there has been good vegetation coverage. The rainfall distribution has been high in the southwest part of a region during Belg season relative to other parts of the region, whereas the distribution of rainfall in north has been quite low.
| Method | Error statistic | Belg season | Kiremt season |
|---|---|---|---|
| Simple kriging (SK) | RMSE | 9.30 | 79.42 |
| ME | –1.88 | –2.82 | |
| Universal kriging (UK) | RMSE | 9.82 | 81.56 |
| ME | 0.73 | 3.71 | |
| Ordinary kriging (OK) | RMSE | 8.12 | 45.21 |
| ME | 0.01 | 1.01 | |
| Radial Basis Function (RBF) | RMSE | 17.04 | 65.89 |
| ME | 0.01 | 1.73 | |
| Local Polynomial Interpolator (LPI) | RMSE | 21.01 | 86.03 |
| ME | 1.04 | 5.03 | |
| Global Polynomial Interpolator (GPI) | RMSE | 26.9 | 82.31 |
| ME | 0.12 | 3.66 | |
| Inverse Distance Weighting (IDW) | RMSE | 22.18 | 81.38 |
| ME | 0.67 | 19.61 |
Table 6: Summary of error estimators for prediction of mean seasonal rainfall.
Mean monthly time series analyses of rainfall
The variability of rainfall through time is becoming high and visible in almost the whole years, in both rainy seasons (Figure 10). Statistical time series mean monthly precipitation analysis of Kiremt season (June, July, August and September) indicated that increasing of precipitation about and more than 200mm per month i.e. good for vegetation or plant growth were obtainable almost in the whole years except in the year 2000 and 2007 (Figure 10). Rainfall is the limiting factor for plants to grow in these areas. It governs the crop yields and determines the choice of the crops that can be grown. There was immediate decrease of rainfall from June 300mm per month to 200mm per month and lower in August and September in the year 2002, 2005, and 2007 that leads to the decrease in NDVI. The spatial coverage of mean annual seasonal precipitation increases in the western or southwestern part of region similar to the vegetation coverage; beside to, the variability of rainfall spatially and temporary (Figure 11). Particularly, the Belg rainfall is generally considered highly variable in quantity and distribution. However, some part of the regions receive good amount of rainfall, while the rest get low amount of rainfall. During Belg, in the strong La Nina year such as 2000 and 2008, the starting two months indicated quite low amount of rainfall, while April and May showed high amount of rainfall relative to other years. During Belg, in the strong El Niño year the rainfall amount was low for the whole months.
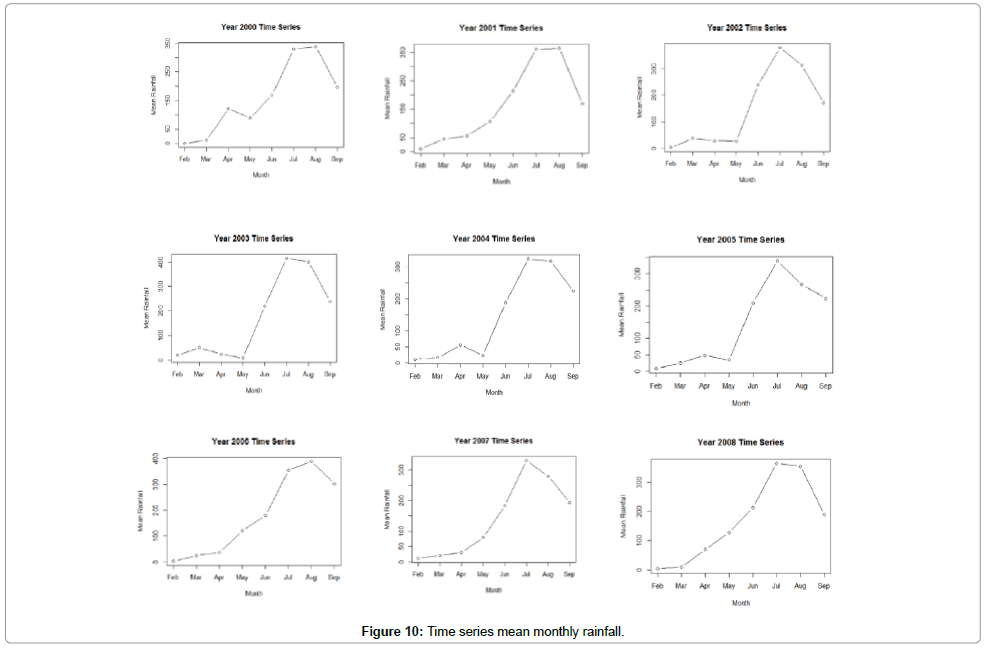
Figure 10: Time series mean monthly rainfall.
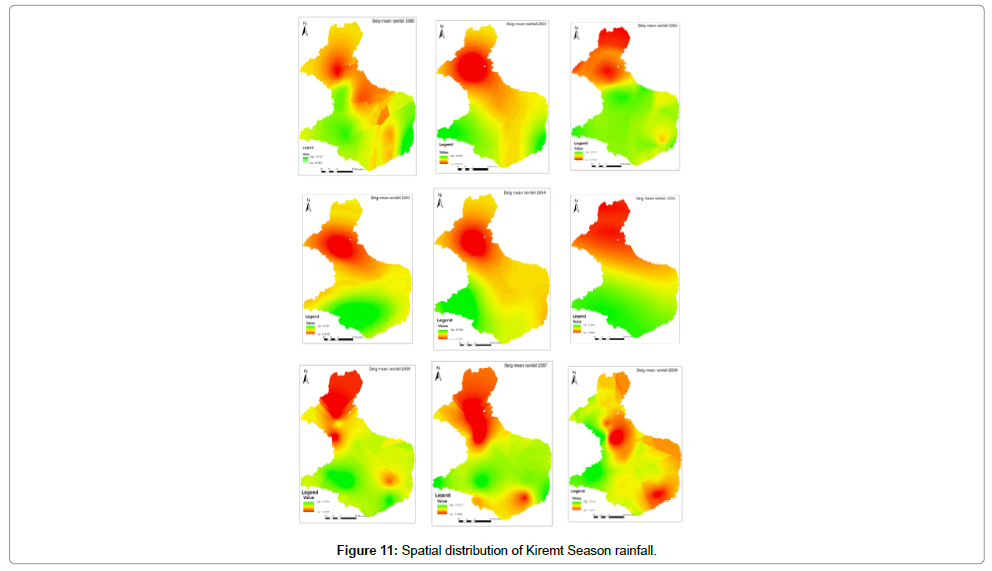
Figure 11: Spatial distribution of Kiremt Season rainfall.
Mean monthly time series analyses of maximum temperature
Unlike the rainfall and vegetation, mean monthly maximum temperature analyses showed that the increase of maximum temperature greater than 26°C in almost the whole Belg season, whereas the decrease of maximum temperature in the Kiremt season particularly in July and August (Figure 12). The immediate decrease of maximum temperature particularly in March or May end of Belg season indicated the starting of main rainy season in almost the whole years (Figure 12). Although the variability of maximum temperature noticeable in both seasons, it is more visible in the Kiremt season than Belg.
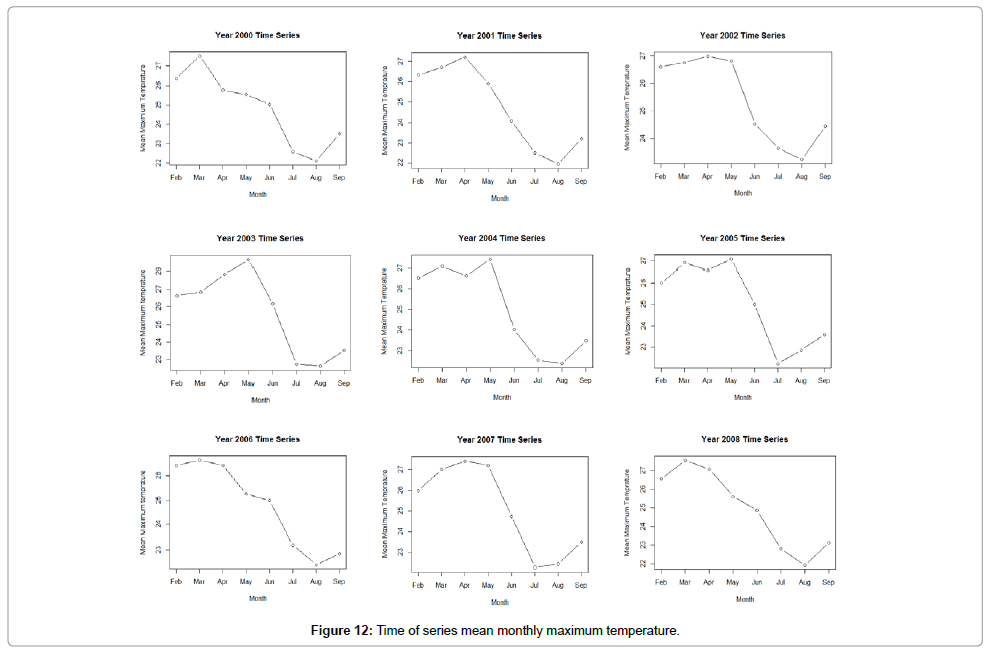
Figure 12: Time of series mean monthly maximum temperature. Figure 13:
Mean monthly time series analyses of NDVI
The small rainy season that is Belg helps to moist the soil and for other preparation for the vegetation i.e. plant ,crop, grassland and others to start growth, so that mean monthly NDVI time series result indicated increase of NDVI value after Belg season (Figure 13). Due to the small rainy season in Belg that create favorable condition for vegetation growth, there was immediate increase of NDVI values starting from June the beginning of Kiremt seasons. Spatial and temporal result of NDVI in the regime showed an increase of vegetation coverage in Kiremt particularly September, whereas the minimum vegetation coverage in Belg particularly in March and February in almost the whole nine years. As result of strong La Niña episode in the year 2000, it showed the more decrease of vegetation coverage in February and March in relation to decrease of rainfall.
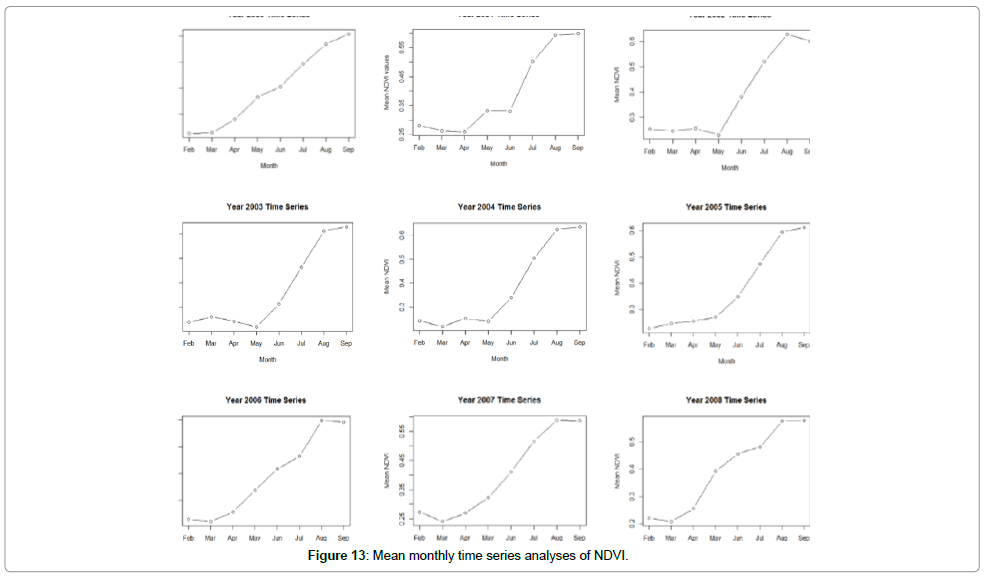
Figure 13: Mean monthly time series analyses of NDVI.
Mean monthly time series analyses of NINO3.4
The Oceanic Nino Index (ONI) is based on sea surface temperature anomalies and is defined as the three-month running-mean SST departures in the Niño 3.4 region, depending on the NOAA ERSST data. El Nino is characterized by ONI>=+0.5°C, while La Nina is based on ONI<= -0.5°C.Fully El Nino episode characterize when five consecutive months of ONI>=+0.5°C, whereas the fully La Nina episode ONI <= -0.5°C. The year 2000 and 2008 indicates fully La Nina episode and the years 2002 El Nino (Figure 14). La Nina episode decrease the amount of rainfall in Belg season and increase the amount of rainfall in Kiremt, while El Nino increase the amount of rainfall in Belg and decrease the amount of rainfall in Kiremt season of the regime.
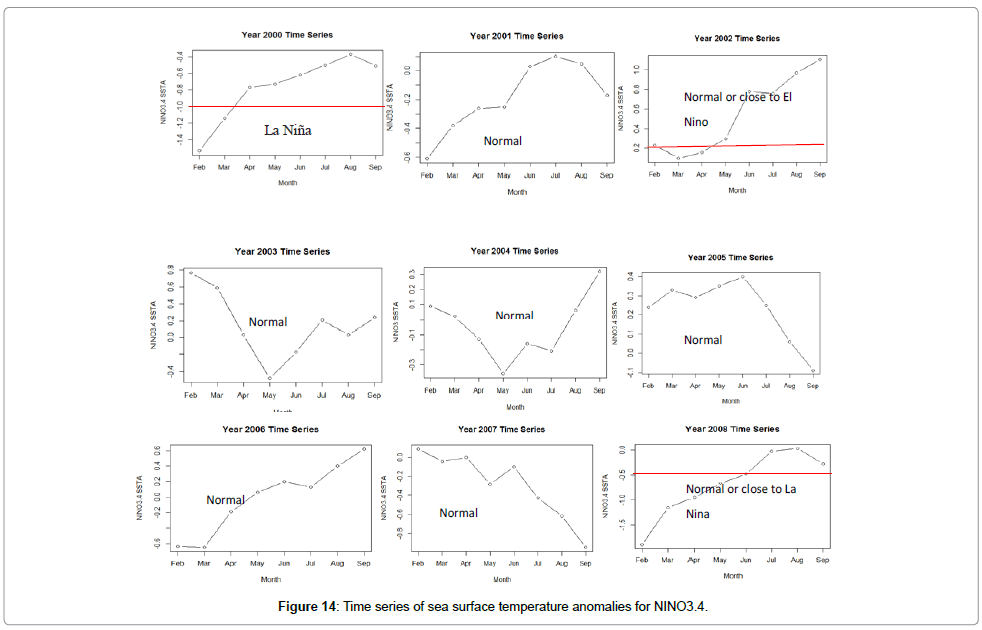
Figure 14: Time series of sea surface temperature anomalies for NINO3.4.
Linear correlation between mean monthly NDVI and mean monthly rainfall
The correlation result indicated a strong linear relationship between NDVI and rainfall in the region, which is 0.79 of R2, P values of 0.002756 and residual standard error of 0.08624 for example in the year 2004. The mean NDVI and rainfall correlation values were almost similar to that of 2004 in the whole years as indicated in Tables 7. The scatter plot and map results indicated that the correlation between precipitation and NDVI is strongly positive and exhibits a clear spatial pattern. Precipitation and temperature directly influence on water balance, causing changes in soil moisture in the regime, which in turn, influences plant growth. The coefficient of variation, R2, indicated that 79 per cent of the variation in vegetation productivity is explained by variation in rainfall in most the years.
| NDVI versus rainfall | ||||||||||||||
|---|---|---|---|---|---|---|---|---|---|---|---|---|---|---|
| YEAR | 2000 | 2001 | 2002 | 2003 | 2004 | 2005 | 2006 | 2007 | 2008 | |||||
| P | 0.008174 | 0.02349 | 0.0111 | 0.01184 | 0.002756 | 0.009184 | 0.0003481 | 0.002517 | 0.006082 | |||||
| Multiple R2 | 0.715 | 0.6027 | 0.686 | 0.6794 | 0.799 | 0.7042 | 0.8977 | 0.8048 | 0.7407 | |||||
| Adjusted R2 | 0.668 | 0.5365 | 0.6336 | 0.626 | 0.7655 | 0.6549 | 0.8807 | 0.7723 | 0.6974 | |||||
| Residual standard error | 0.08607 | 0.09896 | 0.1026 | 0.1052 | 0.08624 | 0.09336 | 0.0531 | 0.0694 | 0.08396 | |||||
| NDVI versus temperature | ||||||||||||||
| YEAR | 2000 | 2001 | 2002 | 2003 | 2004 | 2005 | 2006 | 2007 | 2008 | |||||
| P | 0.001577 | 0.001592 | 0.0007102 | 0.001543 | 0.0021 | 0.00421 | 3.248e-05 | 0.001014 | 0.0003663 | |||||
| Multiple R2 | 0.8323 | 0.8318 | 0.8708 | 0.8335 | 0.816 | 0.7695 | 0.9533 | 0.8548 | 0.896 | |||||
| Adjusted R2 | 0.8043 | 0.8037 | 0.8492 | 0.8057 | 0.7853 | 0.7311 | 0.9455 | 0.8306 | 0.8787 | |||||
| Residual standard error | 0.06602 | 0.06439 | 0.06585 | 0.07585 | 0.08252 | 0.08241 | 0.03589 | 0.05985 | 0.05317 | |||||
| Linear equation for NDVI versus rainfall | Linear equation for NDVI versus temperature | |||||||||||||
| 2000 | NDVI=0.0009802RF + 0.2433817 | 2000 | NDVI= -0.7182T + 2.17838 | |||||||||||
| 2001 | NDVI= 0.0008128RF + 0.2604580 | 2001 | NDVI= -0.06476T + 1.9974 | |||||||||||
| 2002 | NDVI= 0.0009552Rf + 0.2469023 | 2002 | NDVI= -0.1012T + 2.9585 | |||||||||||
| 2003 | NDVI= 0.0008285RF + 0.228489 | 2003 | NDVI= -0.06651T + 2.07510 | |||||||||||
| 2004 | NDVI= 0.001175RF + 0.211507 | 2004 | NDVI= -0.07586T + 2.27937 | |||||||||||
| 2005 | NDVI=0.00103RF + 0.23052 | 2005 | NDVI= -0.07284T + 2.20226 | |||||||||||
| 2006 | NDVI= 0.0009408RF + 0.2234609 | 2006 | NDVI= -0.08631T + 2.52687 | |||||||||||
| 2007 | NDVI= 0.001053RF + 0.252186 | 2007 | NDVI= -0.06297 T + 1.97965 | |||||||||||
| 2008 | NDVI= 0.0009309RF + 0.2408738 | 2008 | NDVI= -0.06816T + 2.09619 | |||||||||||
Table 7: Regression analysis between NDVI, maximum temperature, and rainfall.
Linear correlation between mean monthly NDVI and mean maximum monthly temperature
The scatter plot of maximum temperature and mean NDVI result showed that the mean maximum temperature negatively correlated with vegetation coverage or NDVI values of the area, which is 0.82 value of R2, 0.0021 values of p and residual standard error of 0.08252 in the year 2004. The mean NDVI and mean maximum temperature correlation values were almost similar to that of 2004 in the whole years as indicated in Tables 7. However, sometimes the minimum temperature has slightly positive correlation to NDVI, so that temperature also very important climatic element for vegetation to growth depending on the type of vegetation and climatic zone.
Correlation between Sea surface temperature anomalies and rainfall
The correlation between Pacific Ocean sea surface temperature anomalies and the region rainfall is not direct that means sometimes negative, positive or no correlation at all but most of the time they have positive correlation (Figure 15 and Table 8). In the fully strong ENSO/ El Nino or La Nina episode years like 2000 and 2002 sea surface temperature and rainfall have positive correlation to each other with P and R2 values 0.005316, 0.7516 and 0.01884, 0.629, respectively (Table 8). In the year 2005 they have weak negative correlation to each other, and in the year 2003 they doesn’t have correlation to each other (Figure 15 and Table 8).
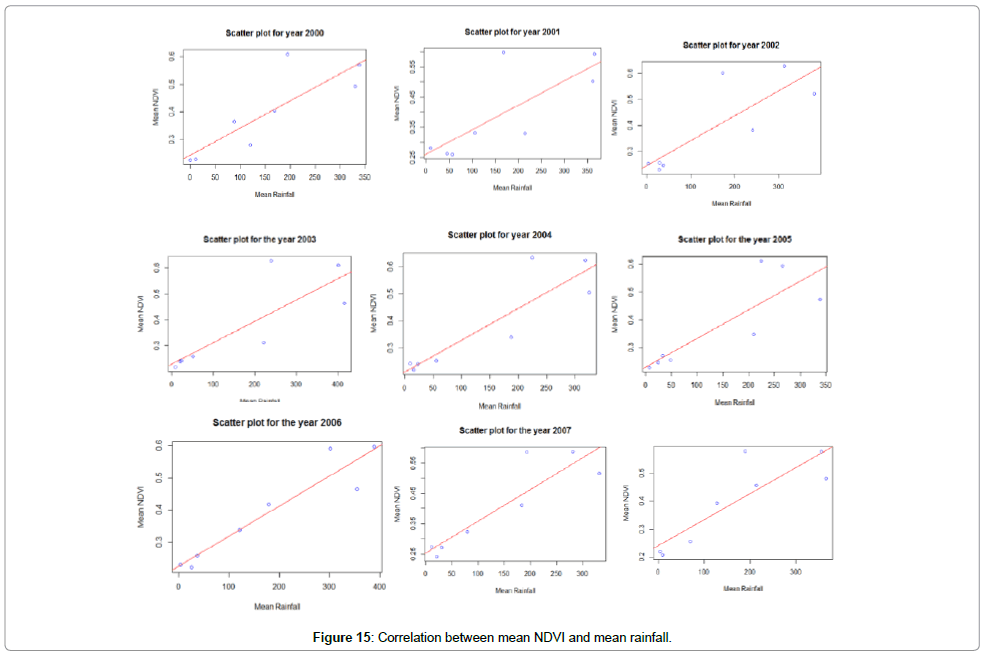
Figure 15: Correlation between mean NDVI and mean rainfall.
| 2000 | 2001 | 2002 | 2003 | 2004 | 2005 | |
|---|---|---|---|---|---|---|
| P | 0.005316 | 0.001542 | 0.01884 | 0.8088 | 0.01914 | 0.2935 |
| Multiple R2 | 0.7516 | 0.8335 | 0.629 | 0.01054 | 0.6272 | 0.1809 |
| Adjusted R2 | 0.7102 | 0.8058 | 0.5672 | -0.1544 | 0.5651 | 0.04436 |
Table 8:Regression analyses between NINO3.4 sea surface temperature anomalies and rainfall either insignificant or very less.
General quantitative statistical analyses of vegetation condition or total biomass
Maximum NDVI indicates maximum green biomass, while minimum indicates minimum green biomass. The different between maximum and minimum NDVI reflects biomass production. The biomass production NDVI max minus NDVI min for Belg season is almost similar for the whole year that is about 0.96 except 0.88 in the year 2006 (Table 9). The biomass production in Kiremt season also similar but somehow more than Belg that is 1.03 almost in the whole years except 0.99 in the year 2001 (Table 9). The Belg and Kiremt season NDVI coefficient of variation indicated high instability or variability. Belg season NDVI coefficient of variation is very highin the year 2000 and 2002. Kiremt season NDVI coefficient of variationshowed high instability or variability in the year 2002, 2003, 2004, 2005 and stable in the year 2000, 2001, 2007 and 2008. Generally, two annual growing season (Belg and Kiremt) biomass production during the nine years indicated that NDVI max minus NDVI min was increasing, while the NDVI coefficient of variation unstable or highly variable (Table 9 and Figures 15-17).
| Years | Belg Season | Kiremt season | Interpretation of biomass variation | ||
|---|---|---|---|---|---|
| Max-Min NDVI | NDVI CoV | Max-Min NDVI | NDVI CoV | ||
| 2000 | 0.977 | 0.540363636 | 1.0003 | 0.396415494 | Increase + unstable |
| 2001 | 0.9112 | 0.473980309 | 0.9963 | 0.394742044 | Increase + unstable |
| 2002 | 0.959 | 0.615042459 | 1.0365 | 0.417493913 | Increase + unstable |
| 2003 | 0.9016 | 0.527021366 | 1.0001 | 0.402264601 | Increase + unstable |
| 2004 | 0.9326 | 0.544844929 | 1.0398 | 0.387440533 | Increase + unstable |
| 2005 | 0.9629 | 0.552232855 | 1.021 | 0.40295858 | Increase + unstable |
| 2006 | 0.8819 | 0.520306513 | 1.0354 | 0.424324324 | Increase + unstable |
| 2007 | 0.9329 | 0.5274765 | 1.0286 | 0.400647126 | Increase + unstable |
| 2008 | 0.9406 | 0.539033457 | 1.0255 | 0.402254921 | Increase + unstable |
Table 9: General quantitative vegetation condition.
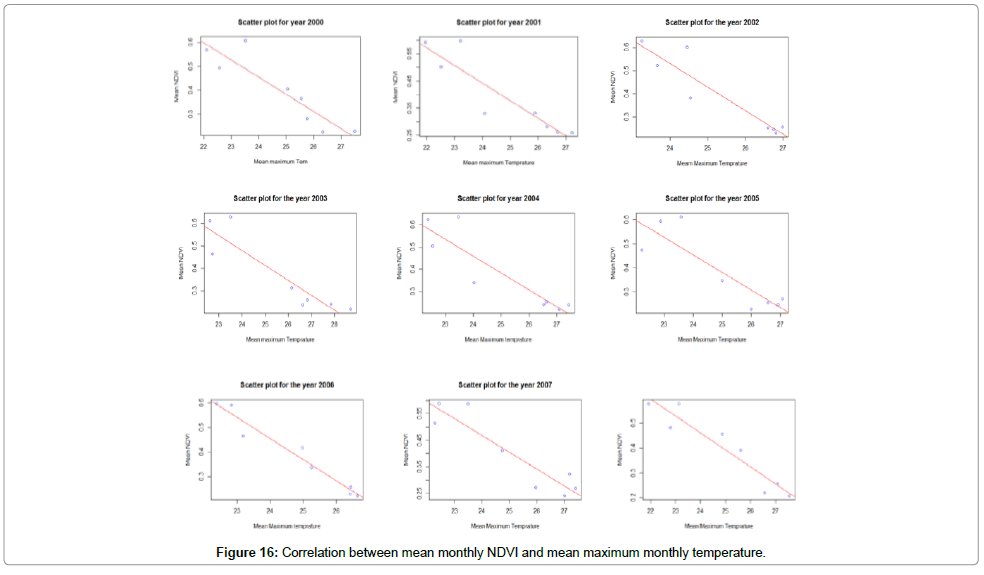
Figure 16: Correlation between mean monthly NDVI and mean maximum monthly temperature.
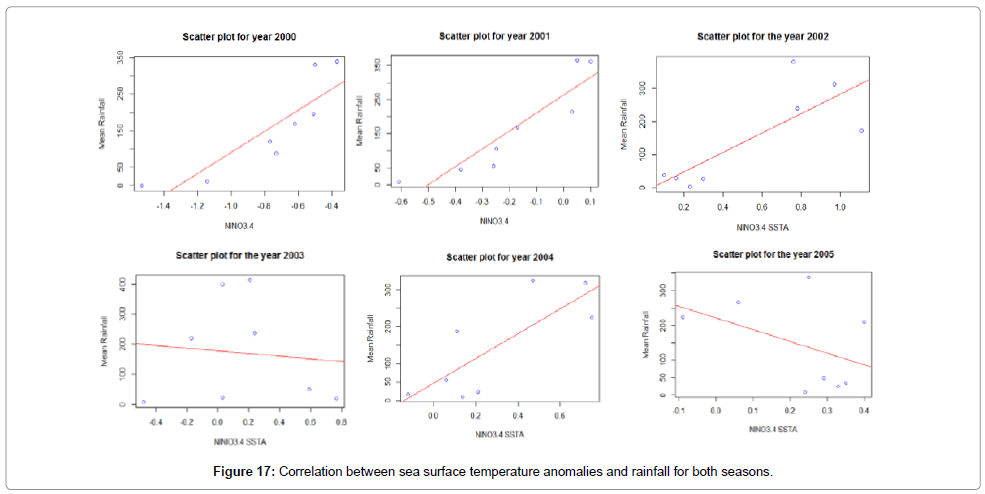
Figure 17: Correlation between sea surface temperature anomalies and rainfall for both seasons.
The correlation coefficient between rainfall and NDVI for different type of land use cover such as deciduous forest , shrub land and cropland is very much less or insignificant that is R2=0.4484, R2=0.5242 than the correlation coefficient between rainfall and NDVI in the total study area land use cover type is like R2=0.7, R2=0.8 (Table 7). The NDVI values of Shrub land and deciduous forest is greater than the NDVI values of cropland and grassland. The direct correlation between NDVI and NINO3.4 Sea surface anomalies has been very variable, in most of the years there have been strong positive correlation coefficient such as 0.722, 0.8868, 0.9082, 0.8645 and 0.7861 in the year 2000, 2002, 2004, 2006 and 2008, respectively. In the other hand, the correlation between NDVI and NINO3.4 sea surface anomalies has been strongly negative such as 0.667 and 0.8039 for the year 2005 and 2007, respectively, and the correlation in the year 2001 and 2003 is either insignificant or very less.
Discussions
The negative effect of El Niño event in Ethiopian Kiremt rainfall meaning decreasing of rainfall has been stated by many previous studies and that seems to be in line with this study that have been done in Gojjam region, whereas, La Nina indicated the opposite [1-3,26]. Hence, the impact of ENSO on Ethiopian, Gojjam rainfall variability is unquestionable. Similar to this study with the same MODIS imagery analysis over Choke Mountain, there have been high NDVI values in September and low NDVI from March to April [42]. The Vegetation coverage in the area has been highly dependent on the seasonal rainfall based on ITCZ that is highly vulnerable to ENSO. There was also a similar statement that the NDVI time-series class characteristics follows the rainfall trend in the region; vegetation begins to gain vigor in beginning of September and remains at high vigor until November while the rainfall reaches maximum during July and August. In line to this study that indicated high climate variability, it was stated that since 1972, the climate variability and associated drought has been becoming high [43-45].The rainfall has not been coming on time since 1972. Climate variability is persistent in the region and continues to affect vegetation condition and consequently crop production. Based on Yohanis, 2012, the NDVI value was highly dependent on the seasonal rainfall and low NDVI value was indicator of drought in the region [46]. According to Mirko, 2010, the main reason for interannual variations of rainfall and the NDVI series is the Pacific ElNiño/Southern Oscillation event, which reaches Ethiopia with a time lag of a few months. Similar to this study dominant effects are rainfall shortages resulting in local droughts of varying intensity [47]. The NDVI values are correlated with rainfall; hence, vegetation is also dependent of ENSO. The study stated that the south and southwest part of the regions represent the highest mean NDVI value and the lowest temporal variation. This area is characterized by shrub land and woodland vegetation. On the other hand, the eastern, northeastern, and northwestern parts represent the lowest mean NDVI and the highest temporal variation because of the relatively low annual precipitation and the more extended dry periods [48,49].
Conclusions
The relationship between precipitation and NDVI is very strong and predictable when observed at the appropriate spatial and temporal scale. The phenology of vegetation in all formations closely reflects the seasonal cycle of rainfall. Within the period 2000–2008 there is considerable monthly, seasonal or year-to-year variation in precipitation and NDVI throughout the region of Gojjam. The yearly correlation coefficients between NDVI and precipitation are very high, while the correlation between NDVI and temperature are low. The total growing season analyses showed that the general temporal or spatial distribution of NDVI in the whole study area corresponds directly with the spatial pattern of average monthly or annual precipitation. Belg season NDVI coefficient of variation analyses showed high instability or variability in both fully strong El Nino or La Nina episodes in 2000 and 2002, but the Kiremt season NDVI coefficient of variation is more highly variable in the whole years. Gojjam is a region in the tropics or in monsoon region, so that tropical Pacific Ocean circulation effect, that is ENSO/ El Nino or La Nina episodes, has a great impact in the seasonal rainfall variability. The ENSO result showed one clear and full El Nino episode in 2002, which showed total increase of spatial vegetation coverage as compares to La Nina years of 2000 and 2008. ENSO warm phase events (El Nino) were associated with high NDVI values, due to an increase of precipitation in Belg season. Regarding maximum temperature and NDVI the result shows strong negative correlation between each other. Nevertheless, the immediate decrease of maximum temperature, particularly in March or May, indicates that the starting of main rainy season, Kiremt rainfall, and increasing of vegetation growth in almost the whole years. Spatiotemporal analyses of NDVI indicated lowest maximum, minimum and mean vegetation coverage in February and March in almost all the years or months, while July and August showed the highest maximum, minimum and mean NDVI values. The strong El Nino episode in the year 2002 showed an earlier starting of rainfall in March, while during La Nina episode period in the year 2000 and 2008 rainfall started later in April. February mean rainfall is becoming almost zero in the whole nine years. The Kiremt season El Nino episode showed earlier decrease of rainfall as we compare it to La Nina episode. Generally, year 2003 indicated increasing or good amount of rainfall in both seasons, while 2005 and 2007 showed decreasing amount of rainfall in both seasons. February monthly vegetation coverage analyses showed that 2001, 2002, and 2007 have better medium vegetation coverage in the eastern and central part of the region than other years. March vegetation coverage analyses also indicated well (but less than February) medium vegetation coverage in those areas and more vegetation coverage in the central part in the years 2001, 2002, 2003 and 2007. April monthly vegetation coverage showed better medium vegetation coverage in the years 2000, 2002, and 2007 than February and March. May monthly vegetation coverage showed more medium and high vegetation coverage in the year 2000, 2001, 2006, 2007 and 2008 as compared to February, March and April. All Kiremt months (June, July, August, and September) have shown better high and medium vegetation coverage except some parts of the region in the west peripheries. It seems that there is a possibility to predict rainfall in Gojam if the SSTAs and El- Nino events could be forecasted in good time ahead. So that it would be very important for farmers and other agricultural sector as they prepare themselves depending on the seasonal rainfall forecasts. The Belg rains are used for land preparation for the main rainy season Kiremt and some crop products such as potato, sorghum and others used to sow if the Belg rain comes earlier. Untimely Belg rainfall means poor land preparation for the main rainy season that leads to increased unwanted infestations of certain pests and reduction of crop production. The total temporal and spatial analyses of climatic elements and vegetation characteristics of the region indicated instability or variability of both climatic elements and vegetation coverage during the study period from 2000-2008. Long year data analyses of climatic elements and vegetation coverage including the whole three seasons (Belg, Kiremt, and Dry) would be important to understand the variability. The detail observation of the vegetation map clearly shows spatial and temporal variability of greenness due to rainfall variability of region. El Nino or La Nina episodes has great influence in the seasonal rainfall of the region which may weaken, increase or dislocate the seasonal rainfall spatially or temporally. Generally, El Nino warm phase of ENSO showed the increase of vegetation coverage in the region due to earlier starting of rainfall during the El Nino episode. La Nina, the cold phase of ENSO, showed decrease of vegetation coverage in the region due to the late starting of rainfall in the region. The monthly trend analyses of NDVI and rainfall showed that how those two variables are highly variable from year to year during the analyzed nine years.
Acknowledgement
The authors gratefully appreciate to Ethiopian Ministry of Water and Energy (MoWE), and Ethiopian National Meteorology Service Agency (NMSA) for providing hydro meteorological and GIS data.
References
- Korecha D, Barnston A (2007) Predictability of June–September Rainfall in Ethiopia. Am Meteorol Soc 135: 628-650.
- Bekele F (1997) Ethiopian Use of ENSO Information in Its Seasonal Forecasts. Internet J African Stud.
- Wolde-Georgis T, Aweke D, Hagos Y (2000)Reducing the Impacts of Environmental Emergencies through Early Warning and Preparedness: The Case of the 1997-98 El Niño.The Case of Ethiopia. July 10.
- Shiferaw A(2011) Evaluating the land use and land cover dynamics in Borena Woreda of South Wollo highlands, Ethiopia. J Sustainable Development in Africa 13: 87-107.
- Conway D, Allison E, Felstead R,Goulden M (2005) Rainfall variability in East Africa: implications for natural resources management and livelihoods. Philosophical Transactions: Math Physical Eng Sci 363: 49-54.
- Getinet F (2010) Comparative Analysis of Climate Variability and Impacts in Central Rift Valley and Adjacent Arsi Highlands Using GIS and Remote Sensing. M.sc thesis, Addis Ababa University, Addis Ababa, Ethiopia.
- UNFCCC (2010) Climate Change: Impacts, Vulnerabilities and Adaptation in Developing Countries.United Nations Framework Convention on Climate Change (UNFCCC), Climate Change Secretariat pp: 68.
- Yang JS, Wang YQ, August PV (2011) Estimation of Land Surface Temperature Using Spatial Interpolation and Satellite-Derived Surface Emissivity. J Environ Informatics 4: 40-47.
- Chamaillé-Jammes S, Fritz H (2009) Precipitation-NDVI relationships in eastern and southern African savannas vary along a precipitation gradient. Int J Remote Sensing 30: 3409-3422.
- Nicholson SE, Davenport ML, Malo AR (1990) The comparsion of the vegetation response to rainfall in the Sahel and East Africa, using normalized difference vegetation index from NOAA AVHRR. Climatic Change 17: 209-241.
- Zhong L, Ma Y, Salama Mhd, Su Z (2010) Assessment of vegetation dynamics and their response to variations in precipitation and temperature in the Tibetan Plateau. Climatic change 103: 519-535.
- Kandji ST, Verchot L, Mackensen J (2006) Climate Change Climate and Variability in Southern Africa: Impacts and Adaptation in the Agricultural Sector. Word Agroforestry Centre (ICRAF), United Nations Environment Programme (UNEP), Nairobi, Kenya, pp. 42.
- Funk C, Brown M (2006) Intra-seasonal NDVI change projections in semi-arid Africa. Remote Sensing of Environment 101: 249-256.
- Statistical Agency (2007) The Federal Democratic Republic of Ethiopia - Amhara. Source data: NationalStatistical Agency (Ethiopia), GeoHive website.
- Lakew D, Menale K, Benin S, Pender J (2000) Land degradation in the highlands of Amhara Region and strategies for sustainable land management. In Policies for Sustainable Land Management in the Highlands of Ethiopia, EPTD Workshop Summary Paper No. 9. In: Jabbar MA, Pender J, Ehui S (eds). EPTD, IFPRI: Washington, DC; pp. 17-22.
- Ayalew D, Kindie T, Girma M, Birru Y, Wondimu B (2012) Variability of rainfall and its current trend in Amhara region, Ethiopia. African J Agri Res 7: 1475-1486.
- Zeleke GH (2001) Implications of land use and land cover dynamics for mountain resource degradation in the Northwestern Ethiopian highlands. Mountain Research and Development 21: 184-191.
- Tegene B (2002) Land-cover/land-use changes in the Derekolli catchment of the South Welo zone of Amhara region, Ethiopia. Eastern Africa Social Science Research Review 18: 1-20.
- FAO (1995) FAO/WFP Crop and food supply assessment mission to Ethiopia. Special Report, Economic and Social Development Department.
- Bewket W, Alemu D, Ayalewu D (2009) Rainfall variability and crop production in Ethiopia Case study in the Amhara region. 16th International Conference of Ethiopian Studies. Trondheim.
- Teshome (2011) Amhara national region state Bureau of Finance and Economic Development.
- Seleshi Y, Zanke U (2004) Recent changes in rainfall and rainy days in Ethiopia. Int J Climatol 24: 973-983.
- NMSA (1996) Climatic and agro climatic resources of Ethiopia. National Meteorological Services Agency of Ethiopia, Meteorological Research Report Series. 1: 1-137.
- Babu A (2009) The impact of Pacific sea surface temperature on the Ethiopian rainfall. Workshop on High-Impact Weather Predictability Information System for Africa and AMMA-THORPEX Forecasters. Trieste, Italy: National Meteorological Agency.
- Gissila T, Black E, Grimes DIF,Slingo JM (2004) Seasonal forecasting of the Ethiopian summer rains. Int J Climatol 24: 1345-1358.
- Tadesse T (1994) The influence of the Arabian Sea storms/depressions over the Ethiopian weather. Proc. Int. Conf. on Monsoon Variability and Prediction, WCRP-84 and WMOTech. Doc. 619, Geneva, Switzerland, World Meteorological Organization 228-236.
- NMSA (1990)Seasonal Weather Outlook of Kiremt. NMSA mimeograph.Addis Ababa, Ethiopia: NMSA.
- Sileshi Y, Demarée GR (1995) Rainfall variability in the Ethiopian and Eritrean highlands and its links with the Southern Oscillation Index. J Biogeogr 22: 945-952.
- Kassahun B (1987) Weather systems over Ethiopia. Proc. First Tech. Conf. on Meteorological Research in Eastern and Southern Africa, Nairobi, Kenya, UCAR, 53-57.
- NMSA, (National Meteorological Services Agency) (1987) The Impact of El Niño on Ethiopian Weather.Report.Addis Ababa.
- Goovaerts P (2000) Geostatistical approaches for incorporating elevation into the spatial interpolation of rainfall. J Hydrol 228: 113-129.
- Jantakat Y, Ongsomwang S (2011) Assessing the effect of incorporating topographical data with geostatistical interpolation for monthly rainfall and temperature in Ping Basin, Thailand. Suranaree JSci Technol 18: 123-139.
- Goovaerts P (1997) Geostatistical approaches for incorporating elevation into the spatial interpolation of rainfall. J Hydrol 228: 113-129.
- Zaroug M (2010) The connections of Pacific SST and drought over East Africa.DEWFORA meeting at ECMWF, Improved Drought Early Warning and FORecasting to strengthen preparedness and adaptation to droughts in Africa (DEWFORA), United Kingdom.
- USAID (2006) Agro-Climatic Monitoring. Famine Early Warning Systems Network (FEWS NET).
- USGS, (2011) NDVI, the Foundation for Remote Sensing Phenology. Remote Sensing Phenology,U.S. Geological Survey.
- USGS & USAID (2005) Normalized Difference Vegetation Index. Famine Early Warning Systems Network (FEWS NET).
- Bai ZG, Dent DL, Schaepman ME (2005) Quantitative global assessment of land degradation and improvement: Pilot study in North China. ISRIC Report 2005/06, Wageningen: ISRIC - International Soil Reference and Information Centre.
- Tucker CJ, Anyamba A, Gonzales P (2005) Monitoring of land degradation and desertification dynamics using coarse-scale satellite data. In: Remote sensing and geoinformation processing in the assessment and monitoring of land degradation and desertification, Trier, Germany, pp. 120-127.
- Teferi E, Uhlenbrook S, Bewket W, Wenninger J, Simane B (2010)The use of remote sensing to quantify wetland loss in the Choke Mountain range, Upper Blue Nile basin, Ethiopia.Hydrol Earth Syst Sci 14: 2415-2428.
- Yeshanew A, Apparao G (1989) Annual rainfall potential and its variability in drought years over Ethiopia.Conf.on Climateand Water, Helsinki, Finland, Academy of Finland 219-235.
- Wodajo T (1984) Agrometeorological activities in Ethiopia Prospects for improving agroclimatic/crop condition assessment Final Rep.
- Felix NK (1997) Global Drought Watch from Space National Oceanic and Atmospheric Administration/National Environmental Satellite Data and Information Service, Camp Springs, Maryland.
- Yohanis T (2012) Evapotranspiration using geontcast in-situ data streams for drought monitoring and early warning. M.sc thesis, ITC, netherlands.
- Mirko G,Brigitta S, Gerd F (2010) Spatiotemporal Variability of Land Use and Land Cover in the Abaya-Chamo-Basin, Southern Ethiopia since 1981.
- Teferi EUS, Bewket W (2015) Inter-annual and seasonal trends of vegetation condition in the Upper Blue Nile (Abay) Basin dual-scale timeseriesanalysis.Hydrol. Earth Syst Sci 14: 2415-2428.
Citation: Getahun YS, Shefine BG (2015) Analysis of Climate Variability (ENSO) and Vegetation Dynamics in Gojjam, Ethiopia. J Earth Sci Clim Change. 6: 320. DOI: 10.4172/2157-7617.1000320
Copyright: © 2015 Getahun YS, et al. This is an open-access article distributed under the terms of the Creative Commons Attribution License, which permits unrestricted use, distribution, and reproduction in any medium, provided the original author and source are credited.
Select your language of interest to view the total content in your interested language
Share This Article
Recommended Journals
Open Access Journals
Article Tools
Article Usage
- Total views: 15208
- [From(publication date): 12-2015 - Jul 12, 2025]
- Breakdown by view type
- HTML page views: 13626
- PDF downloads: 1582