Analysis of Meteorological Drought in North Eastern Province of Kenya
Received: 16-Jun-2014 / Accepted Date: 08-Sep-2017 / Published Date: 18-Sep-2014 DOI: 10.4172/2157-7617.1000219
Abstract
This study analyses seasonal drought characteristic for the period spanning from 1960 to 2008 for North Eastern region. The component of drought investigated in this study includes severity, duration, Frequency, persistence and probability of occurrence. The Standardized Precipitation Index (SPI) of run 3 for March-April-May (MAM) season and October-November-December (OND) season have been calculated and used to quantify the precipitation deficit. Frequencies of various drought categories were calculated and used to determine the probability of occurrence and persistence of various drought episodes. Time series analysis for the parameters was done to determine the trend and periodicity of drought characteristic while frequency analysis was done to determine the number of occurrence of extreme events. In order to determine whether some of the observed drought patterns were periodic, spectral analysis of observed drought pattern was investigated using Single Fourier spectral analysis. Due to analysis of the two rainy season, SPI analysis done returned only two types of drought namely the mild drought with values ranging between -0.01 to – 0.99 and moderately dry condition with SPI values ranging from -1.0 to -1.49. There is high probability of mild drought in both seasons in all stations that were studied with Wajir recording the highest probability. Droughts of varying intensity were observed to last for several seasons and individual drought category had low probability for higher runs. The result from spectral analysis indicates existence of quasi-periodic oscillation with the following cycles dominant 2-3 yrs, 4.5-6.5 yrs and 8-12 yrs.
Keywords: Drought; Standard Precipitation Index (SPI); March-April-May (MAM); October-November-December (OND)
6407Introduction
The causes of Kenya’s year to year rainfall variability are complex and linked to both local and large scale factors. Its unpredictability causes substantial problems for poor subsistence farmers because crops are lost during unusually dry or wet seasons [1]. Causes of insufficient rainfall near the equator have been explained by Anyamba [2]. Dryness commonly experienced around this region is mainly related to the divergent character of North East and South East monsoon as well as their shallow depth. The total rainfall here varies from one year to another but variability tends to be large in regions with lower annual mean of rainfall such as the area under study [3]. Anomaly in the rainfall received is influenced by fluctuation of the rainfall generating factors such as monsoons, Inter-Tropical Convergence Zone (ITCZ), subtropical anticyclones, African jet streams, and easterly/westerly wave perturbations. Teleconnections with global scale systems like the El Niño/Southern Oscillation (ENSO) and regional systems also plays significant role in the processes. This factors influencing rainfall in the area of study and in East Africa in general have been studied by many authors including Alusa and Mushi [4], Nieuwolt [3] and Ogallo [5].
As a general rule, different regions assume a certain level of water shortage based on the long-term climatic conditions experienced by it. Therefore, any deviation from these levels creates either a conditions of drought or flood, depending on the intensity and duration of these deficits or surplus. Thus drought conditions vary among regions of differing climates should therefore be studied within a regional context [6].
From analysis of the observed climate data, there is an indication that recent changes in regional temperature as a result of global warming has had impacts on hydrological cycle as well as changes in the variability of climate, particularly in the frequency and intensity of some extreme climate parameter [7]. This is attributed to an increase in available energy for evaporation due to warmer temperature which in turn alters infiltration rates and soil moisture content consequently altering precipitation amount and magnitude of runoff thus leading to droughts condition. Study of drought in East Africa and the region of interest have been carried out by many authors including Nieuwolt [3], Ogallo and Nassib [5]. These studies indicated that severe drought had occurred at the beginning of last the century, 1950’s, early 1970’s and early 1980’s. Ogallo and Nassib [5] noted that the worse of these droughts was that of 1949 in which most of the East African region was affected, they also observed that most of East Africa will only be drought free in 21 years out of 100 years.
Most of North Eastern Province of Kenya lies in arid or semiarid condition making it more vulnerable to climate sensitivity. The communities in the province are mainly pastoralist and as a result of their frequent mobility the entrenchment of land management policies, service delivery and support to cope with weather related disaster tends to be difficult. Consequently, the region has experienced a weak coping mechanism towards droughts and related water stress thus further aggravating their vulnerability to projected climate change. The region has experienced constant armed conflicts for pasture and water among clans because during prolonged drought seasons, the traditional coping strategies may no longer be sufficient [8,9]. While short term emergency relief aid has been the primary response to mitigate drought impacts, there should be non-food interventions to reduce vulnerability to meteorological disaster such as drought.
Study area
The North eastern province lies between latitude 40 16’N and 00 29’S and between Longitude 390 38’E and 400 6’E (Figure 1). The 4 stations under studies are part of the twelve homogenous rainfall zones in Kenya and therefore a good representation of our area of study since regions in one zone were found to receive rainfall of the same magnitude and had the temporal characteristics [5]. Most of the area in this study is either arid or semi-arid rangeland with little if any agricultural activity being practiced.
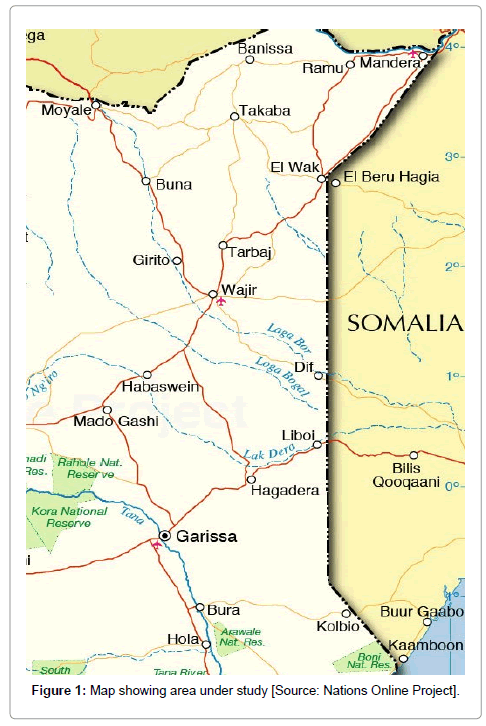
Figure 1: Map showing area under study [Source: Nations Online Project].
Data and Methodology
Data
The dataset used in this study were the monthly total precipitations over the 4 synoptic stations spread in North Eastern province obtained from Kenya Meteorological Department, Headquarters in Nairobi spanning from 1960 through to 2008. Statistical based approach was used to study various droughts characteristic. Firstly, the data was subjected to data quality control to estimate missing data and ensure homogeneity.
Standardized Precipitation Index
The temporal analysis of drought was analysed using SPI. The method is simple and straightforward since precipitation is the only meteorological variable used. Standardized precipitation series is calculated using the arithmetic average and the standard deviation of precipitation series [10,11]. For a given X1, X2, Xn series standardized precipitation series, SPI is calculated from the following equation:
 (1)
(1)
Where, Xij is the seasonal precipitation at the ith rain-gauge station and jth observation, Xim is its long-term seasonal mean and σ is its standard deviation.
Negative values obtained from this equation indicate precipitation deficits (drought events), while positive values stand for precipitation excesses (wet events).
Frequency and probability of drought occurrence
If FLi is the frequency of the drought of category L for the month I, the corresponding probability P’ (L, i) may be estimated by
 (2)
(2)
Where N is the total number of observation
For each drought category a drought of duration of m months (run length m) is defined as the sequence of m months of that drought category preceded and followed by a different category
Let FLM be the frequency of the L drought category with m runs. If mm is the maximum run length of category L, then the frequency FL of at least one month of category L is expressed as
 (3)
(3)
The expression for frequency  of at l
  east M1 runs of category L is of form
 (4)
(4)
Where 1 ≤ m1 ≤ mm
Of interest is the occurrence of a sequence of droughts without reference to a particular category. The frequency Fdm will refer to the frequency of a run of m months of drought.
The frequency of at least one month of drought if Fd is given as
 (5)
(5)
The frequency Fdm1 of at least m1 months of drought is
 (6)
(6)
Frequency gives useful information about how frequent drought of various lengths occurs.
Persistence
Drought effects becomes more severe when it extends over several months or even season thus the question of whether a drought will follow another is of great importance. Using month below average and month above average, there exist a logarithmic relationship between frequency Fm and the run length m of dry and wet month. The relationship is of the form
 (7)
(7)
Where T = period of observation in months
q = probability of wet month
P = probability of dry month
A similar expression for frequency of at least m consecutive months of drought Fm is given by
 (8)
(8)
The probability of occurrence of m consecutive dry months ?m is
 (9)
(9)
And probability of at least m consecutive dry months ?m is expressed as
 (10)
(10)
q =1− P
Values of Фm indicate probability of obtaining at least m consecutive drought months and hence describe the degree of persistence.
Persistence ratio rp is of the form
 (11)
(11)
Where P (L) = probability of occurrence of given category
P’ (L) = probability that a drought occurs immediately after another one of the category
Thus we have
rp>0= Persistence of drought
rp=0= Alternation of drought and no drought
rp
Periodicity
This refers to the repetitive oscillations about a trend line/ curve. Periodicity analysis was done for the drought determine their recurrence. The formula is given by:
 (12)
(12)
 (13)
(13)
Where ω is the frequency  is the lag correlation r is the lag, f(ω) is the spectral density function
ρ(r) is the autocorrelation
Result and Discussions
The rainfall characteristic was analyzed to examine the behavior of long-term annual rainfall distribution in the stations under study. The rainfall received in all stations was bi-modal in pattern commonly referred to as ‘short rain’ and ‘long rain’ (Figures 2a-2d). The short rain experienced in this region and most part of east Africa is related to the southern oscillation through zonal pressure gradients produced by sea surface temperature anomaly [12]. The long rain season starts from April and extend to May while the short rain period is experienced from September to October. In Moyale and Garrissa, June-July-August (JJA) season receives least rainfall amount which extends up to the month of September in both stations, but Mandera and Wajir hardly receive any rainfall during this season. For these reason, the MAM and OND season are analyzed because if proper water harvesting is done during this period it can help alleviate the problem of water shortage during other seasons of the year. Moreover it is within these seasons that drought resistant crop or crops that take shorter period to grow can be planted (Table 1).
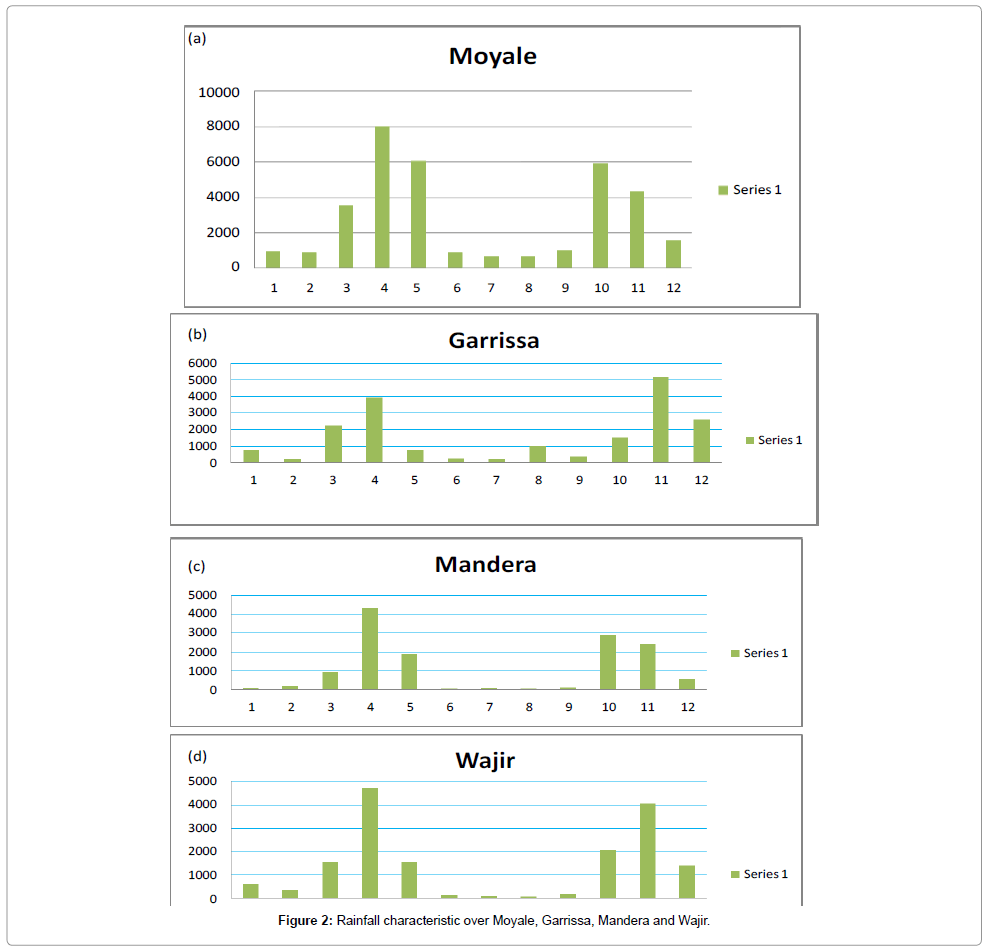
Figure 2: Rainfall characteristic over Moyale, Garrissa, Mandera and Wajir.
| Station Name | Station code | Latitude | Longitude | ||
|---|---|---|---|---|---|
| Wajir | 8840000 | 1° | 45N | 40° | 04E |
| Mandera | 8641000 | 4° | 16N | 40° | 06E |
| Moyale | 8639000 | 3° | 32N | 39° | 03E |
| Garissa | 9039000 | 0° | 29S | 39° | 38E |
Table 1: Summary of selected stations under study.
Drought episode is considered every time the SPI is negative and stops when SPI is positive. The duration of every drought episode is determined by negative index values. The results of applied SPI method on season’s precipitation totals are pointing out higher runs of drought of varying intensity in the last decade (1998-2007), with remarkably expressed drought intensity.
The study assumed that if drought occurred at any intensity (mild drought or moderately dry) based on the analysis at the four stations under study for that specific season in a given year, then drought would be considered to have occurred across the province for that specific year. The analysis done returned two drought characteristic; the mild drought and moderately dry condition with SPI values of -0.01 to -0.99 and -1.0 to -1.49 respectively as shown by Figures 3 and 4. The results of applied SPI method on season’s precipitation totals are pointing out a higher runs of drought of varying intensity in the last decade (1998- 2007), with remarkably expressed drought intensity. Therefore, the drought is assumed to have occurred in 1973, 1974, 1976, 1980, 1983, 1984, 1986, 1987, 1992, 1994, 1999-2001 and 2004-2008. The longest drought period is considered to have occurred between 1999-2001 and 2004-2008 for the MAM season and 1969-1976, 1983-1988 and 1998- 2001 for the OND Season. Therefore, the highest damage to rain fed agriculture and pastures was borne in these years. Most of the drought experienced during the MAM season is seen to have started building up during the OND season of the previous year.
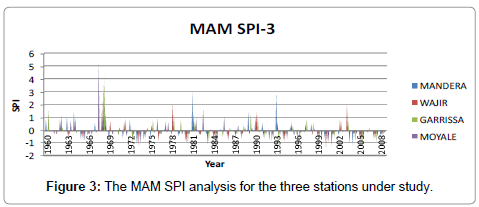
Figure 3: The MAM SPI analysis for the three stations under study.
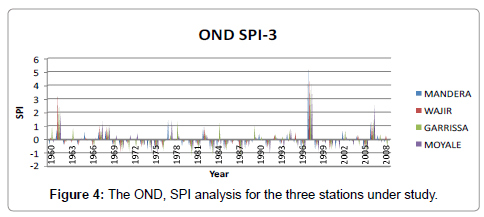
Figure 4: The OND, SPI analysis for the three stations under study.
From the analysis of Probabilities of occurrence of drought, there was a high probability of mild drought both in MAM and OND seasons in all stations under study with Wajir recording the highest probability (Table 2).
| Mandera | Wajir | Moyale | Garrissa | |||||
|---|---|---|---|---|---|---|---|---|
| Drought category | MAM | OND | MAM | OND | MAM | OND | MAM | OND |
| Mild drought | 0.551 | 0.6735 | 0.5306 | 0.6939 | 0.6327 | 0.4082 | 0.4898 | 0.551 |
| Moderate drought | 0.061 | 0 | 0.102 | 0 | 0.0612 | 0.1224 | 0.102 | 0.0816 |
Table 2: Probability values for Mandera, Wajir, Moyale and Garrissa.
While the Probability for moderate drought is low in all stations; the probability of occurrence of moderate dry season is 0 (zero) in Wajir and Garrissa during the OND season showing that this drought condition do not normally occur during this season in the two stations.
The study examined persistence by comparing the relative frequency of various runs for each drought category that is the probability that once the drought of a given category has occurred, it will last for given years m. Individual drought category had low probability for higher runs. On the other hand drought of varying intensity were observed to last for several seasons indicating that drought may persist but intensity varies from one season to another. In both seasons the probability of occurrence of a given drought characteristic decreased as the number of runs increased. The probability of occurrence of mild drought of only a single run recorded the highest frequency in MAM season while the drought run of frequency beyond 4 runs were not recorded. There were no runs recorded for OND season in Wajir (Table 3a). In Mandera the probability of occurrence of mild drought of a single run recorded the highest frequency in OND season and recorded single runs throughout run values of 8 seasons (Table 3b). Moderate drought condition only recorded a single run for MAM season and no runs recorded for OND season.
In Garrissa the probability of occurrence of mild drought of a single run recorded the highest frequency in MAM season and decreased henceforth until run 5 and beyond where there was none recorded (Table 3c). The moderate drought category only registered a single run for both the MAM and OND seasons. In OND season the mild drought condition recorded the longest run of 8. In Moyale the probability of occurrence of mild drought of a single run had the highest frequency in both MAM and OND seasons (Table 3d). MAM season recorded single values of high runs values of 5 and 7 seasons. Moderate drought condition only recorded a single run for both seasons.
| Season | Category | Runs | |||||||
|---|---|---|---|---|---|---|---|---|---|
| 1 | 2 | 3 | 4 | 5 | 6 | 7 | 8 | ||
| MAM | Mild drought | 10 | 3 | 2 | 0 | 0 | 0 | 0 | 0 |
| moderate drought | 5 | 0 | 0 | 0 | 0 | 0 | 0 | 0 | |
| OND | Mild drought | 3 | 2 | 2 | 0 | 0 | 2 | 0 | 1 |
| moderate drought | 0 | 0 | 0 | 0 | 0 | 0 | 0 | 0 | |
| Season | Category | Runs | |||||||
|---|---|---|---|---|---|---|---|---|---|
| 1 | 2 | 3 | 4 | 5 | 6 | 7 | 8 | ||
| MAM | Mild drought | 3 | 4 | 4 | 1 | 0 | 0 | 0 | 0 |
| moderate drought | 3 | 0 | 0 | 0 | 0 | 0 | 0 | 0 | |
| OND | Mild drought | 8 | 2 | 1 | 1 | 0 | 2 | 1 | 1 |
| moderate drought | 0 | 0 | 0 | 0 | 0 | 0 | 0 | 0 | |
| Season | Category | Runs | |||||||
|---|---|---|---|---|---|---|---|---|---|
| 1 | 2 | 3 | 4 | 5 | 6 | 7 | 8 | ||
| MAM | Mild drought | 7 | 5 | 1 | 1 | 0 | 0 | 0 | 0 |
| moderate drought | 3 | 0 | 0 | 0 | 0 | 0 | 0 | 0 | |
| OND | Mild drought | 6 | 3 | 1 | 1 | 0 | 0 | 0 | 1 |
| moderate drought | 4 | 0 | 0 | 0 | 0 | 0 | 0 | 0 | |
| Season | Category | Runs | |||||||
|---|---|---|---|---|---|---|---|---|---|
| 1 | 2 | 3 | 4 | 5 | 6 | 7 | 8 | ||
| MAM | Mild drought | 4 | 3 | 3 | 0 | 1 | 0 | 1 | 0 |
| moderate drought | 3 | 0 | 0 | 0 | 0 | 0 | 0 | 0 | |
| OND | Mild drought | 8 | 4 | 0 | 1 | 0 | 0 | 0 | 0 |
| moderate drought | 4 | 1 | 0 | 0 | 0 | 0 | 0 | 0 | |
Table 3: Result of drought persistence.
Equally important is the conditional probability that if a drought occur, it will continue for a duration of m seasons. Such probability can be used in prediction of drought occurrence. The probability of occurrence of drought of at least more than two, three, four and five successive seasons were calculated and the result shown in Table 4.
| Runs | Wajir | Garrissa | Moyale | Mandera | ||||
|---|---|---|---|---|---|---|---|---|
| MAM | OND | MAM | OND | MAM | OND | MAM | OND | |
| 2 | 0.692 | 0.636 | 0.692 | 0.636 | 0.7 | 0.615 | 0.818 | 0.429 |
| 3 | 0.385 | 0.455 | 0.385 | 0.545 | 0.6 | 0.231 | 0.636 | 0.286 |
| 4 | 0.231 | 0.273 | 0.154 | 0.273 | 0.2 | 0.154 | 0.182 | 0.214 |
| 5 | 0.077 | 0.273 | 0 | 0.091 | 0.2 | 0 | 0.091 | 0.143 |
Table 4: Conditional probability for the station under study.
Recurrence pattern of drought over the region was investigated using the Single Fourier spectral analysis. This was achieved using CLIMLAB 2000 software and the graphical results are represented in Figures 5a-5d.
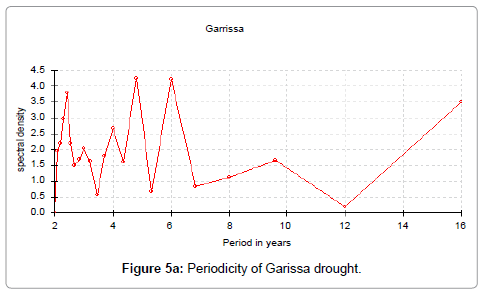
Figure 5a: Periodicity of Garissa drought.
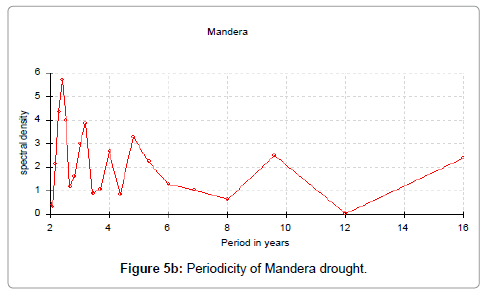
Figure 5b: Periodicity of Mandera drought.
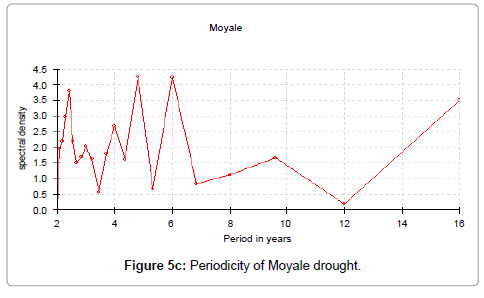
Figure 5c: Periodicity of Moyale drought.
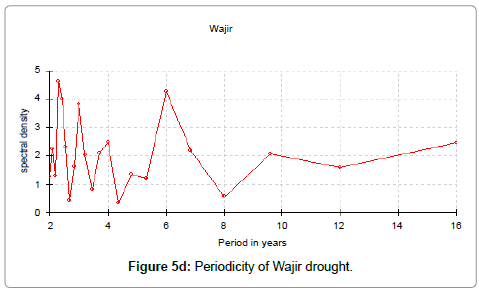
Figure 5d: Periodicity of Wajir drought.
The cycle observed from the spectral analysis could be grouped into 2-3 yrs, 2.5-3.5 yrs, 4.5-7 yrs and 8-12 yrs. The 2-3 yrs rainfall oscillation may be associated with QBO in the stratosphere [14]. According to Mason and Tyson [13], QBO enhances rainfall when in westerly phase and enhances drought when in an easterly phase. The association between stratospheric westerly winds and above normal rainfall over east Africa is 80% while the association between stratospheric easterly wind and below normal rainfall during short and long rain are 71% and 75% respectively [5]. The oscillation of 2.5-3.5 yrs and 4.5-7 yrs obtained are in agreement with Ogallo [5] and Nicholson and Nyenzi [15]. This periodicity is associated with ENSO and sea surface temperature fluxes in the equatorial Indian and Atlantic oceans. The 8-12 years cycle may be associated with sun’s activities.
Conclusion
Universal use of any drought indices is yet to be established therefore choice of index is subjective. Though there is flexibility in SPI analysis and indices can be generated ranging from month to years. Still SPI have limitations that it cannot account for water deficit caused by evapotranspiration, deep percolation, soil moisture and recharge and run off. In order to improve indices one has to consider such factors that influence water. An example is Palmer drought index. Due to unavailability of data of parameter involved in Palmer algorithms this index was no used. A more elaborate way of studying drought would be use of areal averaged rainfall records. Before areal rainfall calculation is done regions are grouped into areas experiencing same climatic condition e.g. use of principal component analysis.
The droughts analysis over the area of study varied between mild drought and moderately dry condition. Given that these are rainfall seasons and as such the conditions might worsen during other dry seasons, reducing the risks and therefore the impacts of drought is of utmost importance and requires that greater emphasis be placed on preparedness and mitigation. The findings have established that in the last decade (1998-2008) there has been an increase in drought runs with Moyale recording the highest run of 10; increase in drought conditions could be associated to climate change. Occurrence of drought didn’t have didn’t have preferred period of onset or withdrawal. Considering the recurrence pattern of drought as seen from the study, drought Monitoring and early warning is therefore, essential and can provide the foundation for making timely decision by decision makers and concerned subjects (i.e., farmers and national policy makers).
Acknowledgement
The author acknowledges Kenya Meteorological Department, for providing the rainfall data used in this research.
References
- Usher PEO (2000) Kenya and ENSO: An observation and La nina prediction. Columbia University Press, New York, USA.
- Anyamba EK (1984) Some aspects of the origin of rainfall deficiency in East Africa. Proc. of the WMO Regional Scientific Conference on GATE, WAMEX and Tropical Meteorology, Dakar, Senegal. 110–112.
- Nieuwolt S (1978) Rainfall variability and drought in East Africa. Erdukunde 28: 81-88.
- Alusa LA, Mushi MT (1974) A study of the Onset, Duration and Cessation of the Rains in East Africa. Proc. of the International Tropical Meteorology meeting in Nairobi, Kenya. American Meteorological Society, Boston, Massachusetts, USA 133-140.
- Ogallo LO, Anyamba EK (1983) Drought of tropical, central and eastern Africa, July-Nov, and Northern springs of 1983-84. First WMO Workshop on Medium and Long range forecast, Maryland USA.
- Demuth S, Stahl K (2001) Assessment of the Regional Impact of Droughts in Europe. Final Report to the European Union, ENV-CT97-0553. Institute of Hydrology, University of Freiburg, Germany.
- IPCC, Climate Change 2001: Contribution To a Report of Working Group II of the Intergovernmental Panel on Climate Change. Allali A, Basalirwa C, Boko M, Dieudone G, Downing TE, et al., USA.
- Campbell DJ (1999) Response to drought among farmers and herders in Southern Kajiado District, Kenya: A comparison of 1972-1976 and 1994-1995. Human Ecology 27: 377-416.
- Oba G (2001) The effect of multiple droughts on cattle in Obbu, Northern Kenya. J of Arid Environ 49: 375-386.
- McKee TB, Doesken NJ, Kliest J (1993) The relationship of drought frequency and duration to time scales. Proceedings of the 8th Conference on Applied Climatology. Anaheim, California 179-184.
- McKee TB, Doesken NJ, Kleist J (1995) Drought monitoring with multiple time scales. Proceedings of the 9th Conference on Applied Climatology. Dallas, TX. American Meteorological Society, Boston, MA 233-236.
- Hastenrath S, Nicklis A, Greischar L (1993) Atmospheric hydrospheric mechanisms of climate anomalies in the western equatorial Indian Ocean. J Geophys Res 98: 20219–20235.
- Mason SJ, Tyson PD (1992) The modulation of sea surface temperature and rainfall associations over southern Africa with solar activity and the Quasi-biennial Oscillation. J Geophys Res 97: 5847-5856.
- McQueen C, Jury MR (1993) Correlation atlas of climatic determinants for Tanzania. Univ Cape Town Tech Rep.
- Nicholson SE, Nyenzi BS (1990) Temporal and spatial variability of SSTs in the tropical Atlantic and Indian Oceans. Meteorol Atmos Phys 42: 1- 17.
Citation: Onyango OA (2014) Analysis of Meteorological Drought in North Eastern Province of Kenya. J Earth Sci Clim Change 5: 219. DOI: 10.4172/2157-7617.1000219
Copyright: ©2014 Onyango OA. This is an open-access article distributed under the terms of the Creative Commons Attribution License, which permits unrestricted use, distribution, and reproduction in any medium, provided the original author and source are credited.
Select your language of interest to view the total content in your interested language
Share This Article
Recommended Journals
Open Access Journals
Article Tools
Article Usage
- Total views: 18826
- [From(publication date): 10-2014 - Aug 30, 2025]
- Breakdown by view type
- HTML page views: 14039
- PDF downloads: 4787