Analysis of Terrestrial Vegetation Trends and Correlation between Vegetation Indices and Climatic Factors
Received: 23-Jan-2019 / Accepted Date: 05-Mar-2019 / Published Date: 14-Mar-2019
Abstract
The outcome of decadal seasonal and annual trend analysis for NDVI and EVI under various land cover classes showed both negative and positive trends. Irrespective of land cover classes, NDVI and EVI during Kharif season showed a greening (positive) trend in vegetation growth whereas during Rabi season it is observed to have browning (negative) trend. The positive greening trend during the Kharif season might be due to the increased vegetation growth and productivity during the period. The declining vegetation (browning) trend in Rabi season might be due to changes in a crop choice or disruption of cropping lands. Decadal annual NDVI and EVI witnesses the positive greening trend except in some parts of Rajkot, Dwarka, Porbandar, Amreli and Jamnagar districts where browning in nature. During decadal Kharif season, weak to moderate positive correlation was noticed between LST and vegetation indices whereas during Rabi season it showed strong to weak negative correlation. It could be observed that about 70 percent of total pixels in all the land cover classes during Kharif season has moderate negative correlation between vegetation indices and net radiation. In Rabi season, the weak negative or positive correlation and moderately positive correlation classes occupies the major percentage of area. The correlation study between vegetation indices and TRMM rainfall showed a weak negative or positive correlation for both the seasons and annual duration which indicates that the rainfall is not a key factor for the vegetation growth in Saurashtra region. The historical trend derived from the time series analysis paved way in identifying the causes for degradation of vegetation coverage.
Keywords: Spatio-temporal variation; Seasonal trends; Correlation
Abbrevations
Normalized Difference Vegetation Index (NDVI); Enhanced Vegetation Index (EVI); Land Surface Temperature (LST); Near-Infrared (NIR) Tropical Rainfall Measuring Mission (TRMM)
Introduction
The robust measure of vegetation activity at the land surface helps to compute vegetation indices from the remotely sensed data based on the optical characteristics of vegetation that are strongly absorptive in the red, but highly reflective in the near-infrared (NIR) regions of the solar spectrum. The optical energy reflected by vegetation is dependent on leaf structure, pigmentation and moisture. MODIS multispectral sensor consisting of several bands of data which provides different information on land properties based on its spectral reflectance through various indices while these features are not available in other sensors. Vegetation index is the indicative factor of vegetation density and growth status, it has positive correlation with vegetation coverage, and, to a certain extent, changes of vegetation coverage, Given the effect of soil background, radiation increases significantly when the vegetation cover is sparse; conversely NIR radiation is reduced to make the relationship between vegetation and soil more sensible.
NDVI can be directly used as a substitute of plant photosynthetic activity and helps in detecting biotic responses to climate change. The trend analysis method was followed to detect changes in deforestation, urban expansion or mining activities. The trends show positive and negative trends over land cover class and precipitation changes in the same time period which seems to have an influence on large NDVI trend areas. Roberts et al., monitored the seasonal changes in atmospheric water vapor, liquid water and surface cover in the Jasper Ridge during 1992 using NDVI showed that green vegetation, NDVI and liquid water were highly correlated [1]. Rasmussen, 1998 found a positive correlation bound NDVI and precipitation. Ahmeda et al., recounted that regression between LST, NDVI and Evapotranspiration (ET) in the Gezira Research station during 6th Sep 2001 and 28th Nov 2002 show negative correlation for all land cover types [2]. Peng et al., reported that EVI had strong correlation with temperature on the seasonal fluctuation at Zhejiang province during 2001–2004 [3]. Zhang et al., reported that a positive correlation between NDVI and temperature was most obvious for coniferous forest and shrubs, that the effect of precipitation on NDVI was not as significant as the effect of temperature and that scrubland NDVI correlated more strongly with precipitation than the NDVI of other vegetation [4]. Chuai et al., performed correlation analyses of NDVI, temperature and precipitation for vegetation types during growing season in Inner Mongolia, China and observed that NDVI correlated differently with temperature and precipitation [5]. Eckert et al., examined whether MODIS NDVI satellite data time series can be used to detect land degradation and regeneration area in Mongolia from 2001 to 2011 [6]. The inter-annual and seasonal trends of vegetation cover were analyzed in the Upper Blue Nile using GIMMS NDVI and MODIS NDVI from 1982 to 2011 and found that the GIMMS NDVI had positive trend during 1981 to 2006 and negative trend in MODIS NDVI from 2001 to 2011 [7]. The pixel-based linear regression model was used to identify the rate of deforestation and fragmentation at landscape level. The classified result was validated with field data and found that it is an effective method for monitoring forest cover change [8]. Comparing MODIS-C5 and C6 vegetation indices products from both Terra and Aqua from 2001 to 2015 proved that Global vegetation showed a remarkable greening trend in the past 15 years and contributes to accurate understanding of vegetation played in the Earth’s biogeochemical and climatic systems [9]. The analysis of vegetation dynamics using time series MODIS vegetation indices viz., NDVI and EVI was carried out seasonally from 2007 to 2017. The NDVI and EVI profiles was extracted for agriculture and forest ecosystem for the Saurashtra region of Gujarat. It was observed that NDVI and EVI showed a good range of spatio-temporal variation in vegetation condition, but there is little variation in the growth profile over the years except 2009, 2012, 2015 and 2016 [10]. With this review of previous study, the further research was carried out to lead a better understanding between the vegetation indices and climatic parameter and also to analyse the decadal seasonal vegetation trends of NDVI and EVI.
Materials And Methods
The following satellite and ancillary data products were downloaded or procured from various sources for the years 2007 to 2017:
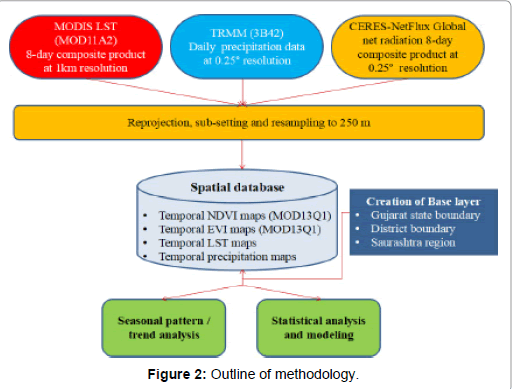
• MODIS Land Surface Temperature (LST) (MOD11A2) of tile H24V6 at 1 km spatial resolution in 8-day gridded level-6 product in the Sinusoidal projection was downloaded from NASA Earth Observing System (EOS) data gateway [11]. MOD11A2 is comprised of day-time and night-time Land Surface Temperature (LST), quality assessment, observation times, view angles, bits of clear-sky days and nights, and emissivity’s estimated in Bands 31 and 32 from land cover types.
• Tropical Rainfall Measurement Mission (TRMM) 3B42 of daily precipitation estimates at 0.25° spatial resolution in NetCDF format was downloaded from NASA Earth Observing System (EOS) data gateway (reverb.echo.nasa.gov/reverb, 2017). TRMM 3B42 depends on inputs from two types of sensors like microwave and infrared (IR).
• CERES-NetFlux Global net radiation data of 8-day composite with 0.25° spatial resolution were downloaded from NASA Earth Observatory website [12]. NetFlux data are convolved from Clouds and the Earth's Radiant Energy System (CERES) sensors on NASA's Terra and Aqua satellites.
Study area
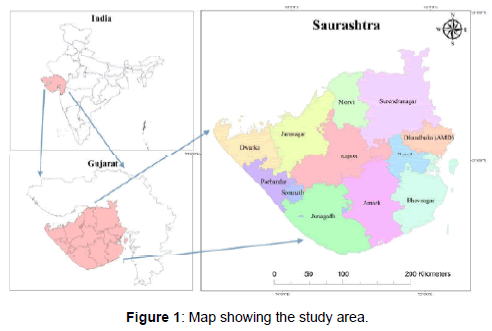
The investigation were carried out in the Saurashtra (60900 sq. km.) region of Gujarat which lies between 22°30' N latitude and 70°78' E longitude which is shown in Figure 1.
Methodology
The outline of methodology was listed in Figure 2.
Softwares used
Preprocessing and processing of satellite data were carried out using MODIS Reprojection Tool (MRT) Release 4.1 and ArcGIS10.1 software respectively. The time series trend analysis and correlation between vegetation indices and climatic variables were carried out in Python environment using the Arcpy and GDAL libraries.
Creation of base layers
Base layers like state boundary, district boundary, district with taluk boundaries were generated from SOI toposheets of scale 1:50000.
Reprojection, sub-setting and resampling
Reprojection was done using MODIS Reprojection Tool (MRT) for projecting from Sinusoidal to Universal Transverse Mercator (UTM 43N). Sub-setting of raster data reduces the time in further processing. Using the base layer, subset was done using ArcGIS Extract by Mask tool. The resampling of LST (1 km), net radiation (0.25°) and TRMM (0.25°) are resampled to 250 m spatial resolution to match with MOD13Q1 vegetation products using resampling tools in ArcGIS.
Time-lag adjustment
By considering the time-lag between MOD13Q1 and other satellite data products, TRMM data were accumulated at 16 days interval to match with the Julian days (16-day composite) of MOD13Q1 [10]. Similarly, MOD11A2 and Net radiation data were averaged at 16-day interval.
Cloud masking
The pixel reliability layer of MODIS products was used to eliminate the cloudy pixels. The highest quality pixels free from cloud cover were only considered and extracted using Flag 0 of pixel reliability layer as mask.
Seasonal pattern/Pixel based trend analysis
A linear regression model was fitted to the time series images of NDVI and EVI both for Kharif and Rabi seasons. The temporal trends with time series data sets were determined using linear regression model, with time as independent variable and NDVI and EVI as dependent variable. The Linear Regression model was fitted among every pixel of time series data. An output image was generated which indicates the slope of the regression line. Positive slope indicates increasing trend and negative slope indicates decreasing trend. A pixel value nearer to zero indicates no specific trend in those pixels.
A linear regression model adapts the following equation:
Y=m X+c
Where Y is the dependent variable, viz., time series data like NDVI
m is the slope of the regression line
X is the time variable
c is the y-intercept
Pixel based correlation analysis
Pearson’s correlation analysis was conducted to understand the correlation between NDVI and EVI with LST, Rainfall and Net Radiation for a temporal period between 2007 and 2017. An output image was generated which indicates the pixel by pixel correlation coefficient. The correlation coefficient is used to represent the strength of the correspondence between NDVI with LST, Rainfall and Net Radiation and EVI with LST, Rainfall and Net Radiation.
Results And Discussion
The results and research findings are discussed in the following sections: Decadal seasonal and annual trend of vegetation indices and Correlation between vegetation indices and climatic factors.
Decadal seasonal and annual trend of vegetation indices
The MODIS vegetation products (NDVI and EVI) for the study period from 2007 to 2017 were subjected to trend analysis to study the variations in vegetation condition. For Kharif season, the satellite data between 145th Julian day (Last week of May) and 273rd Julian day (End of September) was used to study the decadal seasonal Kharif trend. The satellite data from 289th Julian day (October) to 049th Julian day (February) were considered to derive the decadal seasonal Rabi trend. Linear regression analysis was performed for NDVI and EVI separately for Kharif and Rabi seasons. A decadal annual trend of NDVI and EVI were also carried out considering the January to December data as a whole for agricultural and forest areas.
The following sub sections explain the results obtained pertaining to pixel based linear trend analysis of vegetation indices viz., NDVI and EVI for decadal seasonal Kharif, decadal seasonal Rabi and decadal annual for Saurashtra region.
Decadal seasonal trend of NDVI: The decadal seasonal trend of NDVI under different land use classes for Saurashtra region are presented in the Table 1. The results of trend analysis for the various land use classes showed both negative and positive trends. The slope values ranged from -40.41 to 35.00 in cropped area where Kharif crops are grown. The minimum and maximum slope value for Rabi season cropland ranged between -45.18 and 47.70, respectively. Among the cropland class, the Rabi season shows a maximum deviation when compared to Kharif season.
| Land Use | Slope | Percentage of Pixels showing | |||
|---|---|---|---|---|---|
| Minimum | Maximum | Mean | Positive trend | Negative trend | |
| Kharif season | |||||
| Cropland | -40.41 | 35.00 | 5.64 | 82.8 | 17.2 |
| Deciduous forest | -22.92 | 33.41 | 5.80 | 80.3 | 19.7 |
| Scrub/Degraded forest | -24.40 | 30.48 | 5.09 | 78.0 | 22.0 |
| Rabi season | |||||
| Cropland | -45.18 | 47.70 | -0.02 | 48.5 | 51.5 |
| Deciduous forest | -21.81 | 26.79 | -2.41 | 21.4 | 78.6 |
| Scrub/Degraded forest | -31.56 | 36.73 | -0.89 | 43.1 | 56.9 |
Table 1: Decadal seasonal trend of NDVI under different land use classes for Saurashtra region (2007-2017).
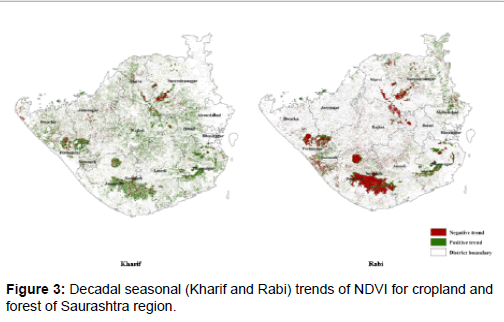
The slope value of deciduous forest class during Kharif season ranged from -22.92 to 33.41 while during Rabi the values ranged between -21.81 and 26.79. The NDVI slope value for Kharif season under scrub/degraded forest varied from -24.40 to 30.48 and for Rabi season the slope values varied between -31.56 to 36.73. Irrespective of seasons, both the forest class has lesser deviation in slope values when compared to cropland class. During Kharif season, more than 78 percent of total pixels in all the land cover classes showed a positive trend and around 22 percent of the pixels showed negative trends in NDVI. For Rabi season, 78.6 percent of total pixels in deciduous forest showed a negative trend in NDVI followed by scrub/degraded forest (56.9 percent) and cropland (51.5 percent) (Table 1 and Figure 3).
In general, the Kharif season showed a greening trend whereas in Rabi season its browning in nature. The positive greening trend during the Kharif season might be due to the increased vegetation growth and productivity during the period [7,13-15]. The negative browning trend in Rabi season for deciduous forest and scrub/degraded forest could be caused by leaf fall followed by regrowth or the dry deciduous nature of the tree species or the already existing vegetation decline or might have strengthened by a period of constantly poor rains [7].
| Land Use | Slope | Percentage of Pixels showing | |||
|---|---|---|---|---|---|
| Minimum | Maximum | Mean | Positive trend | Negative trend | |
| Kharif season | |||||
| Cropland | -29.62 | 27.93 | 3.39 | 76.7 | 23.3 |
| Deciduous forest | -20.09 | 19.97 | 0.96 | 57.5 | 42.5 |
| Scrub/Degraded forest | -30.19 | 22.52 | 2.45 | 70.2 | 29.8 |
| Rabi season | |||||
| Cropland | -34.03 | 35.80 | 0.61 | 54.6 | 45.4 |
| Deciduous forest | -16.45 | 18.88 | -1.50 | 26.7 | 73.3 |
| Scrub/Degraded forest | -22.11 | 28.94 | -0.37 | 46.3 | 53.7 |
Table 2: Decadal seasonal trend of EVI under different land use classes for Saurashtra region (2007-2017).
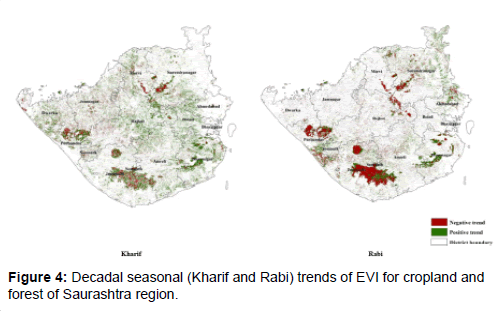
Decadal seasonal trend of EVI: The decadal seasonal trend for EVI during Kharif and Rabi are presented in the Table 2. The minimum and maximum slope value for Kharif cropland ranged between -29.62 to 27.93, respectively. Under land cover class deciduous forest, the slope value ranges from -20.09 to 19.97 and -16.45 to 18.88 during Kharif and Rabi seasons, respectively. The slope value of scrub/degraded forest class during Kharif season ranged from -30.19 to 22.52 while during Rabi the values ranged between -22.11 and 28.94. Irrespective of land cover class, Rabi season EVI found to have more deviation when compared with Kharif season. During Kharif season, more than 70 percent of total pixels in cropland and scrub/degraded forest class showed a positive trend except in deciduous forest the positive trend was around 57.5 percent. For Rabi season, 73.3 percent of total pixels in deciduous forest showed a negative trend in NDVI followed by scrub/degraded forest (53.7 percent) and cropland (45.4 percent) (Table 2 and Figure 4). EVI shows a similar trend in both Kharif and Rabi as that of NDVI. EVI follows the same pattern as NDVI, the Kharif season showed a greening trend whereas in Rabi season it is browning in nature. The declining vegetation (browning) trend in Rabi season might be due to changes in a crop choice or disruption of cropping, which is in line with the result obtained by Dubovyk et al., [16].
Decadal annual trend of vegetation indices: The decadal annual trend on NDVI and EVI for different land cover classes are given in Table 3. The NDVI slope value for cropland varies between -13.37 to 15.67 and for EVI the slope value ranges from -10.07 to 10.33. Irrespective of the vegetation indices, the slope value for deciduous forest and scrub/degraded forest found to be narrow when compared to cropland class. The deciduous forest has slope value ranges from -5.29 to 7.85 and from -3.49 to 5.59 for NDVI and EVI, respectively.
| Land Use | Slope | Percentage of Pixels showing | |||
|---|---|---|---|---|---|
| Minimum | Maximum | Mean | Positive trend | Negative trend | |
| NDVI | |||||
| Cropland | -13.37 | 15.65 | 0.93 | 72.5 | 27.5 |
| Deciduous forest | -5.29 | 7.85 | 1.60 | 91.0 | 9.0 |
| Scrub/Degraded forest | -7.99 | 8.18 | 1.21 | 80.7 | 19.3 |
| EVI | |||||
| Cropland | -10.07 | 10.33 | 0.67 | 71.7 | 28.3 |
| Deciduous forest | -3.49 | 5.59 | 0.71 | 80.8 | 19.2 |
| Scrub/Degraded forest | -6.79 | 6.64 | 0.69 | 78.7 | 21.3 |
Table 3: Decadal annual trends of vegetation indices for cropland and forest (2007-2017).
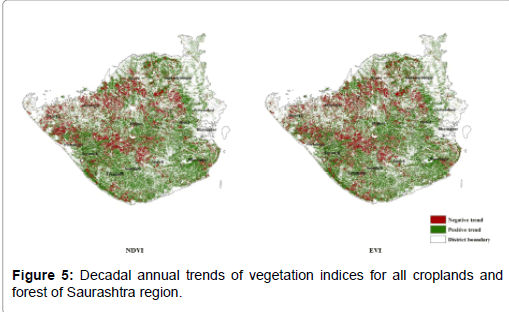
The minimum NDVI slope value for scrub/degraded forest is -7.99 and maximum is 8.18 and the EVI slope value ranges from -6.79 to 6.64. Irrespective of land cover classes, it is observed that about 70 percent of pixels are showing positive trend for decadal annual NDVI and EVI (Table 3 and Figure 5). Both NDVI and EVI image showed negative trend in some parts of Rajkot, Dwarka, Porbandar, Amreli and Jamnagar districts. The browning (negative) trend might be associated with the degraded saline and sodic soil fields or those abandoned from cultivation or dominated by coastal sandy soils with insecure supply of irrigation water which in turn, causes decline in vegetation growth and cultivated land degradation. Similar results are reported by Sonnenschein et al., and Dubovyk et al., [16,17].
Correlation between vegetation indices and climatic factors
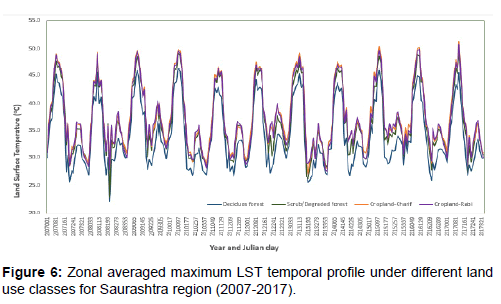
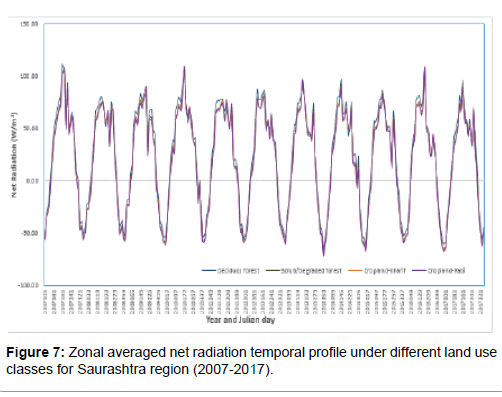
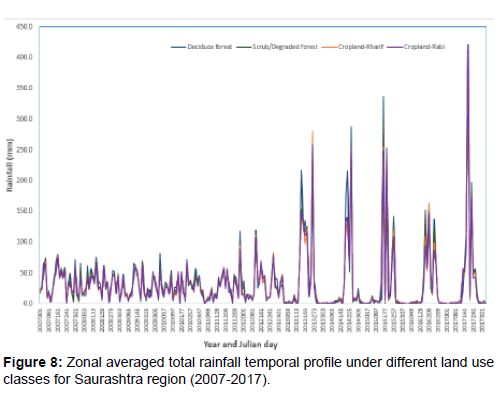
In order to have a better understanding on the behavior of climatic factors under different land cover classes in Saurashtra region, time series plot on LST, net radiation and TRMM rainfall were generated and presented in Figures 5 to 7 respectively.
Time series plot of Land Surface Temperature (LST): The Land Surface Temperature (LST) is the radiative skin temperature of the land surface, as measured in the direction of the remote sensor. LST is the mixture of bare soil and vegetation temperature and the estimation of LST depends on the albedo, soil c and vegetation covers. The land surface temperature derived from MODIS sensor data for the study region for two seasons viz., Kharif and Rabi under different land cover classes are presented in Table 4 and Figure 6. Irrespective of the land cover classes, LST values were found to be higher during the March of every year (81st Julian day) (Figure 6).
| Year | Cropland | Deciduous forest | Scrub/Degraded forest | |||
|---|---|---|---|---|---|---|
| Kharif | Rabi | Kharif | Rabi | Kharif | Rabi | |
| 2007 | 34.62 | 32.63 | 31.96 | 30.21 | 35.27 | 32.45 |
| 2008 | 33.82 | 34.36 | 30.61 | 32.21 | 33.76 | 34.27 |
| 2009 | 36.24 | 35.73 | 32.73 | 33.03 | 36.52 | 35.19 |
| 2010 | 33.47 | 31.79 | 31.46 | 29.68 | 34.27 | 31.78 |
| 2011 | 32.84 | 32.81 | 31.14 | 31.16 | 33.60 | 33.00 |
| 2012 | 35.98 | 36.07 | 31.87 | 32.98 | 35.23 | 34.88 |
| 2013 | 33.08 | 31.62 | 31.24 | 29.97 | 33.39 | 31.82 |
| 2014 | 36.06 | 33.93 | 32.27 | 31.30 | 35.68 | 33.55 |
| 2015 | 35.80 | 34.88 | 32.55 | 32.32 | 36.03 | 34.43 |
| 2016 | 35.59 | 33.75 | 32.35 | 31.26 | 35.61 | 33.74 |
| 2017 | 33.85 | 33.64 | 31.02 | 31.28 | 33.92 | 33.47 |
| Mean | 34.67 | 33.75 | 31.75 | 31.40 | 34.84 | 33.51 |
| Standard Deviation | 1.30 | 1.47 | 0.70 | 1.15 | 1.09 | 1.16 |
| Coefficient of variation | 3.76 | 4.35 | 2.19 | 3.66 | 3.13 | 3.46 |
Table 4: Zonal maximum averaged LST (°C) during Kharif and Rabi season under cropland and forest for Saurashtra region (2007-2017).
The zonal maximum averaged LST during Kharif season in cropland shows variation over years, the value ranged from 32.84°C to 36.24°C, whereas during Rabi season the LST ranged from 31.62°C to 36.07°C. During Kharif season, deciduous forest shows a minimum LST value of 30.61°C and maximum of 32.73°C whereas for scrub/degraded forest the values ranges between 33.39°C and 36.52°C. The LST values ranges from 29.68°C to 33.03°C and 31.78°C to 35.19°C during Rabi season for deciduous forest and scrub/degraded forest respectively. The mean LST value during Kharif season found to be higher for scrub/degraded forest (34.84°C) followed by cropland (34.67°C) and deciduous forest (31.75°C) whereas during Rabi season the mean LST found to be higher in cropland (33.75°C) followed by scrub/degraded forest (33.51°C) and deciduous forest (31.40°C). Irrespective of land cover classes and season, the coefficient of variation found to be less than 5 percent, which indicates the very less inter-annual variation in LST value for the past decade (Table 4).
Time series plot of net radiation: Net radiation is the balance between incoming and outgoing energy at the top of atmosphere, sometimes called as Net flux. Net radiation will be positive or negative, positive values indicates more of incoming radiation than outgoing radiation. The unit of Net radiation will be given W/m2. The net radiation data derived from Clouds and the Earth's Radiant Energy System (CERES) sensors on NASA's Terra and Aqua satellites for the study region are presented in Table 5 and Figure 7. Irrespective of land cover classes, the zonal averaged net radiation found to be positive during Kharif season and the value ranges between 50.84 W/ m2 (cropland) and 72.25 W/m2 (Deciduous forest) whereas during Rabi season the net radiation value found to be negative with value ranging from -38.96 W/m2 (cropland) to -23.89 W/m2 (deciduous forest).
| Year | Cropland | Deciduous forest | Scrub/Degraded forest | |||
|---|---|---|---|---|---|---|
| Kharif | Rabi | Kharif | Rabi | Kharif | Rabi | |
| 2007 | 68.60 | -31.08 | 72.25 | -23.89 | 69.06 | -28.72 |
| 2008 | 58.53 | -32.35 | 61.03 | -26.10 | 58.48 | -31.06 |
| 2009 | 60.01 | -33.75 | 64.31 | -26.58 | 60.92 | -32.27 |
| 2010 | 67.22 | -33.33 | 67.83 | -26.26 | 67.20 | -31.32 |
| 2011 | 56.23 | -31.46 | 57.37 | -25.92 | 55.90 | -30.04 |
| 2012 | 57.28 | -32.77 | 60.79 | -26.55 | 58.01 | -32.38 |
| 2013 | 58.01 | -37.53 | 59.02 | -31.58 | 58.05 | -36.29 |
| 2014 | 54.21 | -33.31 | 57.45 | -26.13 | 54.97 | -31.27 |
| 2015 | 53.00 | -35.46 | 55.74 | -27.90 | 53.67 | -33.44 |
| 2016 | 50.84 | -39.77 | 51.46 | -33.23 | 51.26 | -38.13 |
| 2017 | 55.17 | -38.96 | 58.04 | -30.73 | 55.86 | -36.61 |
| Mean | 58.10 | -34.52 | 60.48 | -27.72 | 58.49 | -32.87 |
| Standard Deviation | 5.51 | 2.99 | 5.82 | 2.87 | 5.44 | 2.96 |
| Coefficient of variation | 9.49 | -8.67 | 9.62 | -10.35 | 9.29 | -9.01 |
Table 5: Zonal averaged Net Radiation (W/m2) during Kharif and Rabi season under cropland and forest for Saurashtra region (2007-2017).
During Kharif season, the mean positive net radiation values found to be higher in deciduous forest (60.48 W/m2) followed by scrub/ degraded forest (58.49 W/m2) and cropland (58.10 W/m2). Similar pattern was found during Rabi season but in the form of negative net radiation. Irrespective of land cover classes, the inter-annual variation for net radiation during Kharif and Rabi season recorded less coefficient of variation and the value ranged from 8.67 to 10.35 percent.
Time series plot of TRMM rainfall: Rainfall is a key factor that controls active variations in vegetation development in arid and semi-arid regions as vegetation cover in those regions are particularly vulnerable to the quantity, duration and frequency of rainfall [18-22]. The total rainfall (mm) derived from Tropical Rainfall Measuring Mission (TRMM) for the study region (2007 to 2017) are given in Table 6 and Figure 8. In general, total rainfall received during Kharif season was higher than Rabi season, however, the rainfall received from 2013 to 2017 during Rabi season was very minimum compared to the other Rabi season years. The rainfall received during the Kharif season of years 2013 to 2017 was abrupt when compared to the normal rainfall pattern (Figure 8). Irrespective of land cover classes, the Saurashtra region showed higher variability in the rainfall pattern in both the seasons. The coefficient of variation during Kharif season varied from 51.48 percent to 55.82 percent whereas in Rabi season the CV found to vary between 85.50 percent to 92.62 percent (Table 6).
| Year | Cropland | Deciduous forest | Scrub/Degraded forest | |||
|---|---|---|---|---|---|---|
| Kharif | Rabi | Kharif | Rabi | Kharif | Rabi | |
| 2007 | 335.17 | 223.43 | 425.30 | 216.73 | 392.95 | 211.48 |
| 2008 | 202.41 | 249.25 | 300.21 | 275.60 | 285.61 | 240.61 |
| 2009 | 171.18 | 260.07 | 223.62 | 313.38 | 232.62 | 274.05 |
| 2010 | 246.17 | 192.08 | 262.27 | 204.96 | 296.67 | 202.60 |
| 2011 | 252.11 | 224.13 | 287.43 | 310.61 | 293.91 | 264.13 |
| 2012 | 299.55 | 145.89 | 322.92 | 152.59 | 336.30 | 144.03 |
| 2013 | 847.92 | 14.57 | 927.17 | 8.08 | 950.14 | 7.53 |
| 2014 | 631.93 | 37.14 | 780.92 | 34.65 | 679.50 | 25.57 |
| 2015 | 729.03 | 11.41 | 766.07 | 4.70 | 797.48 | 4.17 |
| 2016 | 571.60 | 16.07 | 665.89 | 12.70 | 631.52 | 12.82 |
| 2017 | 813.98 | 10.74 | 878.06 | 7.36 | 934.89 | 9.11 |
| Mean | 463.73 | 125.89 | 530.90 | 140.12 | 530.15 | 126.92 |
| Standard Deviation | 258.85 | 107.64 | 273.33 | 129.78 | 275.56 | 115.35 |
| Coefficient of variation | 55.82 | 85.50 | 51.48 | 92.62 | 51.98 | 90.89 |
Table 6: Zonal total averaged TRMM rainfall (mm) during Kharif and Rabi season under cropland and forest for Saurashtra region (2007-2017).
In general, the total rainfall received during Kharif season varied from 171.18 mm to 950.14 mm whereas in Rabi season it varied between 4.17 mm and 313.38 mm. The mean total rainfall received during Kharif season found to be higher in deciduous forest (530.90 mm) followed by scrub/degraded forest (530.15 mm) and cropland (463.73 mm). Similar pattern was found to be in Rabi season also. Vegetation condition is highly influenced by the climatic conditions of an area. In order to understand the influence of climatic parameters on the vegetation condition, NDVI and EVI for Kharif, Rabi and annual times were subjected for correlation analysis with satellite derived Land Surface Temperature (LST), Net Radiation and TRMM rainfall parameters. Correlation coefficient values ranges between -1 and +1, where, 0 indicates no linear relationship, -1 denotes the perfect linear negative relationship and +1 denotes the perfect linear positive relationship with the variables. To have a better understanding on the derived output correlation images, the images are grouped into -1.0 to -0.6, -0.6 to -0.2, -0.2 to 0.2, 0.2 to 0.6 and 0.6 to 1.0 which indicates strong negative correlation, moderate negative correlation, weak negative or positive correlation, moderate positive correlation and strong positive correlation respectively. The results of the pixel-based correlation analysis between NDVI and EVI with LST, net radiation and rainfall data for Saurashtra region is depicted in the following subsections.
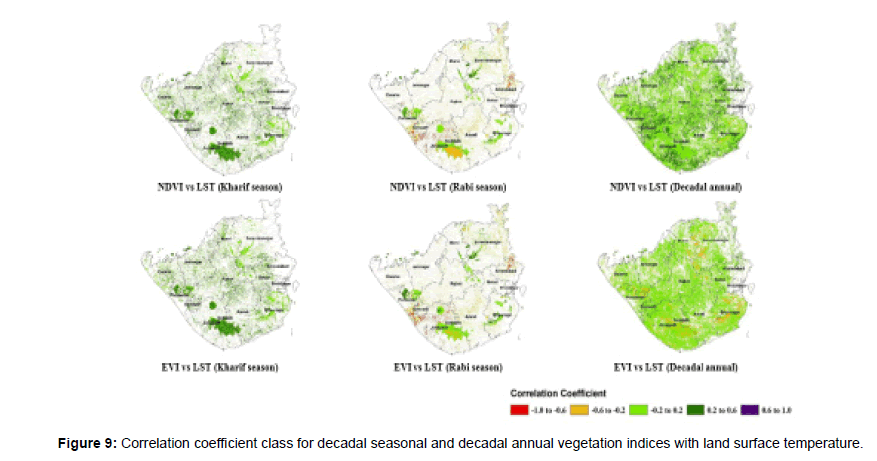
Pixel-based correlation of NDVI and EVI with Land Surface Temperature (LST): Image of pixel wise correlation between NDVI and LST during Kharif, Rabi and annual times for Saurashtra region was generated (Figure 9). In general, correlation coefficient values ranges between -0.84 to 0.65 within the cropland, deciduous forest and scrub/ degraded forest area. It has been noted that the correlation between NDVI and LST during Kharif season are coming under weak negative or positive correlation and moderate positive correlation class. Among the land cover classes, it is observed that 66.20 percent of total pixels in deciduous forest class showed a moderate positive correlation during Kharif season. It could be observed that 12.79 percent of total pixels in crop land category showed a strong negative correlation during Rabi season. Irrespective of land cover class during Rabi season, most pixels fall in between moderate negative correlation and weak negative or positive correlation class. The annual correlation between NDVI and LST showed that about 75 percent of pixels in cropland (considered all the croplands from Kharif, Rabi and Zaid season), deciduous forest and scrub/degraded forest fall in weak negative or positive correlation category (Table 7).
| Land Use | Correlation coefficient | Percentage of pixels under Correlation coefficient class | ||||||
|---|---|---|---|---|---|---|---|---|
| Minimum | Maximum | Mean | -1.0 to -0.6 | -0.6 to -0.2 | -0.2 to 0.2 | 0.2 to 0.6 | 0.6 to 1.0 | |
| Kharif season | ||||||||
| Cropland | -0.27 | 0.65 | 0.20 | - | 0.01 | 47.48 | 52.51 | - |
| Deciduous forest | -0.30 | 0.63 | 0.25 | - | 0.03 | 33.73 | 66.20 | 0.04 |
| Scrub/Degraded forest | -0.29 | 0.61 | 0.14 | - | 0.21 | 70.53 | 29.25 | 0.01 |
| Rabi season | ||||||||
| Cropland | -0.84 | 0.57 | -0.26 | 12.79 | 59.77 | 26.34 | 1.09 | - |
| Deciduous forest | -0.77 | 0.50 | -0.11 | 0.13 | 39.25 | 54.17 | 6.45 | - |
| Scrub/Degraded forest | -0.82 | 0.52 | 0.005 | 0.82 | 12.38 | 71.86 | 14.94 | - |
| Annual | ||||||||
| Cropland | -0.39 | 0.64 | 0.09 | - | 0.28 | 75.30 | 24.41 | 0.01 |
| Deciduous forest | -0.45 | 0.66 | 0.09 | - | 1.99 | 82.36 | 15.60 | 0.05 |
| Scrub/Degraded forest | -0.45 | 0.55 | -0.04 | - | 12.32 | 84.07 | 3.62 | - |
Table 7: Pixel by pixel correlation of NDVI with land surface temperature.
The pixel wise correlation between EVI and LST for Kharif season, Rabi season and annual times are depicted in Figure 9 and land cover wise correlation data are presented in Table 8. It could be observed that more than 80 percent total pixels under cropland, deciduous forest and scrub/degraded forest during Kharif season are coming under the weak negative or positive correlation category. EVI follows the similar pattern of NDVI during Rabi season, most pixels from all three land cover classes falls in between moderate negative correlation and weak negative or positive correlation class. In cropland category during Rabi season, it is observed that 12.54 percent of total pixels showed a strong negative correlation (Table 8). The weak to strong negative correlation reestablishing that cropland and forest class decrease surface temperature during Rabi season [23,24]. It could be observed that 87.75 percent of total pixels in cropland category for decadal annual correlation have weak negative or positive correlation. Whereas in deciduous forest and scrub/degraded forest, 39.76 and 61.77 percent of total pixels showed a moderate negative correlation for annual duration respectively. The moderate negative correlation was spatially spread over in Junagadh, Porbandar, Morvi and Surendranagar districts. During Kharif season and annual duration, the weak to moderate positive correlation in all the land cover classes and vegetation indices may have been caused due to high temperature even with dense vegetation which enhances photosynthesis and respiration for plant growth [24,25].
| Land Use | Correlation coefficient | Percentage of pixels under Correlation coefficient class | ||||||
|---|---|---|---|---|---|---|---|---|
| Minimum | Maximum | Mean | -1.0 to -0.6 | -0.6 to -0.2 | -0.2 to 0.2 | 0.2 to 0.6 | 0.6 to 1.0 | |
| Kharif season | ||||||||
| Cropland | -0.44 | 0.53 | 0.11 | - | 0.41 | 81.89 | 17.70 | - |
| Deciduous forest | -0.45 | 0.51 | 0.09 | - | 1.23 | 82.95 | 15.83 | - |
| Scrub/Degraded forest | -0.50 | 0.46 | -0.01 | - | 8.45 | 87.26 | 4.29 | - |
| Rabi season | ||||||||
| Cropland | -0.83 | 0.67 | -0.22 | 12.54 | 53.76 | 31.39 | 2.31 | - |
| Deciduous forest | -0.77 | 0.56 | -0.03 | 0.12 | 16.40 | 68.85 | 14.63 | - |
| Scrub/Degraded forest | -0.83 | 0.58 | 0.06 | 0.87 | 7.75 | 68.95 | 22.44 | - |
| Annual | ||||||||
| Cropland | -0.57 | 0.46 | -0.03 | - | 8.80 | 87.75 | 3.45 | - |
| Deciduous forest | -0.59 | 0.47 | -0.13 | - | 39.76 | 59.43 | 0.81 | - |
| Scrub/Degraded forest | -0.63 | 0.29 | -0.22 | - | 61.77 | 37.78 | 0.44 | - |
Table 8: Pixel by pixel correlation of EVI with Land surface temperature.
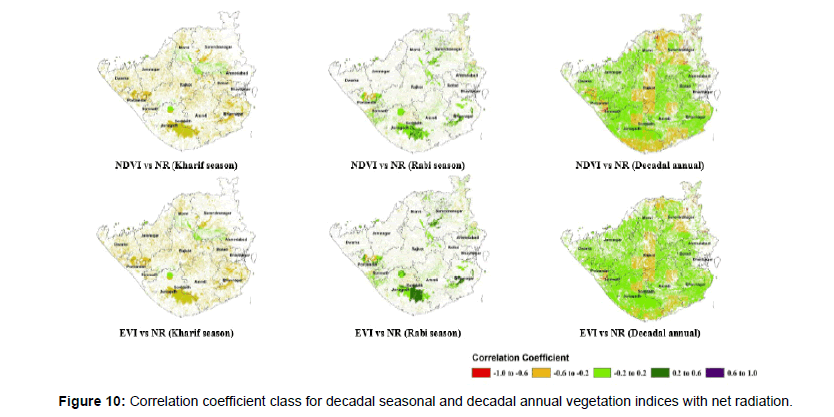
Pixel-based correlation of NDVI and EVI with net radiation: The correlation image between NDVI and Net radiation for Kharif, Rabi and annual times for the study region are presented in Figure 10. Irrespective of season, the correlation coefficient between NDVI and net radiation value ranges between -0.86 to 0.70 in cropland, deciduous forest and scrub/degraded forest areas. It is observed that about 70 percent of pixels in cropland, deciduous forest and scrub/degraded forest during Kharif season reported to have a moderate negative correlation. In Rabi season and annual duration, the most of the pixels observed to have weak negative or positive correlation and the pixel percent varies between 73.94 to 92.67. During Rabi season, 16.76 percent in deciduous forest and 14.07 percent of total pixels in scrub/degraded forest falls in moderate positive correlation class (Table 9).
| Land Use | Correlation coefficient | Percentage of pixels under Correlation coefficient class | ||||||
|---|---|---|---|---|---|---|---|---|
| Minimum | Maximum | Mean | -1.0 to -0.6 | -0.6 to -0.2 | -0.2 to 0.2 | 0.2 to 0.6 | 0.6 to 1.0 | |
| Kharif season | ||||||||
| Cropland | -0.67 | 0.69 | -0.40 | 1.02 | 77.31 | 21.65 | 0.01 | - |
| Deciduous forest | -0.64 | 0.69 | -0.29 | 0.03 | 67.73 | 32.21 | 0.03 | 0.01 |
| Scrub/Degraded forest | -0.65 | 0.69 | -0.33 | 0.09 | 72.66 | 27.22 | 0.02 | 0.01 |
| Rabi season | ||||||||
| Cropland | -0.78 | 0.70 | 0.01 | 0.43 | 15.79 | 76.29 | 7.47 | 0.02 |
| Deciduous forest | -0.72 | 0.59 | 0.05 | - | 6.80 | 76.44 | 16.76 | - |
| Scrub/Degraded forest | -0.70 | 0.47 | 0.05 | 0.09 | 5.97 | 79.87 | 14.07 | - |
| Annual | ||||||||
| Cropland | -0.86 | 0.49 | -0.12 | 1.63 | 24.35 | 73.94 | 0.09 | - |
| Deciduous forest | -0.57 | 0.69 | -0.11 | - | 18.45 | 81.53 | 0.01 | 0.01 |
| Scrub/Degraded forest | -0.62 | 0.69 | -0.05 | - | 7.30 | 92.67 | 0.02 | 0.01 |
Table 9: Pixel by pixel correlation of NDVI with net radiation.
The pixel wise correlation between EVI and net radiation for Kharif season, Rabi season and annual duration are depicted in Figure 9. In general, the correlation coefficient values ranges between -0.81 and 0.70 in the land cover areas of cropland, deciduous forest and scrub/ degraded forest. Similar to NDVI, it could be observed that about 70 percent of total pixels in all the land cover classes during Kharif season has moderate negative correlation. In Rabi season, the weak negative or positive correlation and moderately positive correlation class occupies major percentage of area (Table 10). In Kharif season, outgoing radiation is higher than the incoming radiation, hence the vegetation indices are negatively correlated with vegetation growth whereas in Rabi season, outgoing radiation is very less where we could observe the weak to moderate positive correlation [26]. The correlation coefficient values for annual duration clearly depicts the weak negative or positive correlation class and the value ranges between 83.44 percent and 98.77 percent of the total area.
| Land Use | Correlation coefficient | Percentage of pixels under Correlation coefficient class | ||||||
|---|---|---|---|---|---|---|---|---|
| Minimum | Maximum | Mean | -1.0 to -0.6 | -0.6 to -0.2 | -0.2 to 0.2 | 0.2 to 0.6 | 0.6 to 1.0 | |
| Kharif season | ||||||||
| Cropland | -0.69 | 0.70 | -0.39 | 1.14 | 76.80 | 22.04 | 0.01 | - |
| Deciduous forest | -0.63 | 0.70 | -0.28 | 0.05 | 66.57 | 33.31 | 0.07 | 0.01 |
| Scrub/Degraded forest | -0.65 | 0.70 | -0.30 | 0.09 | 69.99 | 29.86 | 0.04 | 0.01 |
| Rabi season | ||||||||
| Cropland | -0.77 | 0.70 | 0.03 | 0.25 | 13.40 | 76.13 | 10.19 | 0.02 |
| Deciduous forest | -0.71 | 0.63 | 0.10 | - | 7.11 | 47.86 | 45.02 | - |
| Scrub/Degraded forest | -0.70 | 0.55 | 0.07 | 0.08 | 6.94 | 66.14 | 26.84 | - |
| Annual | ||||||||
| Cropland | -0.81 | 0.49 | -0.07 | 0.72 | 15.60 | 83.44 | 0.24 | - |
| Deciduous forest | -0.46 | 0.70 | -0.02 | - | 1.14 | 98.77 | 0.08 | 0.01 |
| Scrub/Degraded forest | -0.53 | 0.70 | 0.00 | - | 1.25 | 97.47 | 1.27 | 0.01 |
Table 10: Pixel by pixel correlation of EVI with net radiation.
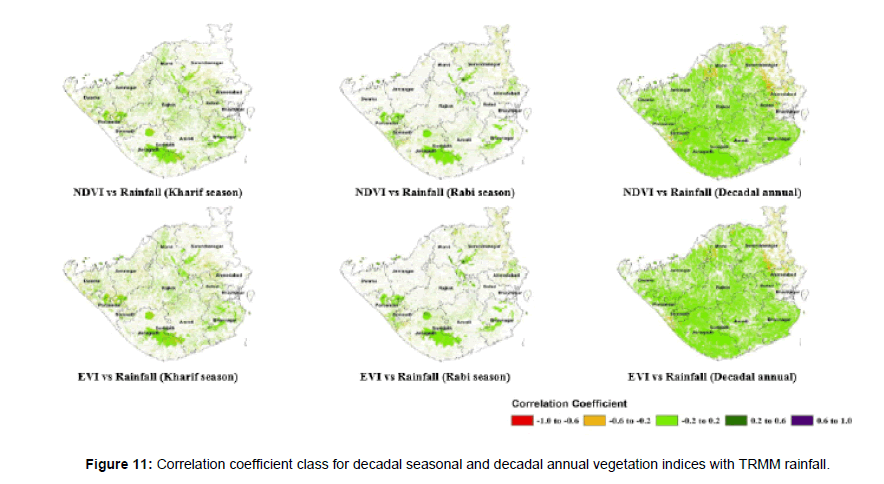
Pixel-based correlation of NDVI and EVI with TRMM rainfall: The pixel based correlation between NDVI and EVI with TRMM rainfall was generated for the Saurashtra region and presented in Figure 11. Irrespective of land cover classes and season, the correlation between NDVI and rainfall varies between -0.67 to 0.62. A weak negative or positive correlation (-0.2 to 0.2) is observed in all the land cover class and seasons (Table 11). The Saurashtra region is characterized by dry hot climate with shallow fine textured soils, in despite of high rainfall during Kharif season, the weak correlation exists between NDVI and rainfall, which might be due to high surface run-off [27]. It is observed that 16.10 percent of total pixels during Kharif season and 17.28 percent of total pixels during Rabi season under cropland class has moderate negative correlation. This shows that the increase in rainfall leads to decline in vegetation health which might be due to abrupt change in rainfall pattern during Kharif and Rabi seasons (Table 6 and Figure 8). Several authors reported similar results [28,29].
| Land Use | Correlation coefficient | Percentage of pixels under Correlation coefficient class | ||||||
|---|---|---|---|---|---|---|---|---|
| Minimum | Maximum | Mean | -1.0 to -0.6 | -0.6 to -0.2 | -0.2 to 0.2 | 0.2 to 0.6 | 0.6 to 1.0 | |
| Kharif season | ||||||||
| Cropland | -0.45 | 0.62 | -0.11 | - | 16.10 | 82.07 | 1.83 | - |
| Deciduous forest | -0.41 | 0.59 | -0.07 | - | 8.93 | 86.48 | 4.59 | - |
| Scrub/Degraded forest | -0.41 | 0.57 | -0.09 | - | 13.00 | 84.42 | 2.58 | - |
| Rabi season | ||||||||
| Cropland | -0.67 | 0.56 | 0.03 | 0.06 | 17.28 | 78.58 | 4.08 | - |
| Deciduous forest | -0.46 | 0.40 | 0.07 | - | 0.30 | 97.12 | 2.58 | - |
| Scrub/Degraded forest | -0.52 | 0.58 | 0.04 | - | 2.60 | 91.07 | 6.32 | - |
| Annual | ||||||||
| Cropland | -0.46 | 0.45 | -0.06 | - | 8.77 | 91.17 | 0.06 | - |
| Deciduous forest | -0.27 | 0.19 | -0.01 | - | 0.31 | 99.69 | - | - |
| Scrub/Degraded forest | -0.27 | 0.38 | 0.02 | - | 0.20 | 99.53 | 0.27 | - |
Table 11: Pixel by pixel correlation of NDVI with TRMM rainfall.
In general, the correlation coefficient values between EVI and TRMM rainfall ranges between -0.65 and 0.61 in the land cover areas of cropland, deciduous forest and scrub/degraded forest (Table 12). Irrespective of land cover class and season, more than 80 percent pixels reported weak negative or positive correlation. It clearly indicates that the rainfall is not a key factor for vegetation growth in Saurashtra region. Ding et al., reported that precipitation has weak correlation with NDVI for some parts of Tibetan Plateau [29]. The Saurashtra region receives very less rainfall when compared to the northern parts of Gujarat. The annual correlation between NDVI and rainfall showed a weak negative or positive correlation, more than 95 percent of total pixels in all the land cover types falls in that category. This might be due to the poor rainfall or varied rainfall pattern which doesn’t support the vegetation growth. Similar results were also obtained by Revadekar et al., for some parts of Indian region [30]. From this, it could be inferred that, the correlation analysis shows significant impact of inter-annual variability of rainfall on the NDVI and EVI. Similar conclusions were drawn by Revadekar et al., [31].
| Land Use | Correlation coefficient | Percentage of pixels under Correlation coefficient class | ||||||
|---|---|---|---|---|---|---|---|---|
| Minimum | Maximum | Mean | -1.0 to -0.6 | -0.6 to -0.2 | -0.2 to 0.2 | 0.2 to 0.6 | 0.6 to 1.0 | |
| Kharif season | ||||||||
| Cropland | -0.47 | 0.61 | -0.11 | - | 16.94 | 81.21 | 1.85 | - |
| Deciduous forest | -0.47 | 0.60 | -0.08 | - | 13.95 | 81.36 | 4.69 | - |
| Scrub/Degraded forest | -0.47 | 0.57 | -0.08 | - | 11.30 | 86.12 | 2.58 | - |
| Rabi season | ||||||||
| Cropland | -0.65 | 0.56 | 0.03 | 0.06 | 18.09 | 77.53 | 4.32 | - |
| Deciduous forest | -0.49 | 0.40 | 0.09 | - | 0.36 | 94.07 | 5.57 | - |
| Scrub/Degraded forest | -0.56 | 0.53 | 0.04 | - | 2.71 | 90.25 | 7.04 | - |
| Annual | ||||||||
| Cropland | -0.44 | 0.40 | -0.02 | - | 5.61 | 94.06 | 0.33 | - |
| Deciduous forest | -0.20 | 0.24 | 0.07 | - | Roberts D, Green R, Adams J (1997) Temporal and spatial patterns in vegetation and atmospheric properties from Remote Sens Environ 62: 223-240.
Citation: Dhanapriya M, Kumaraperumal R (2019) Analysis of Terrestrial Vegetation Trends and Correlation between Vegetation Indices and Climatic Factors. J Earth Sci Clim Change 10:511. Copyright: © 2019 Dhanapriya M, et al. This is an open-access article distributed under the terms of the Creative Commons Attribution License, which permits unrestricted use, distribution, and reproduction in any medium, provided the original author and source are credited. Select your language of interest to view the total content in your interested language Share This ArticleRecommended JournalsOpen Access JournalsArticle Usage
Peer Reviewed JournalsMake the best use of Scientific Research and information from our 700 + peer reviewed, Open Access Journals Journals by SubjectClinical & Medical JournalsInternational Conferences 2025-26
Conferences by CountryMedical & Clinical Conferences | |||

