Application of Remote Sensing and Gis Technology for Pre and Post Flood Analysis (2014) along River Chenab, Pakistan
Received: 21-Sep-2015 / Accepted Date: 06-Oct-2016 / Published Date: 16-Oct-2015 DOI: 10.4172/2157-7617.1000318
Abstract
Due to anthropogenic activities and climatic variability, floods have been raised lately in several regions worldwide. The resulting impact of floods on environment is often harmful. This is particularly applicable to under developed countries like Pakistan, the country which is known for dry climatic conditions, and it became known region for such natural hazards and calamities. The present study showed an effective method of using Geographical Information system (GIS) for generation of expected flood hazard areas mapping from the available data sets. The study conducted flood analysis by using Remote Sensing and GIS technique along River Chenab in the vicinity of Sialkot, Gujrat and some area of Wazirabad Pakistan, during flood event that occurred in 2014. For this purpose, the satellite data used were two Landsat 8 images (L8 OLI/TIRS), the first one acquired on 25 August 2014, about 10 days before the flood and the second one acquired on 10 September 2014, four days after the event used as the main input to assess the damages with the help of GIS analysis tools. Different GIS and remote sending techniques were applied for the analysis of flood affected areas in Pakistan.
Keywords: Calamities; Flood analysis; Remote sensing; River chenab; Natural hazards
9231Introduction
Natural disasters occurring all over the world have a significant impact on regional and global environment and economy however, their distribution around the globe varies regarding type, frequency and impact [1]. The natural hazards can be enlisted as landslides, cyclones in coastal areas, drought in rain-scarce areas, earthquakes, floods in heavy rainfall regions that affect the areas/environment [2]. As Hussain et al. [3] cited in Sowmya et al. [4] the impact of flooding is determined by a combination of natural and human induced factors. According to Rozalis [5] the main factor which contributes to flood hazard is due to extreme rain fall in a relatively short duration. The Intergovernmental Panel on Climate Change (IPCC) predicts that “increase in heavy precipitation events will enhance flood risk” [6]. Alaghmand et al. [7] cited in Sowmya et al. [4] there is a relationship between urbanization and hydrological characteristics; decreased infiltration, increase in run-off, increase in frequency and flood intensity [8]. Among all the types of natural disasters in Pakistan, flood contributes its disastrous effects up to ninety percent [9]. The floods have been affecting provinces of Pakistan including FATA, Gilgit- Baltistan and Azad Jammu & Kashmir since 1950. Mostly flood damages are caused due to flooding in main rivers and flash floods in secondary and tertiary rivers including hill torrents, besides cyclone and urban flooding [10]. The floods are affecting the Pakistan from time to time since 1928 especially during the monsoon period between July and September. In 2014, the heavy rainfall in the first week of September caused flooding in Pakistan provinces of Azad Kashmir, Punjab, Gilgit- Baltistan, Khyber Pakhtunkhwa and later on Sindh province. About 367 people died in the catastrophe. Over 2.5 million people were affected by the flood event [11]. Using GIS and remote sensing technique, it is made possible to accurately delineate flooded areas, flood-hazard areas and suitable areas for flood shelter in order to minimize impacts [12]. The mapping natural hazards such as floods can be done using remote sensing data [13]. Remote Sensing (RS) technique is one of the valuable tools for assessing the water induced hazard and risk. Remote sensing imagery provides useful information to identify, determine and estimate the flood extent [14]. The main objective of the study is to conduct flood analysis by using Remote Sensing and GIS technique along River Chenab in the vicinity of Sialkot, Gujrat and some area of Wazirabad, Pakistan during flood event that occurred in 2014 [15].
Study area
For this study, Chenab River in the vicinity of Sialkot and Gujrat Districts of Punjab Province in Pakistan was selected. The pilot study area was selected from Marala barrage upper drainage basin to Gujrat Chenab Bridge. The geographical location of the study area lies between at 32°40’40” to 32°29’02” N Latitude and 74°28’18” to 74°04’59” E Longitude. Figure 1 showed the location of the study area. Between Marala and Chenab Bridge number of small tributaries like Doara, Dowara and Halsi contribute into Chenab River [16-18]. Marala Barrage is the rim station at river Chenab and is, therefore of top importance in all the water regulatory matters. The layout of the river is shown in Figure 2.
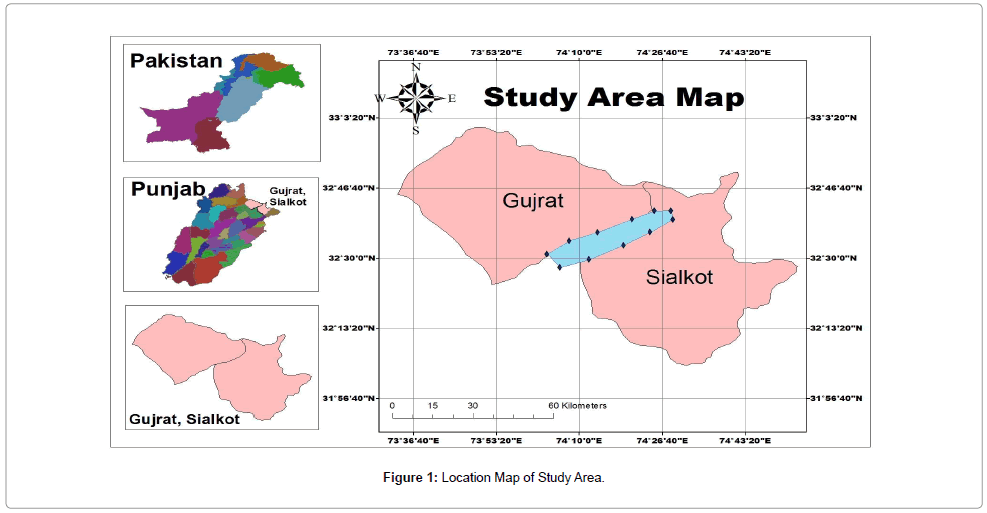
Figure 1: Location Map of Study Area.
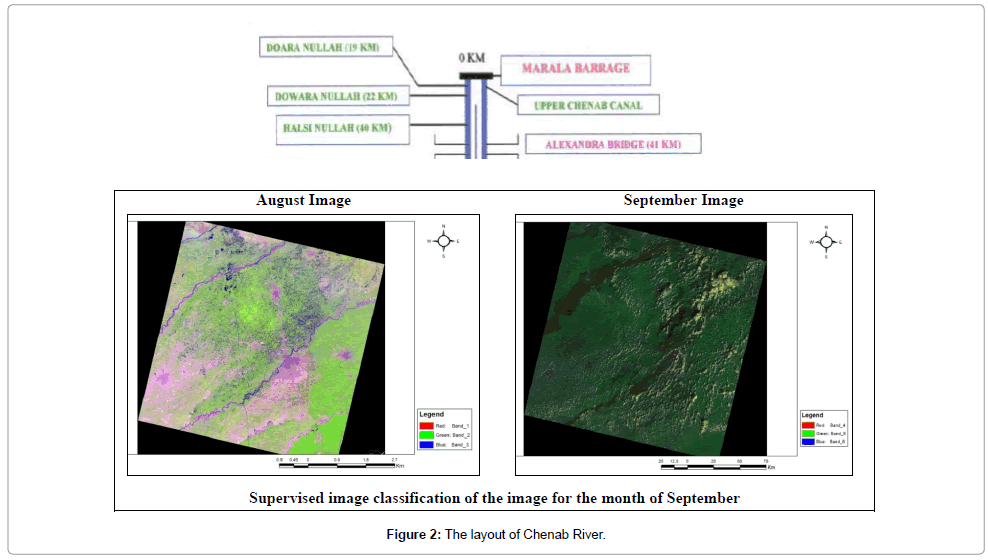
Figure 2: The layout of Chenab River.
Methodology
Both type of Primary and secondary data were used for the analysis of flood affected areas. Satellite images of the study area were downloaded from the USGS, Earth Resources Observation and Science Center (EROS). Two different months of satellite images were used, one image was pre flood for the month of August and other image was for post flood for the month of September 2014.This image covered the flooded areas of northeast Punjab Province, and helped to visualize the extent of the flood along the river courses. Another Landsat image (pre-flood) was obtained on August 25, 2014. The rainfall data obtained from Meteorological Department show heavy flood along Chenab River and other small rivers. Landsat (L8 OLI/TIRS) data acquired had cloud cover of less than 30%. ArcGIS 10.2 Software was used for the classification and analysis of satellite images. Supervised image classification was done using image analysis tool in Arc Map 10.2.IBM SPSS Statistics 20 software was used to conduct analysis of field survey. Landsat 8 satellite images were acquired for the flooded region before and after the flooding event that taken place in Punjab, Pakistan in September 2014. This helps comparing the change that occurred in water body after the flood and thus recognizing a detailed impact assessment.
Remote sensing data and flood mapping
Series of analysis were performed on the processed Landsat images. In the first phase, data was imported into ArcGIS 10 software. The Landsat images acquired were in TIFF format, therefore bands of all raster datasets must be composited or combine to single new multiband raster dataset. The clear resolution of study area was obtained through mosaic of Landsat data. August and September images were input to give single raster data [19]. At the end digitization of study area was carried out in order to identify the extent of flood and to assess the affected areas along Chenab River.
Field survey
A survey was also conducted with members of the people within the study area to aid in reaching adequate conclusions and assessment of damaged occurred. The interview consists of 50 respondents drawn from 5 flood prone areas in Gujrat and Sialkot namely; Chakrala, Mari Khokran, Dhool, Khasa and Kathala. Using a structured guideline, inhabitants of the areas of Sialkot and Gujrat prone to flood disaster from River Chenab were interviewed. Random sampling method was employed in selecting the interviewees. The results of respondents were input to IBM SPSS Statistics 20 software [20-22].
Results And Discussion
River water levels and rainfall data
In the first week of September 2014, most parts of the Punjab Province received heavy rainfall of about 705 mm, mostly in the surrounding of Chenab River. The highest rainfall of 207 mm and 143 mm were recorded on 5th September at Sialkot (Cantt) and Sialkot (Airport) respectively. For the analysis of flood affected areas two images of different month are shown in Figure 3 first one is for the month of August before heavy rainfall and flood, and second one is for the month of September after heavy rainfall and flood (Tables 1 and 2). Third image in Figure 3 is showing the supervised image classification for the month of September. In the super classified image there are five classes which show the distribution of different objects on the map [23]. The first class on the map is showing river in dark blue color which is Chenab River, second class on the map is flood water in blue color which is showing the areas affected due to flooding, the third class on the map is vegetation in green color, the fourth class on the map is built up area in red color and last class is cloud cover shown in white color. The Figure 4 represents the variation of rainfall in September at Marala, Sialkot and Gujrat. The heavy rainfall hit the Sialkot and that of Marala. These areas received extremely heavy rainfall due to which high flood occurred in Chenab River. This high rainfall caused flooding in the River Chenab flowing through Punjab Province. River water levels were much higher than previous years and even reached the “Very High Flood” point as recorded by the Flood Forecasting Division. The major rivers flowing through the current study area are Chenab and between Marala and Chenab Bridge number of small tributaries like Doara, Dowara and Halsi contribute into Chenab River. This flooding situation continued for about a week. The River Chenab was in the very high to exceptionally high flood level (660,271 Cusecs) till Sep 5, 2014. Table 3 showed the water level recorded at Sialkot for Chenab River. According to Pakistan Meteorological Department Flood Forecasting Division there was extremely high flood recorded on the 5th September 2014 in the river of Chenab [24,25]. The areas affected due to this flooding are Gujrat, Sialkot Cant, Sialkot Airport and Marala. There was a heavy loss of property, animal and human life in the affected areas. This graph showed that high flood level at Chenab River was recorded on 6th Sep, 2014 and that was 660,271 cusecs (Figure 5).
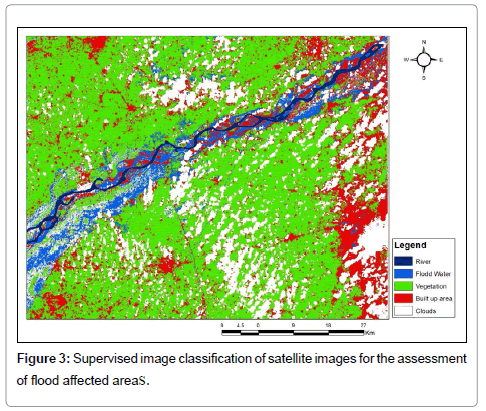
Figure 3: Supervised image classification of satellite images for the assessment of flood affected areas.
| Land sat Satellite | Date | Path/Row |
|---|---|---|
| Landsat 8 OLI/TIRS | 25 August,2014 | 149/37 |
| Landsat 8OLI/TIRS | 10 September,2014 | 149/37 |
Table 1: Summary of Landsat images acquired for the research.
| Location | 25August 2014 Rainfall (mm) | Rainfall at 5th Sep | Rainfall(mm) recorded between the 3rd and 5Sep) | September 2014 Rainfall(mm) |
|---|---|---|---|---|
| Sialkot (Cantt) | Trace | 207 | 471 | 523(20.6in) |
| Sialkot (Airport) | 02 | 143 | 346 | 439(17.3in) |
| Marala | - | 40 | 313 | 405 |
| Gujrat | 01 | 62 | 231 | 310(12in) |
Table 2: Rainfall data. Courtesy: Pakistan Meteorological department flood forecasting division.
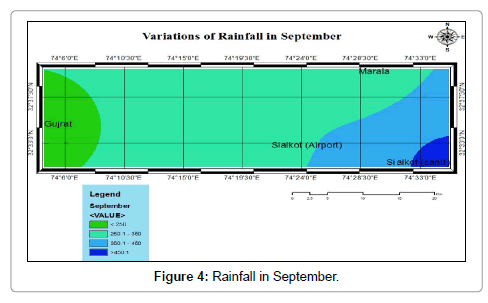
Figure 4: Rainfall in September.
| Chenab River | Site | Flood/ Danger Level | Forecasted Flood Level | ||||
|---|---|---|---|---|---|---|---|
| Sialkot, Head Marala | Low | Medium | High | Very high | Extremely high | ||
| Water Level(Cusecs) | 100 | 150 | 200 | 400 | 600 | - | |
| Recorded on September6 | - | - | - | 350 | - | Very High | |
| Recorded on September5 | - | - | 485 | 660,271 | Exceptionally High | ||
| Recorded on August25 | 40-55 | - | - | - | - | Low to Medium | |
Table 3: Chenab river water flow data and flood forecast (in thousands of cusecs) Courtesy: Pakistan meteorological department flood forecasting division
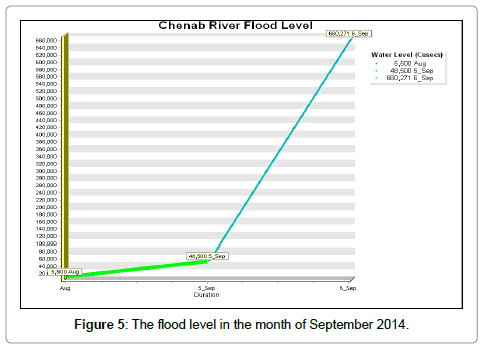
Figure 5: The flood level in the month of September 2014.
Field survey
The result showed that more than 60% residential area was affected by flood, where 70% people lived in this locality for more than 20 years. There were about 4-6 members in a family who were the victims and affected due to flood, 40% of affected people have income of below 20,000. The 80% people became aware of flood and through electronic media and Flood Forecasting Department. Figure 6 shows graphical representation of questionnaire survey conducted in the affected area regarding Flood of 2014. Total 30 respondents were chosen from the study area and were surveyed. IBM SPSS Statistic 20 was used for analysis of this survey. Descriptive analysis was performed for each question by using simple Frequency analysis and Bar Charts were made for each question showing the percentage frequency. Figure 6a shows Nature of property loss in the affected area. According to the conducted survey, 65% of the people lost their houses due to flood and remaining 35% lost their vacant land that was mostly utilized for agricultural purposes. Figure 6b shows that 45% of family owed 4-6 members and 35% families are consisted of more than 6 members. Figure 6c shows that 70% of the families have been living in the affected area for more than 20 years and are being affected by the successive floods hitting this area almost every year. According to Figure 6d monthly income of 40% people are up to 20,000 while only 10% earn more than 40,000 per month this shows that most of the families belong to middle or lower class. With the passing years, there has been improvement in science and technology and it was because 80% of the people were aware of forecasted flood as shown in Figure 6e. That was helpful for people in moving away their valuables and themselves to quite safer places.
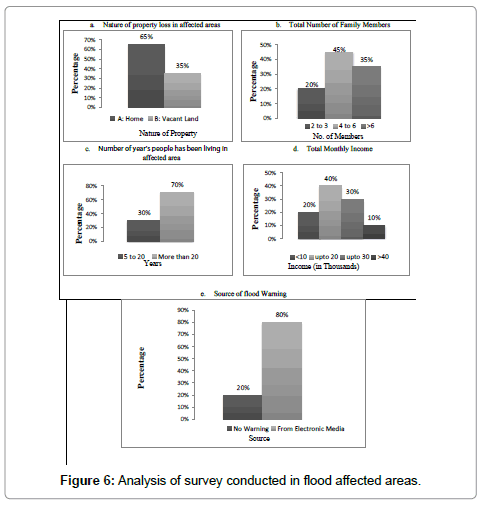
Figure 6: Analysis of survey conducted in flood affected areas.
Conclusion
The GIS techniques and analysis are valuable tools for various fields of study. This has been used for mapping, modeling and analysis of variety of applications in disaster management at various levels and scales. The frequency of floods is increase due to climate change, which will bring heavy rainfall. The poor river management and construction in flood plains reduces the capacity to absorb flood water. The present study shows a simple and cost effective way of using Geographical Information System for creating flood hazard map from the available data base. In this study, an attempt is made to prepare flood hazard map and to identify the flood extent using ArcGIS software. Using the flood hazard map, flood prone areas are identified, which will assist in appropriate planning of development works. The extent of the flood affected areas was marked by using remotely sensed images, which provides the immediate scenario after the disaster and by using this latest technology the affected areas can be monitored remotely. Remote sensing technology helps to manage and reduce the effects of disasters like floods, tsunamis, earthquakes and metrological events. The use of remote sensing and GIS technology is very limited in Pakistan now a days but the trending is changing with the passage of time. Special degree and training courses are being organized in private and public sector universities of Pakistan.
References
- Liu R, Liu N (2002) Flood area and damage estimation in Zhejiang, China. J Environ Manage 66: 1-8.
- Sathish S, Nagendra HN, Ravi G (2012) Application of Remote Sensing and GIS for Flood Risk Analysis: a case study of Krishna and Tungabhadra River Valley. Int J SocSciInterdisciplinary Res1: 50-61.
- Hussain E, Ural S, Malik A, Shan J (2011) Mapping Pakistan 2010 Floods using Remote Sensing Data Paper presented at the ASPRS 2011 Annual Conference Milwaukee, Wisconsin.
- Sowmya K, John CM, Shrivasthava NK (2015) Urban flood vulnerability zoning of Cochin City, southwest coast of India, using remote sensing and GIS. Natxhazards 75: 1271-1286.
- Rozalis S, Morin E, Yair Y, Price C (2010) Flash Flood Prediction using an uncelebrated hydrological model and radar rainfall data in a Mediterranean watershed under changing hydrological conditions. Elsevier J Hydrol 394: 245-255.
- IPCC (2007) In: Pachauri RK, Reisinger A (eds)Fourth Assessment Report of Intergovernmental Panel on Climate Change. Geneva, Switzerland.
- Alaghmand S, Abdullah RB, Abustan I, Vosoogh B (2010) GIS-basedRiver FloodHazard Mapping in Urban Area (A Case Study in Kayuara River Basin,Malaysia). Int J Eng Technol2: 488-500.
- Devries P, Aldrich R (2015) Assessment Approach for Identifying Compatibility of Restoration Projects with Geomorphic and Flooding Processes in Gravel Bed Rivers. Environ Manage 56: 549-568.
- Tariq MAR, Giesen NVD (2012) Floods and Flood Management in Pakistan. Advances Water Resource Manage 47: 11-20.
- Davies R (2014) Pakistan Floods, September 2014 – Facts and Figures. Flood List.
- Uddin K, Gurung DR, Giriaj A, Shrestha B (2013) Application of Remote Sensing and GIS for Flood Hazard Management: A Case Study from Sindh Province, Pakistan. Am J Geographic Information System 2: 1-5.
- Hardmeyer K, Spencer MA (2007) Using risk-based analysis and geographic information systems to assess flooding problems in an urban watershed in Rhode Island. Environ Manage 39: 563-574.
- Kalantari Z, Nickman A, Lyon SW, Olofsson B, Folkeson L (2014) A method for mapping flood hazard along roads. J Environ Manage 133: 69-77.
- Ahmed B, Wei S, Guang Y, Shabbir M, Nabi G, et al. (2014)Effects of Floods policy in Pakistan and Management Issues: (Case of District Dera-Ghazi Khan)Int J Advanced Res 2: 967-974.
- Bhadra A, Choudhury S, Daitakar(2011) Flood Hazard Mapping in Dikrong Basin of Arunachal Pradesh (India)World Academy of Science.EngTechnol 5: 12-22.
- Chingombe W, Pedzisai E, Manatsa D, Mukwada G, Taru P (2015) A Participatory Approach in GIS data collection for Flood Risk Management, Muzarabani district, Zimbabwe. Arabian J Geosci 8: 1029-1040.
- Fernando SLJ (2013) Hydro dynamic simulation of floods in Kushabadra River using Remote Sensing and GIS.Int Journal Sci Environ Technol 2: 1307-1317.
- Haq M, Akhtar M, Muhammad S, Paras S, Rahmatullah J (2012) Techniques of Remote Sensing and GIS for flood monitoring and damage assessment: A case study of Sindh Province, Pakistan. The Egyptian J Remote Sensing and Space Sci 15: 135-141.
- Isma’il M, Saanyol IO (2013)Application of Remote Sensing (RS) and Geographic Information Systems (GIS) in flood vulnerability mapping: Case study of River Kaduna. International J GeomaticsGeosci 3: 618-627.
- Kussul N, Shelestov AY, Skakun SV, Kravchenko O (2008)Data assimilation Technique for Flood Monitoring and Prediction.Information Theories & Applications 15: 76-83.
- Pradhan B, Shafiee M, Pirasteh S (2009) Maximum flood prone area mapping using RADARSAT images and GIS: Kelantan river basin. Int J Geoinformatics 5: 11-23.
- Punithavathi J, Tamilenthi SB (2012) Flood zone mapping of Thanjavur district, Tamilnadu using GIS.Advances in Applied Sci Res 2: 437-449.
Citation: Shakeel M, Munir K, Hina K, Saeed R, Arshad Q, et al. (2015) Application of Remote Sensing and Gis Technology for Pre and Post Flood Analysis (2014) along River Chenab, Pakistan. J Earth Sci Clim Change. 6: 318. DOI: 10.4172/2157-7617.1000318
Copyright: © 2015 Shakeel M. This is an open-access article distributed under the terms of the Creative Commons Attribution License, which permits unrestricted use, distribution, and reproduction in any medium, provided the original author and source are credited.
Select your language of interest to view the total content in your interested language
Share This Article
Recommended Journals
Open Access Journals
Article Tools
Article Usage
- Total views: 14348
- [From(publication date): 12-2015 - Aug 01, 2025]
- Breakdown by view type
- HTML page views: 13048
- PDF downloads: 1300