Applying of High-Resolution Geophysical Techniques for Drainage Investigations at El-Basateen Cemetery Area, Cairo, Egypt
Received: 22-Feb-2018 / Accepted Date: 24-Mar-2018 / Published Date: 29-Mar-2018 DOI: 10.4172/2157-7617.1000453
Abstract
Due to the collapse of some cemetery in Basateen area, South of Cairo, this paper presents the application of geoelectrical resistivity sounding and imaging, as well as ground penetrating radar techniques for outlining the reasons and the presence of draining water and groundwater at the investigated area. A Vertical Electrical Sounding (VES) survey was performed at 3 points through the studied site to investigate the vertical extent of the subsurface sequence and the saturation levels. A total of 9 Dipole-Dipole imaging profiles were surveyed to determine the lateral distribution of saturation of drain water and infiltrated groundwater, and a total of 6 GPR profiles with 100- and 200- MHz antennae were surveyed to evaluate and determine the depth and the degree of saturation of the subsurface layer/s. The qualitative and quantitative interpretation of the acquired VES's and dipole-dipole imaging profiles showing easily the levels of saturations at the studied site. From the interpretation of GPR profiles, it was possible to locate and determine the saturated zones and the level of the groundwater through the area. The radar signals are penetrated enough and enabled the identification of the subsurface reflectors. The results of GPR, VES's and Resistivity imaging showed a good agreement. The integrated interpretations were verified by local geology and information from several bores. Also, the study was supported by a chemical analysis from the drain water and Ein El-Seera spring (close to studied site), to determine the main source of the drain and infiltrated water at the studied site.
Keywords: Ground water; Geoelectrical resistivity; Georadar; Draining water
Introduction
The conventional approach of mechanical drilling to define the hydrological and geological situation of a particular site requires use of both a water boring contractor and a geological on-site is a time consuming and is quite expensive. Correctly applied geophysics will reduce the number of drill-holes required to obtain a continuous and targeted information beside the non-invasive nature of these tools at the cemetery area of Basateen area. By mapping geologic structures with geophysics, a major saving may be made and usually the drilling required for a site can be completed in one day [1].
One of the new developments in recent decades is the application of 2-D electrical imaging surveys to delineate areas with moderately complex geology and of hydrogeological problems [2]. Such surveys are usually carried out using a large number of electrodes, 10 or more, connected to a multi-core cable.
The purpose of electrical surveys is to determine the subsurface resistivity distribution by conducting measurements on the ground surface. The ground resistivity is related to various geological parameters such as the mineral and fluid content, porosity, and degree of water saturation in the rock.
The scientific literature includes many examples of the successful use of the electrical methods in the study of groundwater related problems [3,4]. The nondestructive nature of the Ground Penetrating Radar (GPR) tool is of interest for a variety of engineering and environmental applications.
In such context, the integrated use of geophysical methods provides an important role in the characterization and outlining the reasons of groundwater flow through the cemetery area and percolation of the infiltrated surface groundwater toward the site of the cemetery area.
Geologic Setting
Basateen cemetery were constructed on the western side of El- Mokattam plateau, which is bounded from the eastern side by Gebel El-Guishi, from the southern side by Khaila-Basateen road, from the western side Ein El-Seera-Downtown, and from the north Salah Salem road. The studied site is sloping gently (5-10 deg.) toward Eastern direction (Figure 1).
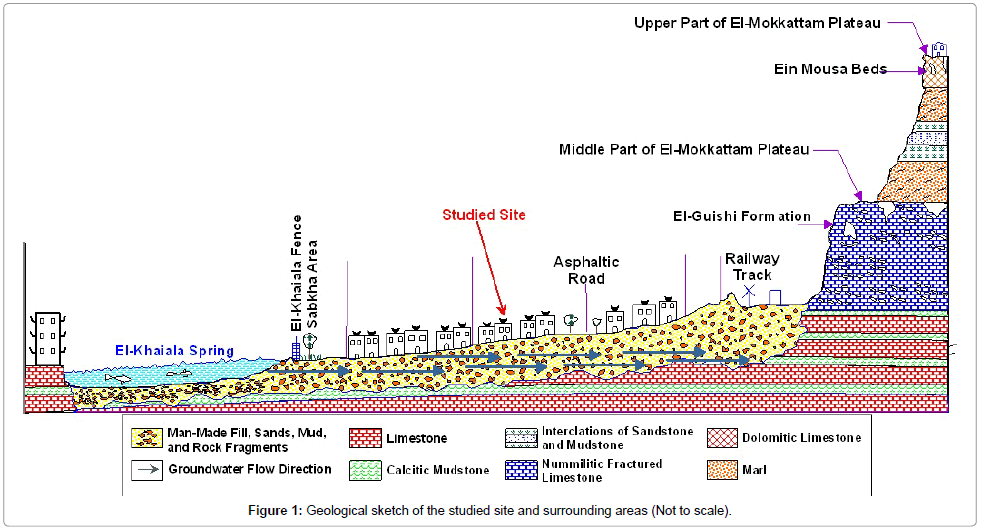
Figure 1: Geological sketch of the studied site and surrounding areas (Not to scale).
Geomorphologically, the studied site can be classified into three parts as following:
1. Eastern part
Representing the eastern part of the studied site near the main escarpment of Gebel El-Guishi, where the graves are located on a somewhat elevated with respect of other parts. This part does not affect by the intruded and infiltrated groundwater.
2. Middle part
Representing the middle part of the studied site, where the graves are located on a somewhat elevated with respect of other parts in which this part affected by the intruded groundwater in the form of draining.
3. Western part
Representing the western part of the studied site, where the graves are located on a lowest elevation level with respect of other parts. In which this part is extremely affected by the intruded groundwater.
Figure 1 showing the panoramic view and geologic sketch of the studied site, and also showing the geologic and geomorphologic setting of the studied site on East-West direction, which is composed of three main units as per CEHM [5]
1. Western escarpment of Gebel El-Guishi: It represents the western side of El-Mokattam plateau and is consisting of three formations from top to bottom as following,
a. Maadi formation: It represents the main bedrock for engineering purposes, which is constructed from top to bottom as (a) highly jointed hard dolomitic limestone (Ein Mousa beds), (b) intercalations from marl (muddy limestone) and high swelling mudstone and sandstones. This geologic sequence representing the western escarpment of high part of El-Mokattam plateau.
b. El-Guishi formation: It consists of thick and homogenous layers of white limestone of Nummulitic shells and mollusca shells. This rock is fair to non-weathered, highly jointed, and filled with subsurface cavities and representing the main bedrock for engineering purposes for moderate part of El-Mokattam plateau.
c. Upper construction rock unit: It is found at the western borders of Ein El-Khaila, which is consisted of intercalations of marl and limestone with very thin of calcitic mudstone (Figure 1).
1. Gebel El-Mokattam escarpment: This escarpment representing the main bedrock for construction and engineering purposes of Basateen cemetery, which is consisting of man-made fill, Quaternary deposits of friable sands, rock fragments of limestone, and mud deposits (these deposits are outcropped at the western border of Gebel El-Mokattam. These deposits are low compacted, highly porous, and permeable (Figure 1).
2. El-Seera and El-Khaiala springs: These springs located at the western side from Basateen cemetery and are located at natural lowland areas which of sulphuric origin originated along deeps fractures, faults crossing Eocene succession as per CEHM [5].
Chemical Analysis
Three water samples were taken and analyzed, the first one from El-Khaiala Spring, Second from drinking network water sources, and the third sample from the drained water at the cemetery area. Water samples were analyzed using Atomic Absorption instrument as shown in Table 1.
| Item | Parameters | Drain Water | El-Khaiala Spring Water | Drinking Water |
|---|---|---|---|---|
| 1 | Zn (ppm) | 0.00494 | 0.0425 | 0.075 |
| 2 | Fe (ppm) | 0.005 | 0.0771 | 0.0128 |
| 3 | Mn (ppm) | 0.0482 | 0.5278 | 0.0457 |
| 4 | Mg (ppm) | 873.75 | 2900 | 25.74 |
| 5 | Na (ppm) | 8562.5 | 24500 | 48.75 |
| 6 | K (ppm) | 433.75 | 1187.5 | 11.7 |
| 7 | PH | 7.52 | 6.95 | 6.91 |
| 8 | PO4 (ug/L) | N. D. | 60 | N. D. |
| 9 | Al-kalinity as CaCO3 | 0.3 | 3.2 | 1.7 |
| 10 | Sulphates as Sulphide (mg/L) | 1320.58 | 1837.25 | 11.32 |
| 11 | TDS (ppm) | 15.2 | 48.2 | 0.225 |
| 12 | Conductivity (S/m) | 24.5 | 80.5 | 0.335 |
Table 1: Data of chemical analysis of water samples (CEHM, 1995).
By investigating the values of the chemical analysis of the water samples showed, the main source of drain water at the Basateen cemetery area originated from El-Khaiala Spring, where the concentrations of the sulphates of the drain water sample is 1320.58 and for El-Khaiala Spring is 1837.25, while for drinking water is 11.32 mg/L.
Geophysical Data Acquisition
Electrical resistivity data
A total of 3 VES's were measured (Figure 2) using the instrument SYSCAL-R2, with Schlumberger array of maximum current electrode spacing (AB/2) 150 m. The data was acquired with a high degree of accuracy by six points per decade, number of stacks of 10 times on, aligned along the available sides of the cemetery area.
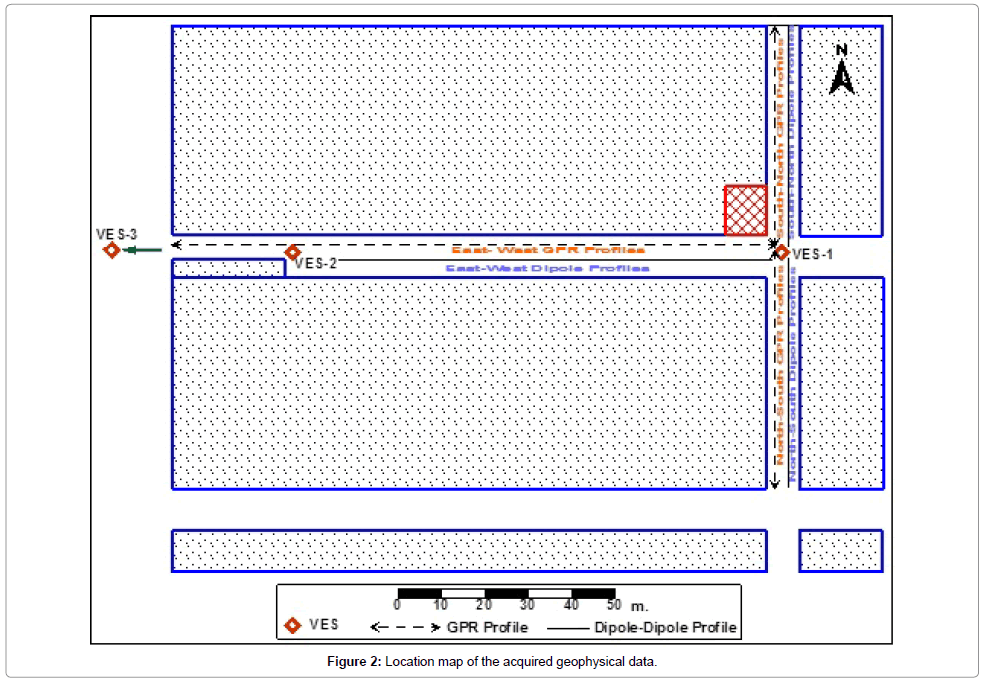
Figure 2: Location map of the acquired geophysical data.
Dipole-dipole imaging
The typical setup for a 2-D survey with a number of electrodes along a straight line attached to a multi-core cable. Normally a constant spacing between adjacent electrodes is applied. A total of nine 2-D Dipole-Dipole resistivity profiles were acquired around the studied site (Figure 2).
Ground Penetrating Radar (GPR) data
Figure 2 showing the location of the conducted GPR profiles. The survey was carried out using Mala geoscience (Ramac2-GPR) equipment with 100- and 200- MHz antenna. Georadar data were collected with a 1, 0.6 m antenna gap for the 100- and 200- MHz, respectively. The triggering factor was based on time and 512 vertical stacks, and the transmitting and receiving antennae were positioned in transversal orientation to the profile direction in order to guarantee maximum coupling between the transmitted and the received signals [6-8].
A total of 6 GPR profiles are measured as shown in Figure 2, with a dual antenna RAMAC/GPR system operating at 100- and 200- MHz (unshielded) antennae with 36 stacking for each trace. Prior interpretation, all GPR traces are processed to attenuate the associated cultural noises, especially those affecting the unshielded antennae and to enhance the S/N ratio [6,9]. The data is processed using the traditional filters to recover the energy lost through absorption due to saturation of subsurface materials, such as, linear and exponential gain and depth conversion using the velocity of 0.11 m/ns, also a three scan moving average filter was applied to the data and resulted in horizontal smoothing.
Results And Interpretations
The geoelectrical resistivity data are interpreted quantitatively and qualitatively as well as ground penetrating radar data.
Geoelectrical vertical resistivity sounding data
The approach utilized in the interpretation of the available vertical electrical soundings of the study area, as acquired through Schlumberger configuration, depend on a number of steps arranged sequentially. First, the electrical noises superimposed on the field curve are removed using an adequate filter operator to leave this curve in a smoothed form, as shown by Ghosh [10], Secondly, the process of matching the smoothed field curve with the standard curves of the auxiliary method is based on a higher degree of fitting regarding the curve parameters, as illustrated by Marsden and Mooney et al. [11,12]. Thirdly, the process of defining the depths of the existing boundaries between each two consecutive beds and the repetition of this operation for a limited number of layers, as explained by Patella [13]. Fourthly, the carrying out the aforementioned steps by a computer interpretation package is performed, as expressed by Johansen [14]. Finally, the extension of this analytic technique for any number of layers constituting the evaluated section (N-layers) is accomplished through the accumulation of the layers, as explained by Szaraniec [15].
Consequently, the acquired vertical electrical soundings of the studied area were analyzed in terms of layers of certain actual resistivities and well-defined depths for the upper and lower surfaces of the encountered beds. The conducted three soundings were illustrated in Figure 3, where the following is the description of the acquired VES's through the studied site:
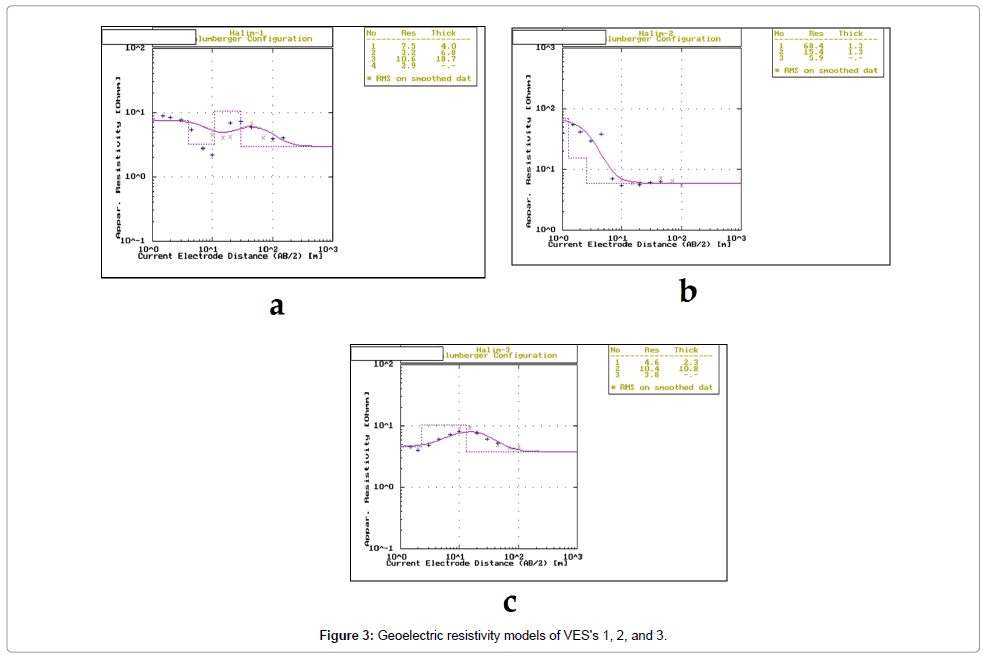
Figure 3: Geoelectric resistivity models of VES's 1, 2, and 3.
• First layer: It is of true resistivity ranging between 4.6-68.4O.m, and of thickness 1.3-4 m, which can be represented by manmade fills, sands, and rock fragments.
• Second layer: It is of true resistivity 10.4-15.4O.m, of thickness 1.3-10.8 m, which can be represented by muddy deposits.
• Third layer: It is of true resistivity 2.9-5.9O.m, extended to the maximum penetrated depth of about 30 m, which can be represented by highly saturated deposits.
The areal distribution of the true resistivity of the third saturated layer throughout the studied site showing the true resistivity was about of 2 .m and reaches to about 5.9 O.m around the boundary of the studied site, in which these lower values of true resistivities can be interpreted by the increase of the water content.
Dipole-dipole resistivity imaging
The geoelectrical profiling field data, in the form of resistivity imaging, are processed with RES2DINV computer program, which is automatically designed to construct two-dimensional resistivity models of the subsurface [16]. The nine surveyed geoelectrical profiles (Figure 2) were conducted around the studied grave by a unit electrode spacing of 3, 7, and 10 meters, as shown in Figures 4-6.
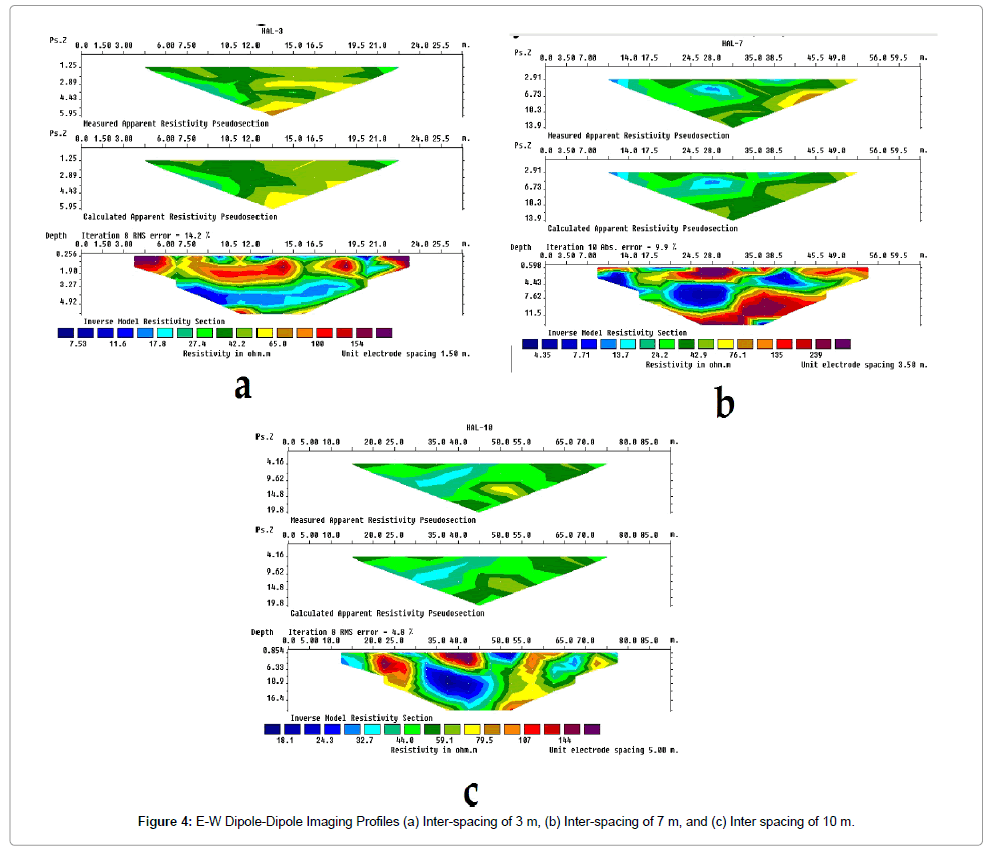
Figure 4: E-W Dipole-Dipole Imaging Profiles (a) Inter-spacing of 3 m, (b) Inter-spacing of 7 m, and (c) Inter spacing of 10 m.
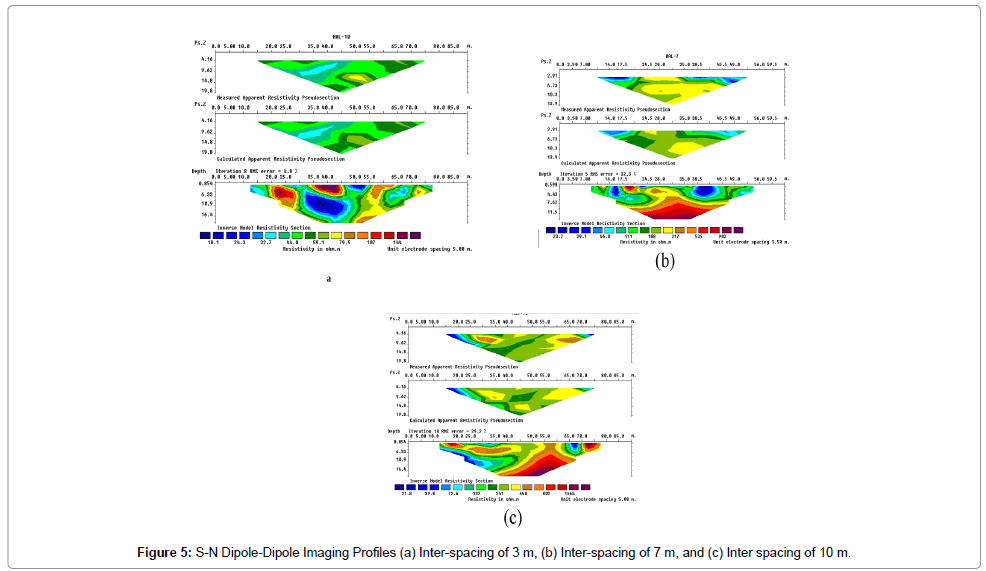
Figure 5: S-N Dipole-Dipole Imaging Profiles (a) Inter-spacing of 3 m, (b) Inter-spacing of 7 m, and (c) Inter spacing of 10 m.
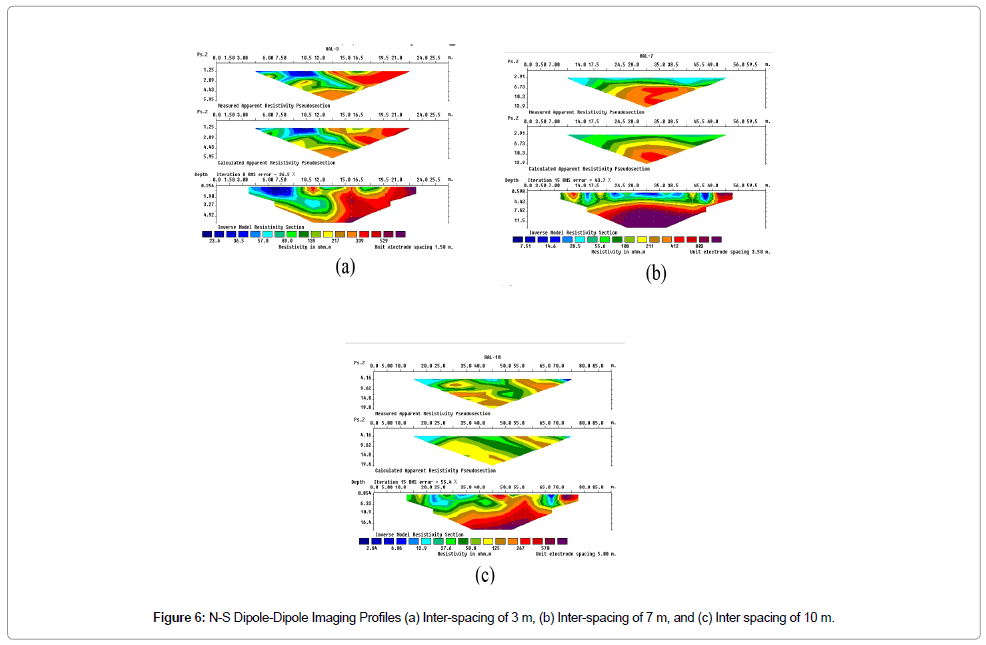
Figure 6: N-S Dipole-Dipole Imaging Profiles (a) Inter-spacing of 3 m, (b) Inter-spacing of 7 m, and (c) Inter spacing of 10 m.
The inspection of these geoelectrical profiles, of different interspacing of 3, 7, and 10 meters, indicates the presence of three geoelectrical layers with each one has a characteristic range of resistivity values as following:
• A surface low resistivity geoelectrical layer ranging from 7 to more than 15 O.m. occurs as a discrete layer of an average thickness of about 0.5 m.
• A moderate resistivity geoelectrical layer ranging from 65 to more than 150 O.m. occurs as a discrete layer of an average thickness of 3 m.
• A low resistivity geoelectrical layer has a low resistivity value ranges from 7 to 14 O.m. It occurs at the middle of the three geoelectrical profiles, which is equivalent to the more saturated layers of depth about 4 m.
• A high resistivity geoelectrical layer has a high resistivity value ranges from 75 to 240 O.m. It occurs at the bottom of the three geoelectrical profiles, and represents the base layer of these profiles, and extends to more than 15 m.
GPR profiles
The conducted GPR profiles around the studied site (Figure 3), with a total lengths 256 meters, by 100 MHz antenna (Time Window = 420 ns) and applying the velocity of soil of 0.11 m/ns (the maximum penetrable depth is about 22 m). As shown in Figure 7, there are three distinctive subsurface layers, (1) the first layer of a thickness of about 0.8 m which corresponds to the surface exposed layer that consists of weathered materials, (2) a second layer of a thickness of about 3.2 m corresponds to intercalations of muddy limestone, (3) third layer represented on the section by a strong reflector that corresponds to highly saturated deposits, which the saturation masking and covering up the reflectors. Also, the 200- MHz profile (Figure 8) at this direction reveals the same previous conclusion with a high resolution of reflectors.
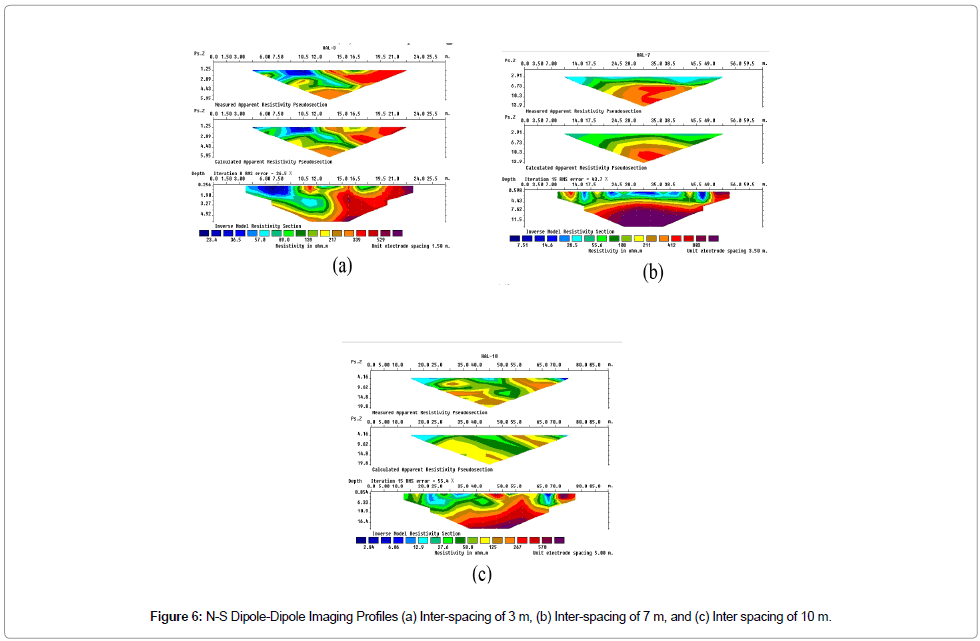
Figure 7: East-West GPR profile of 100- MHz antenna.
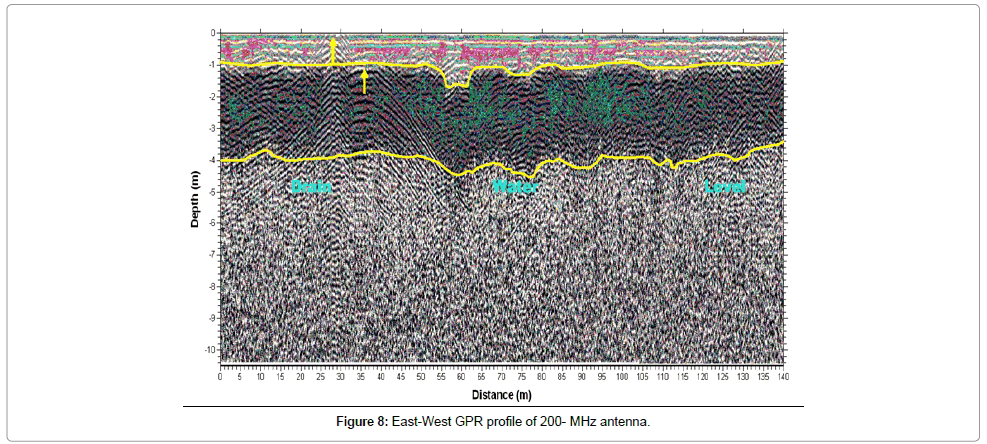
Figure 8: East-West GPR profile of 200- MHz antenna.
Discussion
Vertical electrical resistivity sounding, imaging and GPR are nondestructive practical surface geophysical methods for imaging these hydrogeological features and environmental problems, especially to a depth of about 20 meters in the arid environment at El-Basateen cemetery area, south Cairo. Changes in the resistivity can correlate with changes in water and moisture content as well as changes in lithology. Areas of high water content (high degree of saturation) are easily clarified at the geoelectrical resistivity results that formulated by VES's and imaging forms.
Conclusion
The outcome of the 1-D and 2-D resistivity field measurements and interpretations revealed the presence of four geo-electrical layers:
• Surface layer
It is of variable true resistivity and of thickness about 4 m, which can be represented by man-made fills, sands, and rock fragments.
• Second layer
It is of low true resistivity and of thickness about 5 m, which can be represented by muddy deposits?
• Third layer
It is of moderate true resistivity and of thickness about 16 m, which can be represented by highly compacted sand and gravel deposits.
• Fourth layer
It is of low true resistivity and extended to the maximum penetrated depth of about 30 m, which can be represented by highly saturated deposits.
Also, the higher degree of saturations is reflected on the acquired GPR profiles through the studied site, along and around the building. So, Resistivity and GPR techniques reveals out a clear picture of saturation along/around the studied grave. Which, can be summarized by some factors, such as, (1) the studied grave is located at the moderate topographic zone, (2) path of the infiltrated drain water from Ein El- Seera is toward the cemetery area, and (3) increasing the muddy deposits on the subsurface geologic layering sequence.
References
- Humphreys GL, Linford JG, West SM (1990) Application of geophysics to the reclamation of saline farmland in Western Australia, Society of Exploration Geophysicists. Geotechnical and environmental geophysics, Environmental and groundwater 2: 175-186
- Griffiths DH, Barker RD (1993) Two-dimensional resistivity imaging and modelling in areas of complex geology. Journal of Applied Geophysics 29: 211-226
- Swartz JH (1937) Resistivity studies of some salt water boundaries in the Hawaiian Islands. Trans Am Geophysics Union 18: 387-393
- Tellam JH, Lloyd JW, Walters M (1985) The morphology of a saline groundwater body: its investigation, description and possible explanation. J Hydrology 83: 1-21
- CEHM (1995) Geological, geophysical, and chemical studies of Basateen Cemetery Area., Internal Report.
- Annan AP (1992) Ground penetrating radar workshop notes. Sensors and Softwares Inc., Missassauga, ON, Canada.
- Annan AP, Cosway SW (2002) Ground penetrating radar survey design. Proceedings of the Symposium on the Application of Geophysics to Engineering and Environmental Problems (SAGEEP '92)", Apr. 26-29, Oakbrook, IL, USA. pp: 329-352.
- Versteeg R (1996) Optimization of GPR acquisition and noise elimination parameters. Proceedings of the Sixth International Conference on Ground Penetrating Radar (GPR '96). Sendai, Japan. pp: 289-292.
- Davis JL, Annan AP (1989) Ground penetrating radar for high resolution mapping of soil and rock stratigraphy. Geophysical Prospecting 37: 531-551
- Ghosh DP (1971) The application of linear filter theory to the direct interpretation of geoelectrical resistivity sounding measurements. Geophys Prosp 19: 192-217
- Marsden D (1973) The automatic fitting of a resistivity sounding by a geometrical progression of depth. Geophys Prosp 21: 266-280
- Mooney HM, Orellana E, Pickett H, Tornheim L (1966) A resistivity computation method for layered earth models. Geophys Prosp 31: 192-203
- Patella D (1975) A numerical computation procedure for the direct interpretation of geoelectrical soundings. Geophys Prosp 23: 335-362
- Johansen HK (1977) A man/computer interpretation system for resistivity soundings over a horizontally stratified earth. Geophys Prosp 25: 667-691
- Szaraniec E (1979) Direct resistivity interpretation by accumulation of layers. Geophys Prosp 27: 347-362
- Griffiths DH, Barker RD (1994) Electrical imaging in archeology. Journal of Archeology Science 21: 153-158
Citation: Morsy EA, Md. Farhat Rahman N, Md. Aziz A, Md. Qayum A, Md.Hossain I, et al. (2018) Applying of High-Resolution Geophysical Techniques for Drainage Investigations at El-Basateen Cemetery Area, Cairo, Egypt. J Earth Sci Clim Change 9: 453. DOI: 10.4172/2157-7617.1000453
Copyright: © 2018 Morsy EA, et al. This is an open-access article distributed under the terms of the Creative Commons Attribution License, which permits unrestricted use, distribution, and reproduction in any medium, provided the original author and source are credited.
Select your language of interest to view the total content in your interested language
Share This Article
Recommended Journals
Open Access Journals
Article Tools
Article Usage
- Total views: 6346
- [From(publication date): 0-2018 - Sep 28, 2025]
- Breakdown by view type
- HTML page views: 5379
- PDF downloads: 967