Assessment of Groundwater Strata by Resistivity Survey at Specific Locations in District Buner
Received: 18-Oct-2015 / Accepted Date: 04-Nov-2015 / Published Date: 14-Nov-2015 DOI: 10.4172/2157-7617.1000315
Abstract
The research study was conducted to assess the ground water strata by utilization of resistivity survey in selected locations of district Buner on the basis of accessibility. The main objectives of the study were to assess depth and thickness of groundwater strata and development of relationship between strata properties and resistivity. Four locations were selected in Hisar village, Amnawar sangara village and Amnawar mirdara village. The standard Schlumberger electrode configuration was adopted with maximum current electrode (AB/2) spacing of 300 m and potential electrode (MN/2) spacing of 20 m. The data was recorded using ABEM Terrameter SAS 4000. Analysis of data was achieved using 1X1D software having principal of conventional theory of curve matching. Various layers of different depths and thicknesses were identified. The depth of water table for Hisar village site-1 was 35 m with respect to ground surface; 30 m in Hisar village site-2 is shallowest one with respect to ground surface in all four locations and the deepest one in Amnawar sangara village having 47 m depth with respect to ground surface. The depth of Amnawar mirdara is 44 m with respect to ground surface in permeable layers of sandy clay and sandy gravel. Relationship of strata and resistivity was developed on the basis of resistivity values and strata were selected from standard table of geological materials. The predicted data was also compared with existing well logs for calibration and validation which was in good match. The major strata predicted in Hisar village were clay, sand clay, sand and gravel and lateritic. In Amnawar sangara and Amnawar mirdara villages the dominant media was sand and gravel while clay, sand stone and lateritic soil was also observed. Study should be conducted in water scarce areas with low water table areas to save huge amount of labor, energy and time.
Keywords: Groundwater strata; Resistivity; Terrameter
9491Introduction
Agriculture is the only major division of Pakistan’s economic system devoting almost 22% share to the Gross Domestic Product (GDP), and is source of producing of 45% of the overall tied up labor of the land. Though, the probable of agrarian creation and to carry further land capable of being growing crops rely on accessibility of water. Nevertheless, water is not consistency scattered both temporally and specially, droughts and floods can create severe situation. Water accessibility in Pakistan has also misplaced from 5104 m3 per capita in 1950 to about 1000 m3 per capita in 2001 [1]. As a result the state has only 21 million hectare of area under irrigation from total of about 31 million hectare of cultivable acreage reachable. Moreover, major fragment of the state situated in the baked to semi-baked weather and precipitation range is from a little of 150 mm in the south parts and more than 750 mm in the North West division of the state [2] While the crop water requirements vary from 1260 mm to 2850 mm from a variety of crop which depend on the climatic portion of the state [3]. Less precipitation quantity in contrast to high demand of crop toward water dictates the manmade use of water application in artificial way to complete the demand of crop for water and to raise various types of plants, orchards and other crops throughout the year. To confirm the availability of water for all the growing seasons, there are many dams and reservoirs being constructed by the country to deliver water for irrigation during the cropping season. The farming land acquires irrigation water from three major components i.e. Precipitation water, surface water and ground water.
Surface water
The key source of water for irrigation in country is the river Indus along with their other branches, every one among them are eternal with their sources from northern hilly areas. The sources which provides water them is seepage water as of geological materials, snow melt and the runoff resulting from by cyclic precipitations in the bounded area. The catchments land for Indus system is 970378 km2 in which nearly 55.9% i.e. 529085 km2 exists inside Pakistan. Indus basin Irrigation system (IBIS) of Pakistan is a typical and an integrated scheme due to its complexity and nature in the globe. It contains of about three key storage dams, twelve link canal, nineteen barrages for diverting water, more than 61,000 KM of prime and minor canals, 1.6 million kilometers of tertiary and field channels irrigates about 22 million hectares (Mha) Culturable Command Area (CCA) Irrigation efficiency in Pakistan is estimated to be 40% as the water diverted for meeting the demand of crops for water which is about 50.5 BCM. The canal supplies are insufficient for irrigation purposes due to the reason of their failure in conveyance losses and application losses, hence about 61% of the total demand of crop for water is met by supply of water via various network of canal, 25% are accomplish from water acquired from underground sources while about 16% are met with the help of Precipitation [4].
Ground water
The Indus valley includes an amount of about 30 to 31 M ha of area to be able for growing various types of crops. This territory is containing sand and alluvium deposits up to a considerable depth. Water is captured and reserves in these alluvium deposits usually in a liberated environment. So these ground water storages and scarcity situations, increase in speed of installation of people owned tube wells since 90’s to 2000’s and onward has increase with rate of 61% in Punjab, 11% in Sindh, 59% in KPK and 44% in Baluchistan. According to department of Food, Agriculture and Livestock management of Pakistan, Islamabad, the total number of private tube wells in the state is expected to be round about 1 million [3]. A notable fraction of the irrigated region in the state is also completely dependent on the water acquired form subsurface or is irrigated by conjunctive use of groundwater with exterior water supply. In numerous areas of the Grand Canal where surface water supplies are inadequate, irrigation through groundwater quality is lower due to the reduction of groundwater resources over the crisis in secondary salinization [5]. Even with major development in the sector of modern discipline and knowledge, no such worth mentioning transformation achievement has been made in the sector of establishing tube wells in the country. At this instant, this is the era to include recent expertise and skills for the purpose of using groundwater in a best and good way. Now a days, the drilling operations for tube well setting up are still implemented by grown up manual boring plants, powered wench machines excluding few power drilling rigs. After initial work accomplished, rest of the tasks from the setting up to installation of machinery is carried out mainly with the help of estimation and guess work or realistic knowledge of traditional workers or a few experts and old staff of the government organizations. In this situations, the utilization of latest EM tools and strategies such as resistivity surveys and other latest techniques can lead to initiate the technique of drilling with more precision and in an effective way which can reduce the expenses millions of capital in setting up of primary wells. So the resistivity survey method is an efficient tool for the study of groundwater resources for various reasons which can assist to change bore holes into dynamic wells with utilization of recent and latest technique. The proposed study was conducted to assess depth and thickness of groundwater strata and develop relationship between resistivity and strata properties by using resistivity survey.
Materials and Methods
Sites selection
The sites for the proposed study were chosen at different locations in District Buner where the resistivity survey was conducted in accordance with desired objectives. Four sites were selected for this purpose. The survey was conducted and the data acquired was interpreted to get the desire results. Furthermore the relationship between the resistivity and strata properties was developed. The groundwater contour lines were drawn in accordance with the co-ordinates acquired through the use of Global Positioning System (GPS).
Hydrogeological parameters
Groundwater is identified on the basis of some parameters on which surface geophysical measurements indirectly but some time directly depends. Those parameters are transmissivity, porosity and conductivity. The occurrence and movement of groundwater depend upon the subsurface characteristics such as Lithology structure and texture.
The surface resistivity method can give an idea about the presence of water in underground strata with taking the following properties of the strata [6].
1. There will be no water in dry sand and hard rocks which have no fractures and no pores spaces with high resistivity.
2. Medium and coarse sand or fractured rock bearing free water has a resistivity which depends on the resistivity of water and on the porosity of rock.
3. An impervious clay layer, which has bound water, has a low resistivity Table 1.
| Name of Area District Buner | Name of site surveyed village | Latitude | Longitude |
|---|---|---|---|
| Buner | Hisar-1 | 343252.2N | 723030.0E |
| Buner | Hisar-2 | 343308.1N | 0722954.1E |
| Buner | Amnawarsangara | 343141.1N | 723323.1E |
| Buner | AmnawarMirdara | 343152.1N | 723252.6E |
Table 1: List of the Locations Surveyed.
Instrument Used
The Terrameter SAS 4000 ABEM was used for the field data collection. This instrument measures and displays the resistance of the subsurface strata’s over a number of cycles.
Equipments
The equipment includes Terrameter, 2 measuring tapes, 2 large wire (A - B), 2 small wire (M - N), Data forms, 10 metallic electrodes, 2 hammers, Calculator Connecting and cables.
Geoelectrical vertical resistivity survey
In Geoelectrical resistivity survey, two electrodes are placed on the ground surface at a distance from each other and generating an electric current between them, cause an electrical field to spread into the earth around them. The center point of the electrode array remains fixed but spacing of the electrodes is increased and information from deeper sections of the subsurface can be recovered. The electrical field enters more deeply into the subsurface layers when the current electrodes are farthest from each other rather than they are relatively closer together. By calculating the difference in potentials between the two electrodes within that induced electrical field, the resistance of the earth can be measured. Continuously larger spacing of the current electrodes allows deeper penetration of the electrical field for detailed investigation of subsurface strata. This practice of taking frequent measurements over a single center while moving the current electrodes outward by steps is referred to as resistivity survey. The potential was measured as the current was induced via current electrodes and the difference was noted at potential electrodes so the numeric values were recorded for each set of electrodes and for each contour in different sites. The instrument, used to measure electrical resistivity measurements in the research area, was DC Terrameter SAS 4000 ABEM; the instrument is owned by the Department of Water Management, The University of Agriculture Peshawar, Pakistan.
Electrode configuration
Different types of spread geometries and electrodes configurations are available such as Wenner electrode configuration, Schlumberger electrode configuration, Pole-Dipole array and Dipole-Dipole array etc, which can be chosen depending on the acceptable precision and availability of the labor. Though, both Schlumberger and Wenner electrode configuration methods are popularly used, the Schlumberger electrode configuration method is more suited to the study area for guaranteeing better results. The method has practical, functioning and interpretational advantages over other methods such as the Wenner Pole-Dipole and Wenner Schlumberger method of electrode arrangement (Zohdy et al. [7]). Therefore, Schlumberger Electrode Configuration was used in the study because it was less laborious and provides good resolution of horizontal layer and good depth sensitivity.
In case of Schlumberger array, the electrodes are placed in a straight line equally about the central point. The outer two electrodes A and B were used for current and the resulting potential difference was measured across the two inner electrodes M and N. The distance of the current and potential electrodes from the center is referred as AB/2 and MN/2 respectively, which characterizes the array. MN/2 is always kept sufficiently small relative to AB/2. The average potential gradient measured between M and N is a close estimation to the potential gradient at the center of the array (Lashkaripour, 2005). Only the current electrodes are moved outwards about a station after each reading in Schlumberger configuration. As a result the current penetrates deeper and deeper; the resistance being measured each time the current electrodes are moved outward (Figure 1).
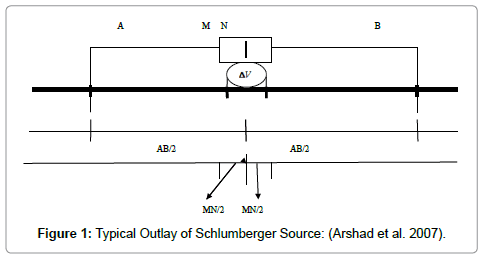
Figure 1: Typical Outlay of Schlumberger Source: (Arshad et al. 2007).
Where the equation of apparent resistivity for schlumberger electrode configuration is given below.
? = K. R (3.1)
Where ? is the apparent resistivity and K is the constant representing the geometric factor which vary with respect to depth having the following mathematical expression
K = π (AB/2)2 – (MN/2)2 / MN (3.2)
The π is a mathematical constant equal to 3.14, AB/2 is the half spacing of current electrode (m), MN/2 is the half spacing of potential electrode (m) and MN is the total spacing of potential electrode (m).
Interpretation of survey data using 1X1D software
The resistivity values calculated from the measurement was explored by 1D inversion technique software (1X1D interrex, USA). By produce the resistivity model by fitting the acquired field data with least root mean square error between the synthetic data generated from the model and the real data themselves. Another Model named Surfer was also used for mapping of underground Lithology which yields 3D views of strata.
Groundwater modeling
The research study was conducted in selected sites of Buner using Terrameter SAS 1000/4000 along with other accessories as GPS and Measuring Tape. The research study objectives were achieved through the following operational activities.
Depth and thickness of groundwater strata using resistivity survey
The depth and thickness of groundwater strata was determined using Terrameter SAS 1000/4000 along a straight line of set positions through designed survey procedure. This set procedure includes measured distances for placing potential and current electrodes at suitable distances in both directions from the instrument while the GPS for the same potential and electrode positions was used for collecting the co-ordinates of the points where the data was acquired. The simple Schlumberger electrode configuration was followed for electrode configuration and the subsurface resistivity values were measured for different depths as the spacing of electrode was varied to investigate deeper depths in reality, the earth is heterogeneous and an-isotropic, so there is no hard and fixed rule/formula between electrode spacing and the effective current infiltration depth. But there is a common rule of thumb to say that the depth of exploration is of the order of 0.1 to 0.3 times the AB spacing [6]. For the given positions under consideration different resistivity values were noted as per existence of varied strata these values were then interpreted as transformed values after using 1X1D software package. These transformed data showed the depth, thickness and groundwater strata. Specimen table is given below which show the resistivity values of some common geological materials (Table 2).
| Materials | Nominal Resistivity (?-m) |
|---|---|
| Quartz | 3 x 10² - 106 |
| Granite | 3 x 10² – 106 |
| Granite (weathered) | 30 – 500 |
| Consolidated shale | 20 – 2 x 10³ |
| Sandstones | 200 – 5000 |
| Sandstone (weathered) | 50 – 200 |
| Clays | 1 - 102 |
| Boulder clay | 15 – 35 |
| Clay (very dry) | 50 - 150 |
| Gravel (dry) | 1400 |
| Gravel saturated | 100 |
| Lateristic soil | 120 -750 |
| Dry sandy soil | 80 - 1050 |
| Sand clay/clayed sand | 30 -215 |
| Sand and gravel (saturated) | 30 – 225 |
| Mudstone | 20 – 120 |
| Siltstone | 20 -150 |
Table 2: Resistivity Values for Some Common Geological Materials (Anthony et al. 2006).
Development of relationship between resistivity and strata properties
After recording the field data in a tabulated form for the resistivity and the Lithology of the strata from the given set of positions arranged, a relationship was established. The recorded data was first analyzed and a graphical relationship was drawn to present the relationship between resistivity and strata properties (with defined boundaries) which was established using 1X1D software for each location. The strata showed the number of layers, thickness of each layer and their resistivity values.
Results and Discussion
Hydrogeological parameters
The total area of district Buner is 1865 square kilometers. Geographically, district Buner is encircled by hills on all sides and is separated from Swat by a range of mountains. Buner terrains comprise of mountains and valleys filled with deposits. The solid rocks of the mountains are mainly composed of schist in Barandee, granites in Chamla and quartzite in Badri. The hilly tracks abound with minerals which have become the vivid symbol of business in the area. Buner is accessible from the south by a metalled, steep and winding road via Totali; from west by a winding, steep and narrow road through Ambella Pass; and from the north by a reasonably good road through Karakar Pass via Barikot, fifteen kilometers behind Saidu Sharif. The climate of the district varies with the elevation and may be classified as dry subtropical. There are two distinct rainy seasons i.e. Rabi season which lasts from November to May and the Kharif monsoon lasts from July to October. Rainfall continues throughout the year and Buner receives approximately 165 centimeters of rain annually [7].
Depth and thickness of groundwater strata by using resistivity survey
The depth and thickness of groundwater strata for each location surveyed during research study is given below.
Buner village Hisar (Site 1): Figure 2 shows 25 smooth layers generated by the model for the Hisar village profile. The spread was 240 m and thus the major layers on the basis of depth and thickness calculated by the model into five layers, including the infinite layer extending beyond 160 m depth. The infinite end layer is taken as homogenous and of single property which may be due to weak signals of limited power or due to further limited placing of potential electrode spacing. So, the upper four layers identified were clay with a depth of 3.1 m, sand clay of 9.5 m, sand and gravel saturated up to depth of 34.5 m, granite (weathered) with some lateritic soil contents up to depth of 160.6 m with the thickness of 3.1 m, 6.4 m, 25 m and 126.22 m respectively. The groundwater in this location can be found at a depth of about 35 m because there was no irrigation systems and after the depth of 10 m, the soil strata was of permeable layers of sand and gravel saturated having a thickness of 25 m which can accumulate water.
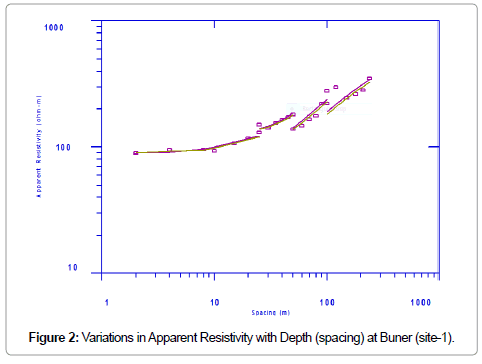
Figure 2: Variations in Apparent Resistivity with Depth (spacing) at Buner (site-1).
Buner village Hisar (site-2): The village Hisar Site 2 contains 23 smooth layers as shown in Figure 3 generated by the model for a spread of 180 m, which was converted to major layers of given depths and thicknesses, graded on the basis of resistivity values observed during the survey. These 23 layers were converted to three layers of selected depths and thickness while the fourth layer was infinite depth and thickness due to the homogenous strata of soil or due to weak signals resulted from limited placing of potential electrode within the selected profile. The major three layers identified were the surface layer of clay with a depth of 3.4 m, sand and gravel with a mixture of clay up to depth of 10.2 m, and the last identified layer up to a depth of 11.9 m was clay. The critical discrete thicknesses of these layers are 3.4 m, 6.8 m and 1.7 m respectively [8]. The high amount of water at this location can be found at depth of more than 30 m. However, some moisture contents were also observed at 11 m where the soil strata were sand and gravel favorable for water accumulation.
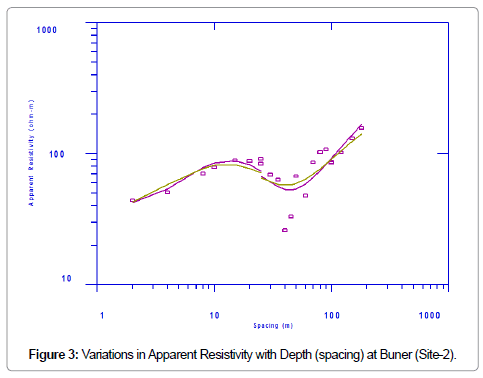
Figure 3: Variations in Apparent Resistivity with Depth (spacing) at Buner (Site-2).
Buner village Amnawar sangara (Site-3): The Buner Site-3 is shown in Figure 4 where the 1X1D model identified 27 smooth layers on the basis of the spread of 300 m. These smooth layers were simplified by the model and converted to major known layers of a given depth and thickness on the basis of resistivity values recorded during survey by the instrument with specific configuration. Four major layers were identified including the extended layer of infinite depth and thickness resulted from weak signals while the other three layers were surface cover of dry clay with depth up to 4.1 m, lateritic soil 15.2 m and sand and gravel with 113 m, while the thickness of each layer was 4.1 m, 11 m and 97.9 m respectively. The groundwater strata can be identified at more than one locations like sand and gravel with some clay [9]. So the water table identified was at depth of 47 m where the soil strata was permeable sand and gravel underlain by impermeable layer of lateritic soil.
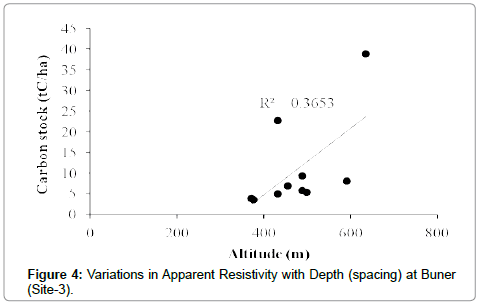
Figure 4: Variations in Apparent Resistivity with Depth (spacing) at Buner (Site-3).
Amnawar mirdara (Site-4): Figure 5 shows numerous smooth layers generated by Model 1X1D in a depth of 300 m. The models simplify these layers into known layers of thicknesses and depths which are graded on the basis of resistivity values distinguished by the instrument with a standard procedure. The numerous smooth layers identified by the model with mentioned configuration of the field survey, were converted to three major layers excluding the layer with infinite depth and thickness, the boundaries of which can be defined by the further movement of electrodes to an enlarged distance. These three major layers were sandy clay, the surface layer with a depth of 0.7 m, sand and gravel up to depth of 2.8 m and weathered sandstone up to a depth of 46.7 m. The thickness of each layer was 0.7 m, 2 m and 44 m respectively. In this location water can be found at depth of 44 m, while sand and gravel layer was followed by sandstone.
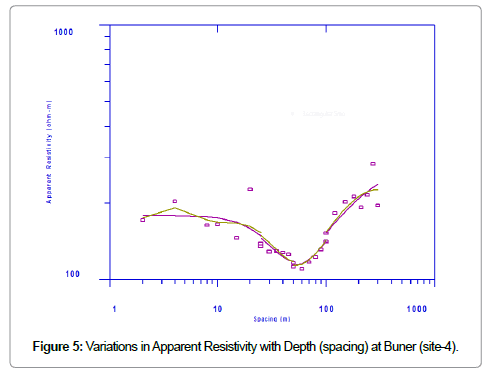
Figure 5: Variations in Apparent Resistivity with Depth (spacing) at Buner (site-4).
Details of Strata Depth and Thickness with Resistivity Values
Hisar village site-1
Table 3 shows that four major layers were calculated by the model on the basis of depth and thickness, excluding the infinite layer extending beyond 161 m depth. The upper four layers identified were clay with depth of 3.1 m, sandy clay having depth of 9.5 m, sand and gravel up to depth of 34 m and lateritic soil up to depth of 161 m with thicknesses of 3.1 m, 6.4 m, 25 m and 126.2 m respectively.
| Location | Name of layer | Thickness of layer(m) | Depth of layer(m) | Resistivity of Layer(?-m) |
|---|---|---|---|---|
| Hisar site-1 | Clay | 3.1 | 3.1 | 63 |
| Sand clay | 6.4 | 9.5 | 77 | |
| Sand and gravel | 25 | 34 | 120 | |
| Lateritic soil | 126.2 | 161 | 393 |
Table 3: Detail of strata depth and thickness with resistivity values of Hisar village site-1.were 3.4 m, 6.8 m and 1.7 m respectively.
Hisar village site-2
Table 4 of Hisar village site-2 shows that 4 layers of selected depths and thickness was calculated. The fourth layer having infinite depth and thickness while the major three layers identified were the surface layer of clay with depth of 3.4 m, sand and gravel with depth of 10.2 m and last identified layer with depth of 11.9 m was clay while the thicknesses of these layers
| Location | Name of layer | Thickness of layer(m) | Depth of layer(m) | Resistivity of Layer(?-m) |
|---|---|---|---|---|
| Hisar site-2 | Clay | 3.4 | 3.4 | 40 |
| Sand and gravel | 6.8 | 10.2 | 177 | |
| Clay | 1.7 | 11.9 | 1.7 |
Table 4: Detail of strata depth and thickness with resistivity values of Hisar value site-2.
Amnawar sangara village
Table 5 shows that major layers identified was four including the extending layer of infinite depth and thickness while the other three layers were surface cover of dry clay with depth up to 4.1 m, lateritic soil with 15.2 m and sand and gravel with 113 m depth while the thickness of each layer was 4.1 m, 11 m and 97.9 m respectively.
| Location | Name of layer | Thickness of layer(m) | Depth of layer(m) | Resistivity of Layer(Ω-m) |
|---|---|---|---|---|
| Amnawarsangara | Clay(dry) | 4.1 | 4.1 | 56 |
| Lateritic soil | 11 | 15.2 | 129 | |
| Sand and gravel | 98 | 113 | 187 |
Table 5: Details of strata depth and thickness with resistivity values of Amnawar sangara village.
Amnawar mirdara village
Table 6 shows that major layers identified were four including the infinite depth and thickness and the three major layers were sandy clay with depth of 0.7 m, sand and gravel with depth of 2.8 m and sandstone with depth of 46.7 m. The thickness of each layer was 0.7 m, 2 m and 44 m respectively.
| Location | Name of Layer | Thickness of Layer (m) | Depth of Layer (m) | Resistivity of Layer (Ω-m) |
|---|---|---|---|---|
| Amnawarmirdara | Clayed sand | 0.7 | 0.7 | 156 |
| sand and gravel | 2 | 2.8 | 216 | |
| Sandstone | 44 | 46.7 | 145 |
Table 6: Details of strata depth and thickness with resistivity values of Amnawar mirdara village.
Conclusions and Recommendations
The research study was designed to achieve the assigned objectives mentioned above which were achieved successfully as the results were cross checked with existing bore-holes logs and were matched up to good agreement. The technique is very helpful for estimation of groundwater strata and estimation of subsurface layers. The shallow values of water table was at Hisar village site-2 (30 m with respect to ground surface) Hisar village site-1 (35 m with respect to ground surface) while the deep water table calculated was at Amnawar sangara village (47 m with respect to ground surface) and Amnawar mirdara village (44 m with respect to groundwater), the water bearing strata calculated at all of the locations was sand and gravel with some clay components in small amount. Different type of subsurface strata was identified at various locations where the dominant strata were sand and gravel, clay, sandy clay, sand stone and some lateritic soil. Among the above mentioned strata the sand and gravel with clay was dominant in all selected locations in the study area. The geophysical tools used for exploration of ground water table give accurate result in less time as compared to other methods. There should be a dense survey in the whole region to identify more sites of highest groundwater elevation applying other electrode configurations. Instead of natural surface flow and seepage, there should be some storage in the permeable zone or open dug wells towards in usual reservoir. Study should be conducted in water scarce areas with low water table to save huge amount of labor, energy and time.
References
- WRI (2001) World Resources. People and Ecosystems: the fraying web of life, World Res. Ins. (WRI), Washington DC.
- Bakhsh A, Awan QA(2002) Water issues in Pakistan and their remedies. National Symposium on Drought and Water Resource in Pakistan, CEWRE, University of Engineering and Technology Lahore. Pp 145-150.
- MINFAL (2008) Agric Stat Pak Ministry of Food Agric. & Livestock, (Economic Wing), Isl.
- UN-PAK (2001) Thematic group on rural development and food security. The United Nations System in Pakistan. Publication No.UN-PAK-2000:1.
- Sarwar A,Eggers H (2006) Development of a conjunctive use model to evaluate alternative management options for surface and groundwater resources. Hyd J 12:233-236.
- Bernard J(2003) Short notes on the principles of geophysical methods for groundwater investigations. Pp 236-239.
- Zohdy A, Eaton GP,Mabey DR(1974) Application of surface geophysics to ground-water investigations: Techniques of Water-Resources Investigations of the United States. Geo Survey 2: 116.
- Lashkaripour GR, Nakhaei M(2005)Geoelectrical investigation for assessment of groundwater conditions: a case study. Ann Geophys 48:937-944.
- Bernard J(2003) Short notes on the principles of geophysical methods for groundwater investigations. Pp 236-239.
Citation: ullah Z, Junaid M, Ullah R (2015) Assessment of Groundwater Strata by Resistivity Survey at Specific Locations in District Buner. J Earth Sci Clim Change. 6: 315. DOI: 10.4172/2157-7617.1000315
Copyright: © 2015 ullah Z, et al. This is an open-access article distributed under the terms of the Creative Commons Attribution License, which permits unrestricted use, distribution, and reproduction in any medium, provided the original author and source are credited.
Select your language of interest to view the total content in your interested language
Share This Article
Recommended Journals
Open Access Journals
Article Tools
Article Usage
- Total views: 13922
- [From(publication date): 12-2015 - Aug 20, 2025]
- Breakdown by view type
- HTML page views: 12862
- PDF downloads: 1060