Assessment of the Reliability of World Weather Online Forecasts for Kadoma Community
Received: 02-Jul-2015 / Accepted Date: 14-Aug-2015 / Published Date: 24-Aug-2015 DOI: 10.4172/2157-7617.1000291
Abstract
In recent times weather related catastrophes have become a commonplace. Many weather forecasters have taken the lead in furnishing individuals, corporate and governments with information. Consequently, little has been done to verify the accuracy of the weather reports and forecasts. This study therefore, compared and assessed the accuracy of forecasts given by World Weather Online with those of Meteorological Services Department for the case of Kadoma in Zimbabwe. The study also investigated the extent to which people benefit from using weather information as well as the challenges faced in accessing this information. Both quantitative and qualitative methods were used to gather data. Internet data mining, questionnaire and interview were used. Temperature and rainfall data were statistically analyzed while benefits and challenges were qualitatively assessed. The WWO forecasts for minimum temperatures had an accuracy of 96% while those for maximum temperature had an accuracy of 91.4% (percentage error of 8.6%). Rainfall forecasts showed a percentage correct of 60% and 56.7% for MSD and 70% and 66.7% for WWO for one day and twoday lead times, respectively. The researcher therefore recommended that the MSD defragment its regions into smaller areas to increase accuracy of forecasts. Awareness campaigns by all stakeholders were also seen as necessary in fostering understanding of weather reports and forecasts by the all people.
Keywords: Meteorological services; Reports; Weather forecasting; Weather; World weather online
11754Introduction
Weather forecasting has been practiced since human civilization. Today humans largely depend on weather information to aid in their decision making. According to Muchetu (2014), most activities done by people particularly outdoor activities have to be done with weather in mind. Globally 2014 has been the hottest year since 1891. The information is important as weather can affect human health [1]. The damaging effects include floods, heat waves and droughts while in Zimbabwe most adverse effects are related to rainfall [2]. However, weather forecasts provide early warning information which assists in alleviating these adverse impacts.
Weather forecasting helps in agricultural planning. Agriinfo (2011) write that weather forecasting is of cruitial importance in agriculture as it allows farmers to plan ahead and put in place measures to deal with shortage of rainfall. Farm operations like sowing, application of fertilizer, irrigating, harvesting and transport are done with weather in mind. Hague (2010) also points out that farmers can reduce the effects of droughts by engaging in water conservation activities like water harvesting and mulching. Growing of small grains has also been identified as another strategy to cope with unreliable rainfall. These strategies are only possible in light of weather forecast information. Since the bulk of Zimbabwe’s population is agro based, it then means livelihoods are at stake in the face of hunger [3]. Farmers can also prepare such mechanisms as freeze prevention method if warned in time [4]. The forecasts can provide advance information so that farmers can adjust critical agricultural decisions, thereby improving efficiency, and enabling them to adopt the most suitable coping strategy, according to Mudombi and Nhamo [5].
The major challenge with developing countries is that of lagging behind in technology. Communication is a challenge because people do not have access to proper communication services. In Zimbabwe some areas are not well served with radio, television and cell network coverage. The people in such areas have little access to weather information. In Seke and Murewa districts of Zimbabwe, a study by Mudombi and Nhamo [5] indicates that about 65% in Murewa and 52% in Seke had access to seasonal rainfall forecasts while the majority did not have access to timely weather forecasts and early warnings. In Kadoma people have felt the wrath of adverse weather. Floods droughts hail, lightning and strong winds have portrayed a negative image of weather.
Falling trees, structures and power lines cause severe damage to life and property. Surprisingly, these damages can be reduced or avoided by taking heed of weather reportsand forecasts. The AGRITEX has given warnings and advices to farmers on what crops to grow. The MSD has also given continuous weather forecasts to individuals corporate, the government and nongovernmental organizations as well as members of the public. The government has set structures which include instatement of the Civil Protection Unit to encourage members of the public to pay special attention on disaster management information such as weather reports and forecasts to avoid and reduce loss of life and property. Despite all these efforts by various stakeholders, adverse weather continues to wreak havoc to communities. It is against this background that the researcher set to investigate the accuracy of weather forecasts as well as identify benefit and challenges faced by the people of Kadoma in accessing weather information.
Kadoma is endowed with a number of natural resources namely fertile arable soils, gold nickel, platinum, wildlife and beautiful scenery. Exploitation of these resources has resulted in the area being recognized in field of agriculture, mining and tourism. All these activities require constant up-to-date, accurate and reliable weather information. With the advent of electronic communication technologies a lot of weather information (observations and forecasts) about this community are availed in various media. Different weather information providers provide varying information at the same time for the same place. According to Floehr [6] some providers like Unisys, Weather for You, Accuweather [7], Intellicast, Weather.com, My Forecast and BBC among others, provide free data. These have a comprehensive coverage of the world such that the majority covers the entire world. There is little information on the accuracy of these weather reports and forecasts for Kadoma and Zimbabwe as a whole. This has prompted the researcher to select World Weather Online and MSD among the rest and investigate the reliability of their forecasts for Kadoma community. The researcher has also observed that some people do not use weather information because they do not have access to such information or they do not know the benefits of using such information. This study set to expose the benefits of using weather information and the challenges faced in accessing such information.
Study Area
The study was carried out in Kadoma town in Mash-West Province of Zimbabwe and it is located some 133 km South West of Harare. The town of Kadoma is situated on the Highveld and is a few kilometers to northwest of the main watershed, say UNIDO [8]. The general relief in the area is 1000m above sea level with occasional hills rising above 1250 m altitude (Figure 1). Geologically the area is an anticline consisting of Basaltic Greenstones. The area, as is the case with most of the country, has a tropical climate according to ClimaTemps [9].
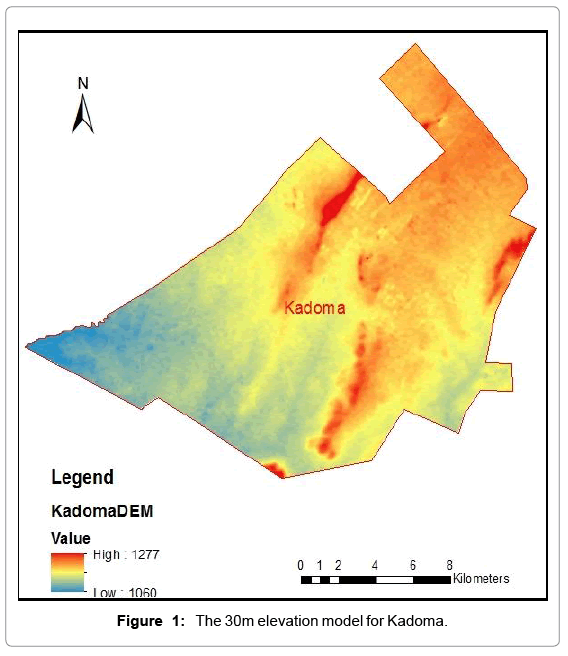
Figure 1: The 30m elevation model for Kadoma.
The area has one distinct wet season (November-March) which is characterized by short convectional thunderstorms and drizzle. Maximum atmospheric temperatures are experienced in October while lowest in June and July. It has a population of around 74,200 people (Trip Suggest, [10]). The town belongs to the natural region 3 with mean annual rainfall of 697 mm [9]. Mining and agriculture constitute the greatest share of economic activities done here.
Data Collection Procedure
Weather forecasts for a period of 30 days from 14 January 2015 were collected from the Meteorological Services Department of Zimbabwe as well as from World Weather Online (World Weather Online, 2015) in order to compare the two with observed rainfall. The period of January to February was chosen as it represents trends during the peak of the rainfall season which spans from January to March. Observed rainfall data for the period for Kadoma were obtained from the Meteorological Services Department at a daily resolution. A Meteorological day was considered to run from 8 am on one to 8am the next day. The researcher found it necessary to capture people’s opinions concerning their weather information sources and their views on benefits enjoyed from using weather information. These data were obtained in the field using questionnaires after pre-testing was done to ascertain the clarity of the questionnaire. The researcher obtained details about challenges encountered during a focus groups discussion which mainly looked for information about access to and uses of weather information as well as challenges faced in accessing the required weather information in Kadoma.
Data Analysis Procedure
The observed daily rainfall amounts were tabulated against corresponding MSD and WWO forecasts for lead times of one and two days. This was done for rainfall, minimum and maximum temperatures. The contingent tables [11] were used to compare rainfall forecasts with observations. The accuracies of rainfall forecasts were assessed using the Hansen-Kuipers Score (HKS) and percentage correct (PC) [12] as:
 (1)
(1)
Where CHA is calculated as:
 (2)
(2)
 (3)
(3)
Where A, B, C, and D are as illustrated on the table in Table 1.
| Forecast | |||
|---|---|---|---|
| Rain | No rain | ||
| Rain | A | B | |
| Observed | No rain | C | D |
Table 1: Structure of contingent table used to assess rainfall forecasts.
The contingent tables were used to compare rainfall forecasts with observations. On the other hand, Floehr [13] calculated forecast errors and squared the result for 1, 2, 3 and 4 day forecasts. In this lead times of 1 day and 2 days were considered. A graphical comparison was made between actual observations by MSD and forecasts by WWO for each of the 30 days. MSD observations and WWO forecasts for both maximum and minimum temperatures were compared separately. Percentage Error (PE) was calculated using the equation:
 (4)
(4)
Where a is the actual observation, f is the forecast and n is the number of observations. Data about sources of weather information, benefits and challenges with weather information were obtained from questionnaires. Responses on sources and benefits were coded and presented by way of pie chart for further deductions. Data on challenges faced in accessing weather information was described narratively.
Comparison of world weather online forecasts with observations in kadoma
The biggest disagreement between World Weather Online and ground observations was 5°C recorded on the 28th of January (Figure 2). World Weather Online predicted no change in temperature from 9 to 13 January while the temperatures increased from 9 to 11 January and decreased from 11 to 13 January. However, in most of the cases the patterns were in tandem. The differences were mostly minor as indicated by a percentage error of 4.0% in the WWO maximum temperature forecast. Minimum temperatures differed by 2°C on average (Figure 3). Largest difference was observed on the 24th where they differed by 5°C. World Weather Watch mostly over-estimated minimum temperatures as evidenced higher values of the forecast than observed temperatures during the period. The accuracy of the World Weather Online minimum temperature forecasts was lower than that of maximum temperature. The percentage error was found to be 8.6% implying an accuracy of 91.4%.
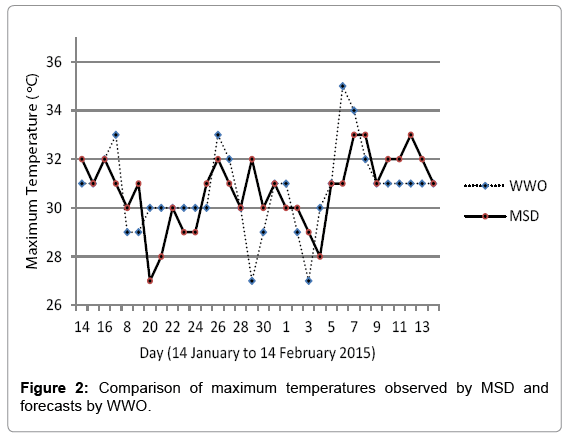
Figure 2: Comparison of maximum temperatures observed by MSD and forecasts by WWO.
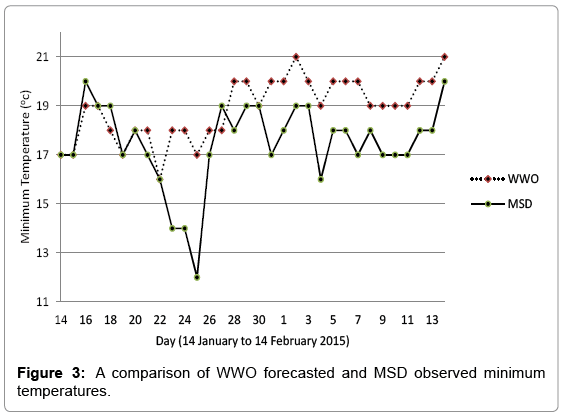
Figure 3: A comparison of WWO forecasted and MSD observed minimum temperatures.
Accuracy of Rainfall Forecasts
Table 2 shows how MSD forecasts compared with observed rainfall figures at one day lead time. From this contingency table (Table 2) Hanssen-Kuipers and percentage correct were calculated. The Hanssen- Kuipers Skill Score was 0.36 and percentage correct was 60%.
| Forecast | ||||
|---|---|---|---|---|
| Rain | No rain | Total | ||
| observed | Rain | 14 | 11 | 25 |
| No rain | 1 | 4 | 5 | |
| Total | 15 | 15 | 30 | |
Table 2: MSD observed versus forecast rainfall with lead time of 1 day.
The one day forecasts by World Weather Watch gave Hanssen Kuiper’s Skill Score of 0.37. The Percentage Correct from this table was 70%, slightly higher than that for MSD rainfall forecasts (Table 3). At a two day lead time Meteorological Services Department had a Hanssen- Kuiper’s Skill Score of 0.08 and a Percentage Correct of 56.7% (Table 4). The Hanssen-Kuiper’s Skill Score was 0.09 and percentage correct was 66.7% for World Weather Online forecasts at lead time of 2 days.
| Forecast | ||||
|---|---|---|---|---|
| Rain | No rain | Total | ||
| observed | Rain | 15 | 1 | 16 |
| No rain | 8 | 6 | 14 | |
| Total | 23 | 7 | 30 | |
Table 3: World Weather Online observed versus forecast rainfall lead time of one day.
| Forecast | ||||
|---|---|---|---|---|
| Rain | No rain | Total | ||
| observed | Rain | 14 | 2 | 16 |
| No rain | 11 | 3 | 14 | |
| Total | 25 | 5 | 30 | |
Table 4: MSD observed versus forecast rainfall 2 days in advance.
Users of Weather Information
Of the respondents to which the questionnaires were administered, 40% confirmed no knowledge of any use of weather information while 60% indicated that they used weather information. The findings show that the majority of respondents used weather information with the major sources being national television and radio stations (Table 5). Some had their sources not included on the questionnaire presented on Figure 4 as “Other”.
| Forecast | ||||
|---|---|---|---|---|
| Rain | No rain | Total | ||
| observed | Rain | 14 | 2 | 16 |
| No rain | 8 | 6 | 14 | |
| Total | 22 | 8 | 30 | |
Table 5: World Weather Online observed versus forecast rainfall 2 days in advance.
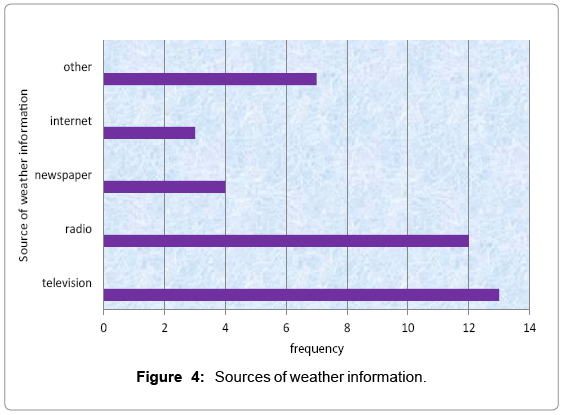
Figure 4: Sources of weather information.
The study discovered that most people preferred television and radio. Others indicated that they favored TV because of more detail contained in weather reports and forecasts as compared to other media. The other reasons cited were that no additional costs are incurred on TV and radio unlike with internet, newspaper and other media which are not convenient to users. Employed respondents were comfortable with many sources and had access to free internet services offered by employees. However, some of the employed expressed limited knowledge about online access to weather information.
Challenges in Accessing Weather Information
In this section challenges are summarized from what respondents expressed during focus group discussions. Some respondents showed that they faced problems of power cuts and failed to get weather reports due to intermittent nature of power supply in urban areas. Other areas were poorly served with radio and television networks a problem also cited in Mudombi and Nhamo [5]. In some cases people lacked computer literacy in order to benefit from such technologies where they are available. Due to low incomes and unemployment amidst loads of commitments most users do not afford access weather information at a cost. The other challenges included poor understanding of the weather terminology particularly those from television. One indicated that the term ‘outlook’ was a problem because it did not match their vocabulary.
Benefits of Using Weather Information
The majority of the respondents reiterated the need to plan for various activities with weather in mind. Some do their businesses but are affected by bad weather because people’s buying behavior was greatly influenced by weather. Sellers of refreshments strongly indicated that they need to know weather in order to know how much to stock and supply to the market. Others showed the need to prepare for each season. Farmers stressed their desire for adequate weather information as it influenced the type of crop to grow, timing of planting and harvesting as well as the amount of fertilizer to be bought each season. Farmers of perishable products such as horticulturist also pointed out that their sales depend on the seasonal forecasts. During bad times they indicated little sales but with bigger returns as there will be limited supply. The findings are summarized in Figure 5.
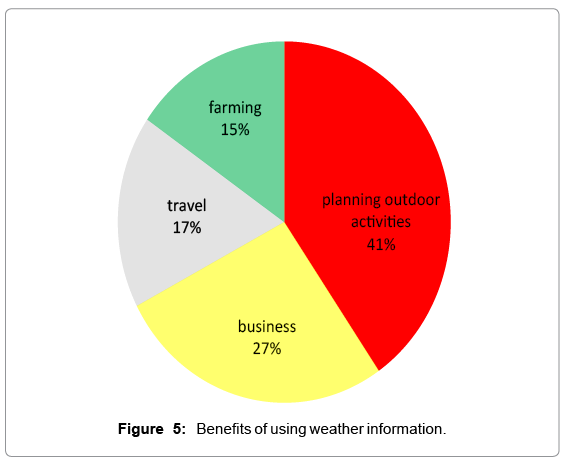
Figure 5: Benefits of using weather information.
Discussion
The study observed that both maximum and minimum temperature observations by World Weather Online and MSD were not the same. They did not intersect in the majority of the days recorded. World Weather Online and MSD had their rainfall recordings showing a big anomaly. World Weather Online deviated greatly from actual observations by MSD. Some days which were dry were reported as having received moderate amounts of rain. As a result World Weather Online had a wet bias in their observations. WUWT [14] supports this by adding that the same global forecast models produce different result when run on different computers. The reason point to increasing mathematical uncertainty from initial starting conditions as well as differences in the way CPUs, operating systems and compilers work [14,15]. The accuracy assessment conducted revealed that one day forecasts differed from two-day forecasts with regards to their accuracy levels. Forecast accuracy often decreased with an increase in the number of days in advance [13]. This holds true for WWO minimum temperature forecasts. MSD maximum and minimum temperature forecasts improved at a lead time of two days. This is supported by the observation of Keevallik et al. [11] that forecasts for periods of 48 hours are very accurate but beyond that time forecasts deteriorate. Persistence method of forecasting can yield good results for such short periods. The MSD also used absolute forecasts at one day lead time while two day forecasts were given in terciles. Short range forecasts were a bit accurate when compared to medium and long-range forecasts. This is congruent to what this study found out. Using the Percentage correct it was concluded that one-day in advance forecasts were slightly lower than two days in advance forecasts. World Weather Online and MSD comparison yielded the conclusion that World Weather Online was better though there was a slight difference in both categories of forecasts. World Weather Online recorded 67% and 70% while MSD recorded 57%and 60% in lead times of one and two days respectively. The challenges unearthed in this study were based on the availability of communication resources. The people who need weather information were constrained by limited access to the internet, radio and television broadcasts because their areas were poorly served with such networks. The other issue is related to technology assimilation. Some of the respondents showed that they did not know how to use latest computer technology to access weather information. Another inhibitor is lack of finance to buy the above mentioned technologies and pay for their services. This led the people to prefer radio and television since these have little operating costs. Mudombi and Nhamo [5] also observed radio and television were among major sources of weather information. However, a study carried out in the UK showed that radio and television were less accessed than web-based sources and direct consultations with weather service providers. The study also found that the users of weather information benefited from making informed decisions about their routine jobs, lifetime and leisure activities. It has been noted that using weather information serves life in the face of weather hazards. In the long term it benefited farmers as they were able to grow crops that matched each season [16]. As a result the effects of weather extremes were minimized. Business people in the urban centers were also able to stock their ware in accordance with probable weather demands. As a result they were able to stay afloat in business due to use of weather information.
Conclusion
The study discovered that World Weather Online forecasts are reliable in Kadoma. Forecasts for temperature were more accurate than those for rainfall and this can be due to the popular high spatial variability exhibited by rainfall. Using the percentage correct showed that World Weather Online rainfall forecasts were better than MSD in both one-day and two-day rainfall forecasts for the period considered. However, the Hanssen-Kuipers scores showed negligible differences. The study revealed that users of weather information face some challenges in accessing which include lack of knowledge, resources and connectivity to communication networks. The benefits enjoyed range from saving life to some more economic benefits which come with the use of weather information. Although sources such as World Weather online provide reliable forecasts, they are not accessed by most users in Kadoma. Users in Kadoma mostly preferred forecasts issued using national radio and television broadcasters. However, there is need to train the users on terminology used as well as raising their awareness on accessing other sources of this vital information.
Recommendations
1) In light of the conclusions made in the study, it is recommended that:
2) The Civil Protection Unit and other stakeholders should educate people on importance of weather information use.
3) Post and Telecommunications Regulatory Authority of Zimbabwe (POTRAZ) should continue with efforts to install communication towers to increase access to communication media and educate people on how to use certain communication technologies
4) People need to be made aware of the accuracy levels of the weather information supplied by various weather information providers.
5) The Meteorological Services Department should reduce the sizes of its forecast area as they are currently too broad and general.
References
- Hughes S, Bellis MA, Bird W, Ashton JR (2004)Weather Forecasting as a Public Health Tool.Center for public health 65: 3.
- Mushore TD (2013) Uptake of seasonal rainfall forecasts in Zimbabwe. J Environ Sci Toxicol Food Technol 5: 31-37.
- Mawere M, Madziwa BF, Mabeza CM (2013) Climate change and adaptation in Africa. IntJ Humanities Soc Stud 1: 14-21.
- https://www.nasa.gov/press/2015/january/nasa-spinoff-2015-features-space-technology-making-life-better-on-earth
- Mudombi S, Nhamo G (2014) Access to Weather Forecasting and Early Warning Information by Communal Farmers in Seke and Murewa Districts Zimbabwe.J Hum Ecol48: 357-366.
- Floehr E (2003) Results of Large-Scale Weather Forecast Study of Major Internet Weather Forecast Providers.
- Keevallik S, Spirina N, Sula E, Vau I (2014) Statistics of different public forecast products of temperature and precipitation in Estonia. Proceedings of the Estonian Academy of Sciences63: 174-182.
- http://www.wmo.int/pages/prog/hwrp/documents/FFI/expert/Guidelines_on_Performance_Assessment_of_Public_Weather_Services.pdf
- Anthony W (2013)Another uncertainty for climate models - different results on different computers using the same code. WUWT.
- Knorthern K (2013) Same programs differe nt computers different forecasts
- Stenemann AC (2006) Using Climate Forecasts for Drought Management. J Applied Meteorol Climatol 45.
Citation: Terence DM, Emmanuel M, Tichaona Z, Nation M (2015) Assessment of the Reliability of World Weather Online Forecasts for Kadoma Community 6: 291. DOI: 10.4172/2157-7617.1000291
Copyright: © 2015 Terence DM, et al. This is an open-access article distributed under the terms of the Creative Commons Attribution License, which permits unrestricted use, distribution, and reproduction in any medium, provided the original author and source are credited.
Select your language of interest to view the total content in your interested language
Share This Article
Recommended Journals
Open Access Journals
Article Tools
Article Usage
- Total views: 22027
- [From(publication date): 8-2015 - Aug 30, 2025]
- Breakdown by view type
- HTML page views: 17278
- PDF downloads: 4749