Assessment of Traffic-Generated Gaseous and Particulate Matter Emissions of Hirpora Wildlife Sanctuary (Shopian), Jammu and Kashmir, India
Received: 14-Sep-2017 / Accepted Date: 20-Nov-2017 / Published Date: 24-Nov-2017 DOI: 10.4172/2157-7617.1000421
Abstract
Construction of famous Mughal road running through Hirpora wildlife Sanctuary, Shopian has resulted in tremendous increase in the number of motor vehicles, which run on different types of fuels. The vehicular traffic is now recognized as one of the main sources of air pollution in Sanctuary and has noticeable impact on air quality. Emissions have been estimated using emission factor and activity based approach recommended by IPCC. The highest concentration of pollutants by different vehicles was recorded in summer (June) which can be attributed to the high vehicular load due to the tourist rush whereas the lowest was recorded in early winter (November). The present observation revealed that the highest emission of criteria pollutants (CO2, CO, NO, SO2, and PM) was emitted by four-wheeler direct injection diesel vehicles (DI) excepting one i.e. carbon monoxide (CO) emitted by four-wheeler gasoline vehicles (4WG). The high emission of pollutants in the summer season (June, July, August) might cause more negative effect to the plants and trees especially to the road side vegetation as compared to early winter season (September, October, November). The number of vehicles was recorded highest in the month of June and lowest was recorded in the month of November. Visiting of the vehicles to the site must be allowed in certain limit in order to keep the fragility of the sanctuary into consideration. The traffic authorities should check the PUC certificate of vehicles before entering the state.
Keywords: Vehicular emission; Pollutants; Wildlife sanctuary; Hirpora; Air quality
Introduction
Transport increases the development goals of a region. The basic infrastructures required for the region’s economic growth are roads, railways, water and air connectivity. In recent times, with the increase in economic activities, the consumption of fossil fuel based energy sources and consequent green-house gas (GHG) emissions have shown increased trend. The transport sector in India consumes about 16.9% (36.5 mtoe: million tons of oil equivalent) of total energy (217 mtoe in 2005-2006). Various energy sources used in this sector are coal, diesel, petroleum (gasoline) and electricity. Road, rail and air are responsible for emission of 80%, 13% and 6% respectively [1]. In India, vehicular emissions account for about 60% of the greenhouse gases from various activities [2]. Vehicular pollution, contributed about 72% towards total air pollution load in Delhi, [3] which was only 23% In 1970-1971 [4]. Vehicular pollution, contributed about 72% towards total air pollution load in Delhi [3] which was only 23% In 1970-1971 [4]. Motor vehicle emissions are composed of the by-product that comes out of the exhaust systems or other emissions such as gasoline evaporation. Automotive vehicles emit several pollutants depending upon the type of quality of the fuel consumed by them. These emissions contribute to air pollution. The large majority of today's cars and trucks travel by using internal combustion engines that burn gasoline or other fossil fuels. The process of burning gasoline to power cars and trucks contributes to air pollution by releasing a variety of emissions into the atmosphere. Emissions that are released directly into the atmosphere from the tailpipes of cars and trucks are the primary source of vehicular pollution. Primary pollution from motor vehicles is pollution that is emitted directly into the atmosphere, whereas secondary pollution results from chemical reactions between pollutants after they have been released into the air.
Regional impact of air pollution on different local plant species is one of the major ecological issues. The climatic conditions, the physico-chemical properties of air pollutants and their residence time in the atmosphere have the impact on surrounding environment. Rapidly increasing number of vehicles and urbanization in Jammu and Kashmir is an alarming threat to our ecosystem. It might not only affect the air environment but will also disturb other ecosystems as well. In the state of Jammu and Kashmir, the number of motor vehicles has been on the rise. The present study involves emission estimation from vehicular transport in Hirpora Wildlife Sanctuary using petroleum and diesel fuel including carbon dioxide, carbon monoxide, nitric oxide, sulfur dioxide, particulate matter. CO results from the incomplete oxidation of fuel to CO2. The most important parameter influencing CO emissions is the air-fuel ratio during engine operation. CO emissions increase with a decreasing air-fuel ratio. CO emissions are significant from gasoline engines while as CO emissions from diesel engines are minimal. The sulfur is oxidized during the combustion process to produce SO2. A fraction of SO2 is oxidized to sulfur trioxide (SO3) which combines with water to form a sulfuric acid aerosol. Gasoline fuel has a negligible amount of sulfur; therefore, SO2 is not computed for gasoline vehicles. Diesel fuel in India contains sulfur between 0.05 and 0.5%. SO2 emissions increase with fuel consumption as all the sulfur in the fuel is assumed to have oxidized in the combustion process. NO is formed during combustion as the high flame temperature breaks down molecular oxygen and nitrogen of the inducted air, which then recombine to form NO. Reactions forming NO are temperature dependent, and, hence, NO emissions are relatively low during engine start-and warm-up phases. The present study was taken to investigate the concentration of different pollutants released from vehicles in Hirpora Wildlife Sanctuary.
Materials And Methods
Study area details
The present study was carried out in forest ecosystem of Hirpora Wildlife Sanctuary (Shopian). It is located in Shopian district of Kashmir, 70 km South of Srinagar at an around 33°39’ 55" N latitude and 74°39’ 40" E longitude at an altitude of 2546 m above mean sea level (Figure 1 and 2). It is bounded to the north by Lake Gumsar, northeast by Hirpora village, to the east by Rupri, to the south by Saransar and to the west by the Pir Panjal pass. This sanctuary was established in 1987 and its total area is 341.25 km2, beautified by forests, pastures, scrub land, waste land and water bodies [5]. The climatic conditions of the Hirpora are somehow different from Kashmir valley. The highest day temperature goes to 27°C in summers and the winters are chilly with heavy snowfall.
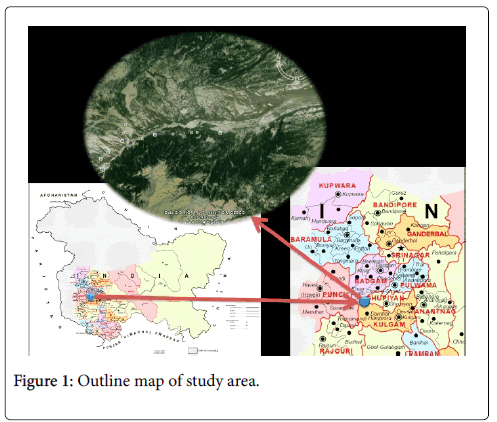
Figure 1: Outline map of study area.
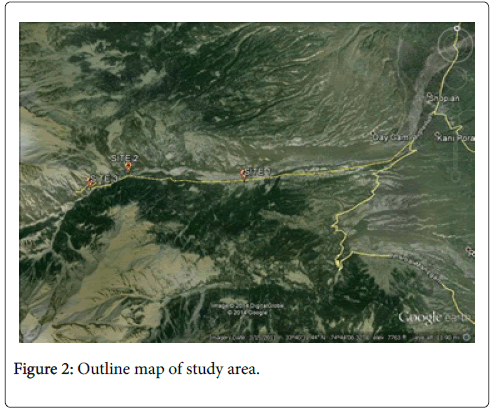
Figure 2: Outline map of study area.
Methodology
The vehicular pollution analysis required handling of extensive amount of data. The following parameters were used for the study of the vehicular pollution and emission estimation.
Survey
Survey regarding the type and number of vehicles passing to and fro in the Hirpora Wild Life Sanctuary was conducted by observing and recording the same for a particular span of time during every sampling. A stretch of road (10 km) was selected for this study between Hirpora village and Sokh Sarai. The total number of vehicles passing to and fro through this segment under different categories viz. twowheeler, four-wheeler gasoline, four-wheeler diesel and heavy-duty diesel vehicles was calculated. The readings were taken for eight hours at three different points (Hirpora village, Dabjan and Sokh Sarai) for a day during the months of June to November 2013. The average number of vehicles passing through this segment monthly was also calculated.
Classification of vehicles
A broad classification of vehicles for the purpose of emission inventory was made as:
1. Two-wheeler
2. Four-wheeler gasoline
3. Four-wheeler diesel:
4. (a) Direct injection of fuel (Passenger cars)
5. (b) Indirect injection of fuel (Jeeps and Light commercial vehicles)
6. Heavy duty diesel (Buses and Trucks)
Vehicle population
The number of vehicles ranged from 720 to 24,508 as shown in Figure 3. The lowest number was recorded in the month of November by two-wheeler (2W) vehicles and the highest number was recorded in the month of June by four-wheeler diesel (DI) vehicles. Mean monthly variation in total number of vehicles was recorded lowest (2540) in the month of November and the highest (10205) was recorded in the month of June. So far, as the summer season is concerned, the vehicular traffic load was recorded to be the highest during the summer season due to the fact, that the sanctuary attracts a large number of tourists visiting the sanctuary and other places along Mughal road. The type and average traffic volume on the road (10 km stretch) varies widely with time and space and hence, variation in the emission of pollutants.

Figure 3: Monthly variation in number of different vehicles from June-November 2013.
Quantification of emission
Emissions from road were quantified based on the number of vehicles and distance travelled in a year per different vehicle type, which is given by
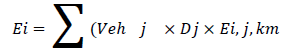
Where, Ei=Emission of compound (i); Vehj=Number of vehicles per type (j); Dj=Distance travelled in a year per different vehicle type (j); Ei,j,km=Emission of compound (i) from vehicle type (j) per driven kilometer.
Emission factors
An emissions factor is a representative value that attempts to relate the quantity of a pollutant released to the atmosphere with an activity associated with the release of that pollutant. These factors are usually expressed as the weight of pollutant divided by a unit weight, volume, distance, or duration of the activity emitting the pollutant [6] (U.S. EPA in 2009). Vehicular emissions vary with the age of the vehicle, its type, efficiency and type of fuel used. Emission Factors (Ei, j, km) of different types of vehicles are compiled from previous studies and regulatory agencies [6-11].
Results and Discussion
The present study of vehicular pollution in Hirpora Wildlife sanctuary was carried out to determine the concentration of vehicular pollutants indifferent months from June to November 2013. The results obtained from Hirpora Wildlife Sanctuary are detailed in Figure 4. The monthly variation in number of different vehicles. Figure 5 shows the monthly variation in emitted substances during the period of six months from June to November 2013. Total contribution of motor vehicles i.e. two-wheeler, four-wheeler gasoline, four-wheeler diesel (direct injection and indirect injection of fuel) and heavy-duty diesel vehicles (Buses and Trucks) to carbon dioxide, carbon monoxide, nitric oxide, sulfur dioxide, particulate matter and soot were calculated and quantified in Kg for 10 km stretch.
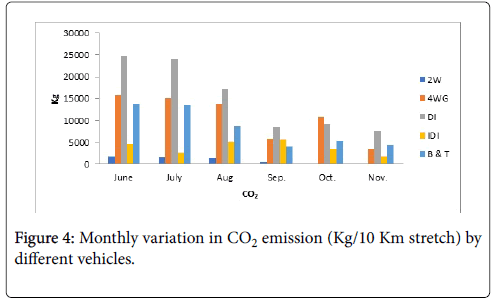
Figure 4: Monthly variation in CO2 emission (Kg/10 Km stretch) by different vehicles.
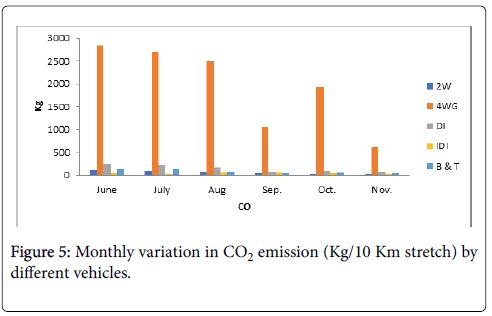
Figure 5: Monthly variation in CO2 emission (Kg/10 Km stretch) by different vehicles.
The Carbon dioxide (CO2) emission ranged from 137.808 Kg to 24776.117 Kg as shown in Figures 4 and 5. The lowest was recorded in the month of November by two-wheeler vehicles and the highest was recorded in the month of June by four-wheeler diesel (DI) vehicles during the present study. The Carbon monoxide (CO) emission ranged from 8.769 Kg to 2847.333 Kg as shown in Figure 6. The lowest was recorded in the month of November by two-wheeler vehicles and the highest was recorded in the month of June by four-wheeler gasoline vehicles. The sulfur dioxide emission ranged from 19.50 Kg to 1,215.351 Kg as shown in Figure 7. The lowest was recorded in the month of September by heavy duty diesel vehicles (B and T) and the highest was recorded in the month of June by four-wheeler diesel (DI).
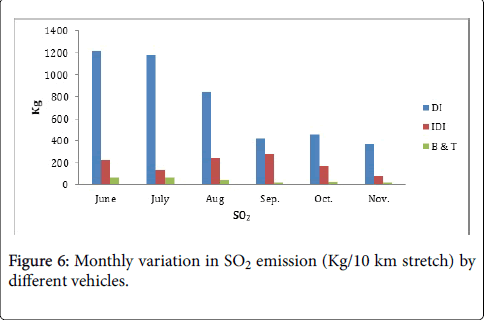
Figure 6: Monthly variation in SO2 emission (Kg/10 km stretch) by different vehicles.
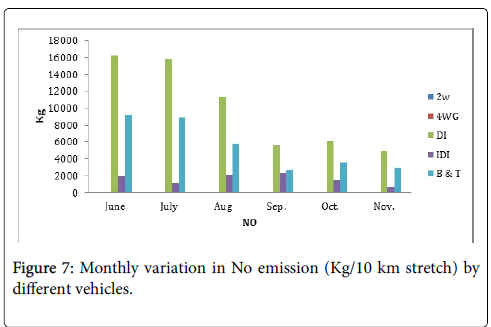
Figure 7: Monthly variation in No emission (Kg/10 km stretch) by different vehicles.
The Nitric oxide emission ranged from 5.011 Kg to 1,6268.655 Kg as shown in Figure 8. The lowest was recorded in the month of November by two-wheeler vehicles and the highest was recorded in the month of June by four-wheeler diesel (DI) vehicles. The particulate matter emission ranged from 10.806 kg to 170.575 Kg as shown in Figure 8. The lowest was recorded the month of November by four-wheeler diesel (IDI) vehicles and the highest was recorded in the month of June by four-wheeler diesel (DI) vehicles.
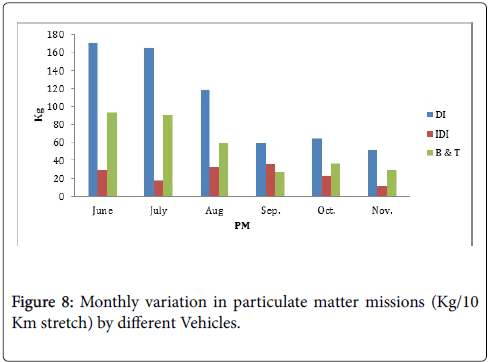
Figure 8: Monthly variation in particulate matter missions (Kg/10 Km stretch) by different Vehicles.
CO2 is formed when the fuel is completely burnt. Generally speaking diesel is long chain compound than petrol and they are heavier (hexanes). It means that they have more number of carbon atoms. More the carbon atoms more is CO2 emission. But Diesel engine emits lesser CO2 per Km travelled.
CO2 emissions from present work were higher than the values reported by Goel and Guttikunda [12] and probably higher traffic volume and emission factor resulted in higher emissions in present work. Due to same reason our NOx emission was 3 times higher than values reported by Goel and Guttikunda [12]. CO is formed when the fuel doesn't burn completely. This is due to insufficient air present to completely burn the fuel. CO emission is common in petrol engine as it always operates close to stoichiometric conditions. While diesel engines are lean burn engines hence the chance of % of CO emission from diesel engine is less compared to CO. HC is any hydrocarbon which appears as un burnt fuel. This can be due to lesser amount of O2, incomplete mixing of fuel or lesser lapse time for the fuel to burn. Both petrol and diesel engine have considerable CO emissions. NOx it forms when nitrogen reacts with O2 at elevated temperatures. Diesel engine has higher Cylinder temperature as they have higher peak pressure. At such a high temperature, more nitrogen from the air compresses and reacts with oxygen in the combustion chamber of four-wheeler diesel (DI) vehicles and thus produces more NOx [13].
The different types of vehicles showed monthly variations in the emissions of gaseous and particulate matter i.e. carbon dioxide, carbon monoxide, nitric oxide, sulfur dioxide, and particulate matter. This is because due to the variation in growth of vehicles, fuel type and difference in atmospheric temperature. The number of vehicles ranged from 720 to 24,508. The lowest number was recorded in the month of November by two-wheeler (2W) vehicles and the highest number was recorded in the month of June by four-wheeler diesel (DI) vehicles.
Conclusion
From the above discussion, it has been found that the highest emission of pollutants was emitted by four-wheeler direct injection diesel vehicles (DI) excepting one i.e. carbon monoxide (CO) emitted by four-wheeler gasoline vehicles (4WG). Perusal of the data revealed that the high emission of pollutants in the summer season might cause more negative effect to the plants and trees especially to the road side vegetation as compared to early winter season. Therefore, visiting of the vehicles to the site must be allowed in certain limit in order to keep the fragility of the sanctuary into consideration. The traffic authorities should check the PUC certificate of vehicles before entering the country. Indigenous plant species which are broad leaved and more efficient in absorbing the vehicular emissions need to be planted alongside the road to mitigate the effects of pollution. Government should implement the stringent laws of Motor Vehicle Act, 1988 for the conservation of Hirpora Wildlife Sanctuary.
Acknowledgements
The authors are highly thankful to Head, Department of Environmental Science of S.P. College Srinagar, for providing necessary facilities and support.
References
- Teddy (2006) Teri Energy Data Directory and Yearbook, 2005-06. Tata Energy Research Institute, New Delhi, India.
- Patankar P (1991) Urban transport in India in distress. Central Institute of Road Transport, Pune, India.
- Goel R, Guttikunda SK, Mohan D, Tiwari G (2015) Benchmarking vehicle and passenger travel characteristics in Delhi for on-road emissions analysis. Travel Behav Soc 2: 88-101.
- CPCB (Central Pollution Control Board) (2001) Transport fuel quality for the year 2005, PROBES/78/2000-01, Parivesh Bhavan, New Delhi, India.
- Ahmad F, Hassan Z, Farooq S, Shah JA (2015) Assessment of land use/land cover change in Hirpora Wildlife Sanctuary, Kashmir. Asian J Earth Sci 8: 6473.
- U.S. EPA (U.S. Environmental Protection Agency) (2009) Emissions Factors and AP 42, Compilation of Air Pollutant Emission Factors, http://www.epa.gov/ttnchie1/ap42/
- UNEP (1999) Environmental impacts of trade liberalization and policies for sustainable management of natural resources: A case study on India’s automobile sector. United Nations, New York and Geneva.
- Kandlikar M, Ramachandran G (2000) The causes and consequences of particulate air pollution in urban India: A synthesis of the science. Ann Rev Energy Environment 25: 629-684.
- EEA (European Environment Agency) (2001) Joint EMEP/CORINAIR Atmospheric Emission Inventory Guidebook, (3rd edn), European Environment Agency, Copenhagen, Denmark.
- Mittal ML, Sharma C (2003) Anthropogenic emissions from energy activities in India: Generation and source characterization (Part II: Emissions from vehicular transport in India), United States Agency for International Development, Washington DC, USA.
- ARAI (The Automotive Research Association of India) (2007) Emission factor development for Indian vehicles, air quality monitoring project-indian clean air programme New Delhi, 89.
- CPCB (Central Pollution Control Board) (2010) Air Quality Monitoring, Emission Inventory and Source Apportionment Study for Indian Cities, New Delhi, 658 pages.
- Ravindra K, Wauters E, Tyagi SK, Mor S, Van Grieken R (2006) Assessment of air quality after the implementation of compressed natural gas (CNG) as fuel in public transport in Delhi, India. Environ Monitor Assess 115: 405-417.
Citation: Rasool S, Qadri H, Bhat FA (2017) Assessment of Traffic-Generated Gaseous and Particulate Matter Emissions of Hirpora Wildlife Sanctuary (Shopian), Jammu and Kashmir, India. J Earth Sci Clim Change 8: 421. DOI: 10.4172/2157-7617.1000421
Copyright: ©2017 Rasool S, et al. This is an open-access article distributed under the terms of the Creative Commons Attribution License, which permits unrestricted use, distribution, and reproduction in any medium, provided the original author and source are credited
Select your language of interest to view the total content in your interested language
Share This Article
Recommended Journals
Open Access Journals
Article Tools
Article Usage
- Total views: 6336
- [From(publication date): 0-2017 - Nov 28, 2025]
- Breakdown by view type
- HTML page views: 5289
- PDF downloads: 1047