Assessment of Water Availability under Climate Change Scenarios in Thailand
Received: 27-Jan-2014 / Accepted Date: 17-Feb-2014 / Published Date: 19-Feb-2014 DOI: 10.4172/2157-7617.1000184
Abstract
This paper investigates the potential impact of climate change on future water availability in Thailand. For this study, entire country was divided into nine Hydrological Response Units (HRUs) and the hydrological modeling was performed by Hydrologic Engineering Center’s Hydrologic Modeling System (HEC-HMS) for each HRU using the future decadal climate data obtained from the Regional Climate Model (RCM) named Providing Regional Climates for Impact Studies (PRECIS) which was further bias corrected by using ratio method for two emission scenarios A2 and B2. The simulation shows that the water availability in the future decades at the different HRUs varies for the dry and wet season. In case of dry season, the coastal HRUs show a decline in water availability in the near future then tending to increase to the similar amount as of current situation in the late part of century. However, in case of wet season all the HRUs shows an increasing trend of water availability in future. Nonetheless, considering the whole country for dry season the water availability is expected to be decreased in the early part of the century followed by an increasing trend by the end of the century relative to current water availability for both scenarios. Similarly a univocal increasing trend of water availability is expected for wet season indicating the possibility increased frequency and intensity of floods.
Keywords: Climate change; HEC-HMS; PRECIS; Water availability; Thailand
5778Introduction
Southeast Asia is expected to be seriously affected by the impacts of climate change due to the high dependency of economy on agriculture and water resources in the region [1]. The region’s water resource is already affected by the rapid population growth, urbanization, agricultural and hydropower demand. Recent extreme events in Thailand shows it is under water crisis, and in addition the intensity of the extreme events are also expected to increase in the future [2]. Two most important problems attributed by climate change in the region are floods and droughts [3]. Flooding negatively affects the crops, livelihoods and infrastructure throughout the country whereas drought affects the crop production specifically in the Northeast region [4]. Similarly, studies show that the impact of climate change are regional and its affects are also concentrated at regional scale [5,6] although the water management policies target at national scale.
Climate change is anticipated to have significant alteration of the global water cycle through changes in temperature and precipitation [7]. The change in precipitation regime, in terms of intensity and frequency inclusive of spatial distribution has already been reported worldwide [6,8]. Contemporary studies of state of art on climate change impacts on hydrology in various watersheds in the world validate changes in the annual and seasonal pattern of flows [9-11]. The increasing demand of freshwater by virtue of factors such as population growth and land use change put the water resources under threat. Additionally, climate change has rendered its availability in the future towards more uncertainty [12].
The Third Assessment Report of the Intergovernmental Panel on Climate Change (IPCC) released in 2001 reported intensification of the global hydrological cycle with its implications on surface and groundwater resources [13]. Although several studies [14-16] have been conducted to understand the impacts on river runoff by using the advanced global hydrological models that are driven by ensembles of climate models yet the influence of climate change at national scale and its variation with basin scale is still under dilemma [17].
For the last two decades GCMs have confirmed to be an essential tool for climate change impact assessment studies [18]. Although the simulated scenarios are advisable for the regional to national scale studies, they are less suitable for basin level studies due to their coarse spatial resolution. Several techniques have been developed to overcome this issue but still there is a demand to further develop the existing methods for impact assessment studies. Bias correction has been successfully applied in many parts of world for linking GCMs and hydrological models of impact assessment [19,20]. In addition although several hydrological models are available, HEC-HMS is a versatile semi-distributed model and its performance has been accepted in many basins in the world [21,22].
Despite of the significant progress on the basin level climate change impacts assessment studies, a comprehensive study comprising of basin scale study attributing to national level water availability is necessary for Thailand. With limited adaptive capacity, the people are expected to be severely threatened by the additional influence of climate change. In order to address this issue, this paper presents the analysis of the future changes in local climate at Hydrological Response Units (HRUs) and assesses their impact on national scale water availability to help in managing water resources more efficiently and prepare necessary plans for adaptation in changing climatic conditions.
Study Area
Thailand lies within 5°37′-20°28′ north latitude and 97°21′- 105°38′east longitudes. The study includes the 25 major river basins in Thailand covering an area of approx. 513,000 km2. All major river basins were grouped into nine HRU (Hydrological Response Unit) based on the physiographic characteristics for easiness in hydrological modeling. Figure 1 shows all the HRUs considered in this study. Elevations vary from 0 to 1350 masl with higher altitudes found in the northern part of the country. Tropical wet climate dominates the country however; the south and east experience a tropical monsoon climate. The ranges of maximum and minimum temperatures are from 28-36°C and 13- 25°C respectively. Temperature varies significantly with location; higher in the plains whereas low in hills. The wet season starts with the monsoon from May to July which extends up to October to November contributing 75% of total rainfall and consecutively leaving rest part of the year dry with very low available water. Dry period extends longer in the Northeast part of the country even up to May/June. The average annual rainfall of the country is about 1,574 mm which also changes with location. The annual rainfall is about 1,200 mm in the northern mountainous region, 1,300 mm in the central plain, below 1,000 mm in the western strip of the north-east plateau and increases to 1,600 mm towards the Far East end of the north-east plateau. The east coast peninsula receives additional rainfall from the northeast monsoon during November through January and annual rainfalls of 1,800 mm and 2,500 mm are observed over the eastern and western coasts of the peninsula respectively.
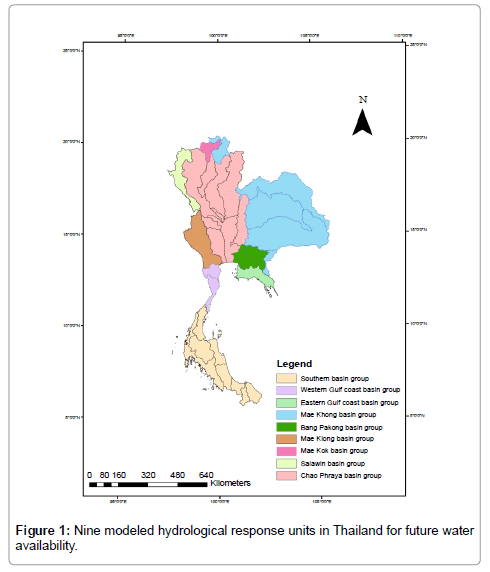
Figure 1: Nine modeled hydrological response units in Thailand for future water availability.
Methodology
Data collection
Hydro-meteorological data: Daily precipitation data of 95 meteorological stations covering the whole of Thailand were collected for the period of 1971-2010 from Thai Meteorological Department (TMD). The distribution of the numbers of stations from the basins was done based on the area of the HRU and spatial distribution of the stations. Data collected from all stations were used for creating Thiessen polygons for determining the distribution of rainfall in the HRUs. Missing data were generated by creating linear regression models based on observed and gridded daily precipitation dataset from APHRODITE (http://www.chikyu.ac.jp/precip/). The daily river discharge data of all 25 major river basins was collected from Royal Irrigation Department (RID) for a period of 1992 – 2000. However, in order to set up the model for the 9 HRUs the river discharge of the major rivers was used.
Future climate data: Outputs of the Regional Climate Model (RCM) PRECIS developed by the Hadley Centre of the UK Meteorological Office was used for generating the future gridded climatic dataset. The PRECIS RCM is based on the atmospheric components of the ECHAM4 GCM from the Max Plank Institute for Meteorology, Germany. The PRECIS data are produced by the Southeast Asian System for Analysis, Research and Training (SEA START) Regional Center for entire Southeast Asian region with a resolution of 0.2 × 0.2 degree (approximately 22 × 22 km2). These data comprise of datasets of A2 and B2 emission scenarios from ECHAM4 A2 and B2. The PRECIS data over the periods of 1971-2000 and 2011-2100 for both A2 and B2 scenarios were obtained from SEA START Regional center (http://gis.gms-eoc.org/ClimateChange/index_en.asp).
Other data
The 90m resolution Digital Elevation Model (DEM) for whole Thailand was downloaded from the Shuttle Radar Topography Mission (SRTM) website: http://glcf.umd.edu/data/srtm/. Soil data and its classification were done based on Food and Agriculture Organization (FAO) recommendations. The land use and land cover map for 2005 was retrieved from Land Development Department (LDD), Government of Thailand.
Methodological framework
Figure 2 represents the framework followed for assessing the impacts of climate change on water availability in Thailand. This study also emphasizes the importance of bias correction for the precipitation data obtained from RCM at basin level. Statistical comparison was done with raw RCM and bias corrected data to evaluate the outputs with the observed data for the current time period. Simultaneously the semidistributed hydrological model HEC-HMS version 3.5, developed by United States Army Corps of Engineers was also set up for each HRU by using the outputs of HEC-GeoHMS. The bias corrected precipitation output was then fed into HEC-HMS to simulate the future decadal water availability for A2 and B2 scenarios.
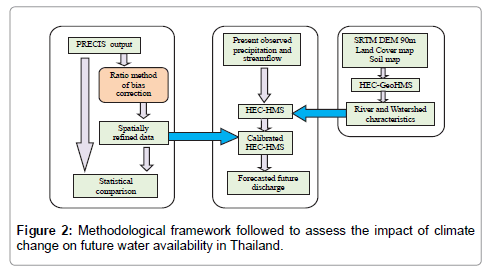
Figure 2: Methodological framework followed to assess the impact of climate change on future water availability in Thailand.
Ratio method of bias correction
The ratio method for bias correction was derived from Braun [23] which involves three steps. The first deals with determining monthly precipitation over the reference period followed by estimation of the monthly biases by using the mean monthly precipitation and the RCM dataset. Finally the calculation of the fine spatial resolution projected output is calculated based on the observed reference period and monthly bias computed data. Due to handling enormous amount of data for this research; in addition to the satisfactory performance of this method in other basins [24,25], the particular method was selected. Figure 3 illustrates the stepwise flowchart of the bias correction technique.
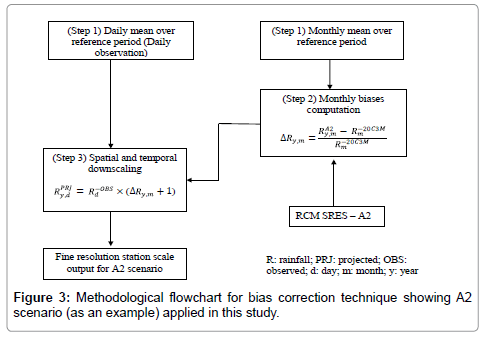
Figure 3: Methodological flowchart for bias correction technique showing A2 scenario (as an example) applied in this study.
Hydrological model
HEC-HMS model was selected to simulate the discharge in all HRUs. HEC-HMS model set up includes the setting of basin model, meteorological model and define the control specifications. The basin parameters including sub-basin area, centroid, slope of basin and longest flow are pre-requisite for HEC-HMS which was further derived by basin delineation from HEC-GeoHMS version 1.1 in ArcView GIS 3.2. The outputs of HEC-GeoHMS for all HRUs were imported to HECHMS to set up the model for those particular HRUs. Since the model was run for longer period of time, continuous loss model was chosen. Clark unit hydrograph transformation, constant monthly baseflow and lag routing methods were selected to develop the model for the HRUs. The meteorological model was developed by Thiessen Polygon Weight method. Further details on basin/HRU development can be found in [26]. Observed hydrological and meteorological data for the period of 1995–2003 and 2004–2010 was used for calibration and validation of the model respectively.
Results and Discussion
Comparison of RCM and bias corrected values
Table 1 shows the comparison of the raw RCM and bias corrected rainfall data with the observed for reference period for all 9 HRUs. The results clearly indicate that the bias correction gives better results in representing the present day climate. It can be observed that for Chao Phraya and Western Gulf HRUs the raw RCM data shows a deviation of +33.09 and +34.72% in magnitude of observed average annual precipitation whereas removing bias in the dataset can reduce it to +4.00 and +6.65% respectively. Similar results were also obtained in other HRUs as well however it can also be observed that simulated RCM values depend on the location of the HRU. For instance the percent deviation in simulated precipitation by RCM is higher in the coastal areas whereas in mountains and plains the simulations are in good agreement with the observed values.
| HRU name | Observed (mm) (2001-2010) |
RCM simulated | Bias corrected | ||
|---|---|---|---|---|---|
| Absolute value (mm) | % change | Absolute value (mm) | % change | ||
| Salawin | 1190 ± 47 | 1042 ± 55 | -12.46 | 1157 ± 34 | -2.78 |
| Mae Kok | 1730 ± 63 | 1321 ± 78 | -23.65 | 1645 ± 45 | -4.88 |
| Mae Khong | 1944 ± 127 | 2122 ± 141 | 9.16 | 2001 ± 114 | 2.94 |
| Chao Phraya | 1076 ± 162 | 1432 ± 154 | 33.09 | 1119 ± 148 | 4 |
| Mae Klong | 1612 ± 27 | 1578 ± 45 | -2.11 | 1602 ± 31 | -0.63 |
| Bang Pakong | 1422 ± 44 | 1332 ± 64 | -6.37 | 1401 ± 47 | -1.46 |
| Eastern Gulf | 1908 ± 96 | 1515 ± 75 | -20.61 | 1834 ± 91 | -3.89 |
| Western Gulf | 1063 ± 89 | 1432 ± 78 | 34.72 | 1134 ± 92 | 6.65 |
| Southern | 2221 ± 124 | 2850 ± 98 | 28.33 | 2336 ± 137 | 5.17 |
Table 1: Comparison of RCM simulated and bias corrected average annual precipitation values with the observed precipitation.
Projected rainfall anomalies
The rainfall anomalies projected by bias correction of the RCM dataset were calculated for dry and wet seasons separately for 2011-2040 (2020s), 2041-2070 (2050s) and 2071-2099 (2080s). Table 2 represents the percent deviation in average rainfall for dry season. It is observed that Mae Kok, Mae Khong and Bang Pakong HRUs will experience higher increase in precipitation in all three future time periods for both scenarios. It can also be observed that Chao Phraya will experience an increase in precipitation up to 22% and 13.5% for A2 and B2 scenarios respectively in 2080s relative to baseline period. Higher variation in the observed precipitation is also observed for the baseline period. The larger number of stations considered in the HRU can be attributed to this variation.
| Basin Group | Baseline (1971 – 2000) | 2020s | 2050s | 2080s | |||
|---|---|---|---|---|---|---|---|
| Dry period (Nov. – Apr.) | A2 (%) | B2 (%) | A2 (%) | B2 (%) | A2 (%) | B2 (%) | |
| Salawin | 273.7 ± 33 | 0.9 | -1.6 | 3.4 | 4.8 | 14.3 | 10 |
| Mae Kok | 397.9 ± 37 | 17.1 | 14.3 | 21.1 | 22.1 | 33.6 | 28.2 |
| Mae Khong | 408.2 ± 94 | 4.4 | 14.8 | 22.7 | 21.8 | 37.8 | 23.7 |
| Chao Phraya | 275.5 ± 102 | 3.1 | 0.8 | 7.4 | 8.4 | 21.9 | 13.5 |
| Mae Klong | 412.7 ± 21 | -4.2 | -6.6 | -1.9 | -0.5 | 8.4 | 4.4 |
| Bang Pakong | 364.0 ± 24 | 23.6 | 23.9 | 29.3 | 29.7 | 32 | 30.6 |
| Eastern Gulf | 450.3 ± 51 | 4 | 1.5 | 6.5 | 8 | 17.6 | 13.3 |
| Western Gulf | 318.9 ± 61 | -12.9 | -15 | -10.8 | -9.6 | -1.4 | -5 |
| Southern | 666.3 ± 62 | -4.6 | -7.4 | -7.4 | -4.4 | -2.4 | -3 |
Table 2: Projected rainfall anomalies (%) for dry season in case of A2 and B2 scenarios.
In case of wet season, Mae Kok and Mae Khong HRUs will experience an increase in precipitation up to 29.5% and 36.5 % in 2080s relative to baseline period (Table 3). The elevation of Mae Kok and larger spatial extent of Mae Khong HRU can be the causative factor for the projected increase. Surprisingly, Mae Klong and Bang Pakong HRUs show higher precipitation in order of 23.2% and 31.9 % for A2 scenario in 2080s. The influence of physical process of the mountains and sea respectively in climatology can be the attributed to this. In addition a higher variation in the observed precipitation for the baseline period is observed for Mae Khong, Chao Phraya, Eastern Gulf, Western Gulf and Southern HRUs.
| Basin Group | Baseline (1971 – 2000) | 2020s | 2050s | 2080s | |||
|---|---|---|---|---|---|---|---|
| Wet period (May – Oct.) | A2 (%) | B2 (%) | A2 (%) | B2 (%) | A2 (%) | B2 (%) | |
| Salawin | 916.3 ± 52 | -0.6 | 2.8 | 2.6 | 2.4 | 14.3 | 2.3 |
| Mae Kok | 1332.1 ± 72 | 12.7 | 16.8 | 16.7 | 15.7 | 29.5 | 16.9 |
| Mae Khong | 1535.7 ± 133 | 14.1 | 18.4 | 19.8 | 20.9 | 36.5 | 26.2 |
| Chao Phraya | 800.5 ± 181 | 1.2 | 4.2 | 3.7 | 4.1 | 16.2 | 3.3 |
| Mae Klong | 1199.3 ± 43 | 7.2 | 10.9 | 10.7 | 10.4 | 23.2 | 10.3 |
| Bang Pakong | 1057.9 ± 56 | 11.3 | 13.5 | 12.5 | 14.7 | 31.9 | 17.1 |
| Eastern Gulf | 1457.7 ± 102 | 2.7 | 6.2 | 6 | 5.7 | 18 | 5.7 |
| Western Gulf | 744.1 ± 118 | -3 | 0.3 | 0.2 | -0.1 | 11.6 | -0.1 |
| Southern | 1554.7 ± 132 | 1 | 5.4 | 8.8 | 8.7 | 21.4 | 15.4 |
Table 3: Projected rainfall anomalies (%) for wet season in case of A2 and B2 scenarios.
Calibration and validation of HEC-HMS
The HEC-HMS was calibrated and validated for all HRUs based on the observed stream flow data. The period of 1995-2003 and 2004- 2010 was chosen for model calibration and validation respectively. The modeling results were evaluated based on the coefficient of determination and volumetric error. The results suggest the model estimates the runoff in good agreement with the observed runoff. However, poor relationship is observed for Mae Khong, Eastern Gulf, Western Gulf and the Southern group HRUs (Table 4). Multiple outlets in the coastal region can be attributed to the poor performance of model in these HRUs. However, the performance of the model is still in acceptable range and therefore the projection was carried out for the future time periods.
| HRU name | Coefficient of Determination (R2) | Volumetric Error (%) | ||
|---|---|---|---|---|
| Calibration | Validation | Calibration | Validation | |
| Salawin | 0.78 | 0.76 | 3.87 | 2.56 |
| Mae Kok | 0.74 | 0.71 | 4.23 | 3.12 |
| Mae Khong | 0.61 | 0.67 | 8.74 | 6.58 |
| Chao Phraya | 0.87 | 0.82 | 1.42 | 2.06 |
| Mae Klong | 0.85 | 0.81 | 2.64 | 3.51 |
| Bang Pakong | 0.77 | 0.84 | 4.11 | 3.28 |
| Eastern Gulf | 0.62 | 0.59 | -9.84 | -10.71 |
| Western Gulf | 0.7 | 0.71 | -9.71 | -8.65 |
| Southern | 0.65 | 0.62 | -8.21 | -8.65 |
Table 4: HEC-HMS model performance statistics during calibration and validation.
Projection of decadal water availability at HRU scale
Figures 4 and 5 shows the simulated future water availability for A2 and B2 scenarios at all HRUs considered. The results suggest that, the future change in water availability is univocal in some HRUs whereas it is in contradiction in others. For instance, in case of Salawin, Chao Phraya and Eastern gulf HRUs for dry season, the water availability is expected to fluctuate in the first three decades followed by an increasing trend for both scenarios. It can also be noted that, the magnitude of available water is higher for A2 scenario relative to B2. It can also be observed that for the corresponding season at Mae Kok, Mae Khong and Bang Pakong HRUs an increasing trend in available water persists for both scenarios. A contradictory decreasing trend is expected for the coastal HRUs particularly Western and Southern HRUs. However simulation suggests that in Mae Klong HRU, the water availability will be reduced in the first half followed by an increase at the latter half of century. The projected rainfall in those HRUs can be attributed to the pattern of the simulated runoff. Simulation also suggests the southern and western basin groups are expected to experience a decline in the water availability for early part of the century up to 17% and 12% for 2010s and 2020s respectively relative to current water availability. The projected spatial variability in the water availability due to climate change may significantly affect the long term water management plans.
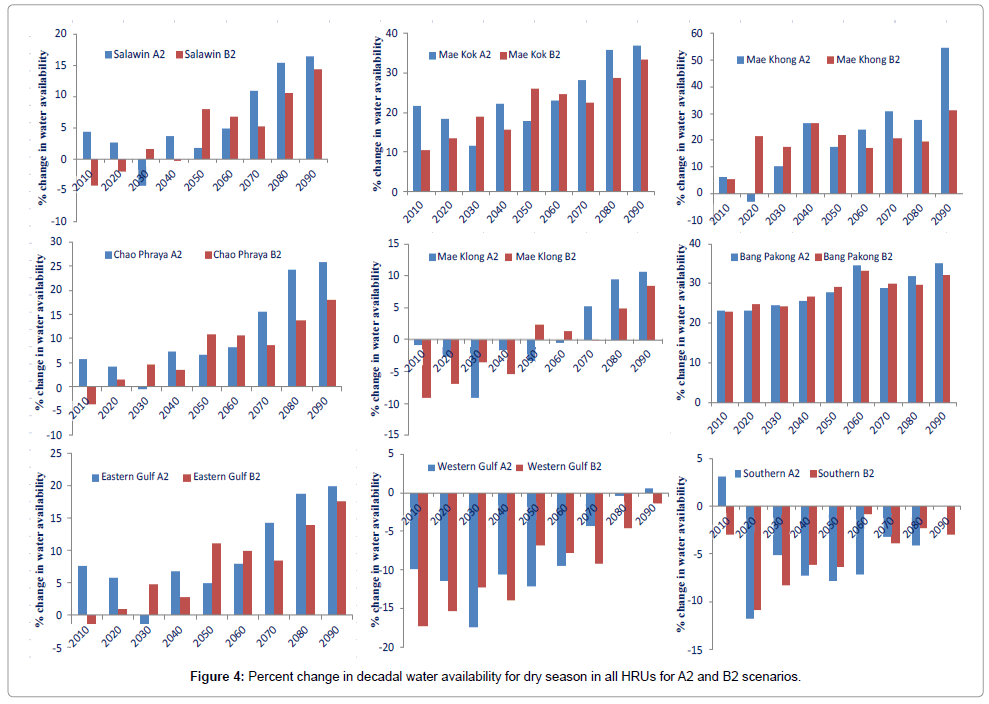
Figure 4: Percent change in decadal water availability for dry season in all HRUs for A2 and B2 scenarios.
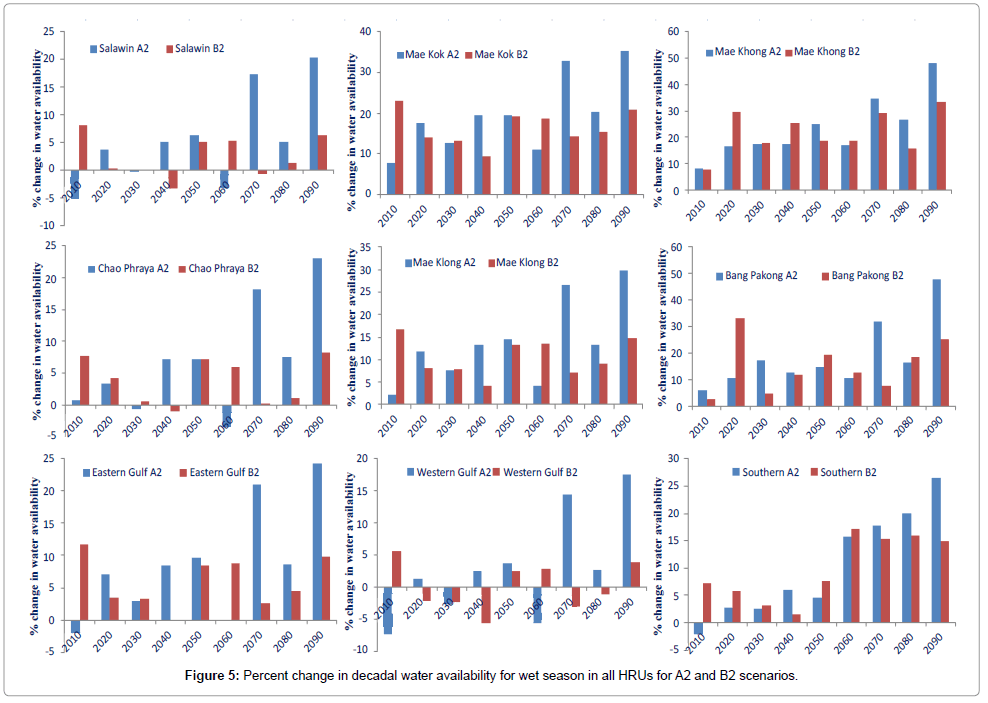
Figure 5: Percent change in decadal water availability for wet season in all HRUs for A2 and B2 scenarios.
Simulation of future water availability for wet season suggests a relatively lesser altercation for many HRUs in the country. An increasing trend in water availability is observed for Mae Kok, Mae Khong, Mae Klong, Bang Pakong and the Southern HRUs where the stream flow is expected to increase for all the decades relative to the baseline period for both scenarios. The Salawin, Chao Phraya and Western Gulf shows higher fluctuation in water availability for the decades however; the water availability is expected to increase up to 21%, 25% and 17% for the respective HRUs for 2080s in case of A2 scenario leading to higher focus on increased intensity of flood. Eastern Gulf HRU shows a positive fluctuation in the water availability although an increase up to 23% is expected for 2080s in case of B2 scenario. Nevertheless, for all HRUs an increasing trend or minor positive fluctuation in water availability is expected for all decades and the possibility of low intensity and frequent foods in wet season in the region.
Projection of decadal water availability at national scale
Figure 6 indicates the national level water availability for the future climate. It can be observed that majority of the HRUs indicates an increasing trend of water availability in dry season, yet at national scale the water availability results demonstrates a dropdown up to 6% for A2 scenario in 2020s compared to the baseline period of 77,061 MCM. The simulation also illustrates ahead of 2040s, an increase in magnitude is expected with maximum value at 13% and 7.5% for A2 and B2 scenarios in 2080s. The reduced stream flow in the early decades for most of HRUs attributed to climate change is the influencing factor for the reduced water availability for corresponding time intervals. The results indicate that at national level proper plans for energy and other associated sectors are necessary to be evaluated since in the early decades the water availability is expected to decrease.
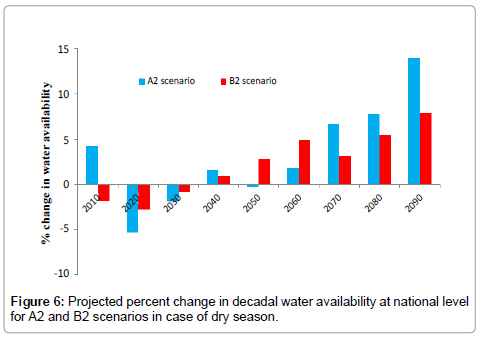
Figure 6: Projected percent change in decadal water availability at national level for A2 and B2 scenarios in case of dry season.
In contrast to dry season, wet season water availability is expected to have an increasing trend at national level irrespective of basin scale projection (Figure 7). An increase in water availability of 31% and 17% are expected for 2080s in case of A2 and B2 scenarios respectively at national scale compared to 183,050 MCM for baseline period which calls for improved landuse planning. It can also be noted that the national level water availability is influenced by the size of the HRU considered. The severity in magnitude of precipitation for A2 scenario is the contributing factor for the higher stream flow generation. For instance the stream flow generated for dry season follows similar trend as that of Chao Phraya and Mae Khong HRUs. Similarly for wet season the water availability trend follows similar as that of Mae Klong and Southern basin group HRUs.
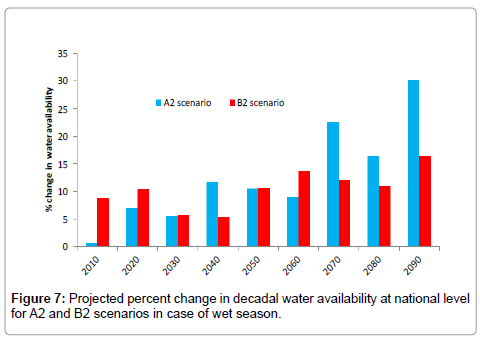
Figure 7: Projected percent change in decadal water availability at national level for A2 and B2 scenarios in case of wet season.
Conclusion
The present study examines the future water availability for Thailand grouped at different HRU and at national scale under two different climate change scenarios. The outputs of PRECIS RCM were selected to construct the climate change scenarios for the study area. A comparison of raw RCM outputs and bias correction results suggest the future climate data can be significantly corrected by ratio method of bias correction. Further, bias correction of results illustrates Mae Kok, Bang Pakong, Mae Khong and Southern basin HRUs are expected to have an increase in precipitation ranging from 21.4% to 37.8% and 15.4% to 30.6% for A2 and B2 scenarios respectively considering both dry and wet seasons by 2080s. Hydrological model simulation suggests that for both scenarios and seasons; all HRUs show similar trend except for Mae Klong, Bang Pakong, Western and Southern HRUs where dry season indicates different trend relative to that of wet period. Although, in all cases the extreme water availability is observed in 2080s ranging from -7% to 47% and -17.8% to 54% for wet and dry periods respectively relative to baseline period. The national level water availability varies from -5.5% in 2020s to +13% 2090s and +1% in 2010s to +29% in 2080s. The increasing trend of water availability indicates better water management plan to avoid the increased risks of flood in the nation.
References
- Intergovernmental Panel on Climate Change – IPCC (2007) Summary for policy makers. Contribution of Working Group II to the Fourth Assessment Report of the Intergovernmental Panel on Climate Change, Cambridge University Press, Cambridge, UK.
- Graiprab P, Pongput K, Tangtham N, Gassman PW (2010) Hydrologic evaluation and effect of climate change on the at Samat watershed, Northeastern Region, Thailand. Int Agri Engg J 19: 12-22.
- SEA START RC (2009) Water and climate change in the lower Mekong basin: diagnosis and recommendations for adaptation. Water and development research group. Helsinki University of Technology (TKK) and Southeast Asia START Regional Center, Chulalongkorn University. Water & Development Publications, Helsinki University of Technology, Espoo, Finland
- Kranz N, Menniken T,Hinkel J (2010) Climate change adaptation strategies in the Mekong and Orange-Senqu basins: what determines the state of play? Environ Sci Policy 13: 648-659.
- Chiew FHS, Teng J, Vaze J, Kirini DGC (2009) Influence of global climate model selection on runoff impact assessment. J Hydrol 379: 172-180.
- Dore MH (2005) Climate change and changes in global precipitation patterns: what do we know? Environ Int 31: 1167-1181.
- Sharma D, Babel MS (2013) Application of downscaled precipitation for hydrological climate-change impact assessment in the upper Ping River Basin of Thailand. Climate Dyn 41: 2589-2602.
- Jiang T, Su B, Hartmann H (2007) Temporal and spatial trends of precipitation and river flow in the Yangtze River Basin. Geomorphol 85: 143-154.
- Li F, Zhang Y, Xu Z, Teng J, Liu C, et al. (2013) The impact of climate change on runoff in the southeastern Tibetan Plateau. J Hydrol 505: 188-201.
- Boyer C, Chaumont D, Chartier I, Roy AG (2010) Impact of climate change on the hydrology of St. Lawrence tributaries. J Hydrol 384: 65-83.
- Jiang T, Chen YD, Xu C, Chen X, Chen X, et al. (2007) Comparison of hydrological impacts of climate change simulated by six hydrological models in the Dongjiang Basin, South China. J Hydrol 336: 316-333.
- Davis EGR, Simonovic SP (2011) Global water resources modelling with an integrated model of the social-economic-environmental system. AdvWater Res 34: 684-700.
- Intergovernmental Panel on Climate Change (IPCC) (2001) Impacts, adaptation and vulnerability. Contribution of Working Group II to the Third Assessment Report of the Intergovernmental Panel on Climate Change, Cambridge University Press, Cambridge, UK.
- Babel MS, Bhusal SP, Wahid SM, Agarwal A (2013) Climate change and water resources in the Bagmati River Basin, Nepal. Theoret Appl Climatol 115: 639-654.
- Nohara D, Kitoh A, Hosaka M, Oki T (2006) Impact of climate change on river runoff. J Hydrometeorol 7: 1076-1089.
- Arnell NW (2003) Effect of IPCC SRES* emission scenarios on river runoff: a global perspective. Hydrol Earth Syst Sci 7: 619-641.
- Minville M, Brissette F, Leconte R (2008) Uncertainty of the impacts of climate change on the hydrology of a Nordic watershed. J Hydrol 358: 70-83.
- Weart S (2010) The development of general circulation models of climate. Studies History Philos Modern Phys 41: 208-217.
- Koutroulis AG, Tsanis IK, Daliakopoulos IN, Jacob D (2013) Impact of climate change on water resources status: A case study for Crete Island, Greece. J Hydrol 479: 146-158.
- Leander R, Buishand TA (2007) Resampling of regional climate model output for the simulation of extreme river flows. J Hydrol 332: 487-496.
- Chu X, Steinman A (2009) Event and continuous hydrologic modelling with HEC-HMS. J Irrig Drain Eng 135: 119-124.
- Sharma D, Gupta AD, Babel MS (2007) Spatial disaggregation of bias-corrected GCM precipitation for improved hydrologic simulation: Ping River Basin, Thailand. Hydrol Earth Syst Sci 11: 1373-1390.
- Braun M, Caya D, Frigon A, Slivitzky M (2011) Internal variability of the Canadian RCM’s hydrological variables at the basin scale in Quebec and Labrador. J Hydrometeorol 13: 443-462.
- Chen J, Brissette FP, Chaumont D, Braun M (2013) Performance and uncertainty evaluation of empirical downscaling methods in quantifying the climate change impacts on hydrology over two North American river basins. J Hydrol 479: 200-214.
- Mpelasoka FS,Chiew FHS (2009) Influence of rainfall scenario construction methods on runoff projections. J Hydrometeorol 10: 1168-1183.
- USACE (2000) Hydrological modeling system HEC-HMS: technical reference manual. US Army Corps of Engineers, Hydrologic Engineering Center, USA.
Citation: Shrestha S (2014) Assessment of Water Availability under Climate Change Scenarios in Thailand. J Earth Sci Clim Change 5: 184. DOI: 10.4172/2157-7617.1000184
Copyright: ©2014 Shrestha S. This is an open-access article distributed under the terms of the Creative Commons Attribution License, which permits unrestricted use, distribution, and reproduction in any medium, provided the original author and source are credited.
Select your language of interest to view the total content in your interested language
Share This Article
Recommended Journals
Open Access Journals
Article Tools
Article Usage
- Total views: 16029
- [From(publication date): 3-2014 - Aug 30, 2025]
- Breakdown by view type
- HTML page views: 11333
- PDF downloads: 4696