Biostratigraphy and Geochemistry of Upper Paleocene - lower EoceneOceanic Red Beds from the Zagros Mountains, SW Iran
Received: 28-Aug-2017 / Accepted Date: 02-Sep-2015 / Published Date: 12-Sep-2015 DOI: 10.4172/2157-7617.1000302
Abstract
Oceanic Red Beds studied are well known in the upper Cretaceous (CORBs, i.e. Cretaceous Oceanic Red Beds), but their presence and genesis have hitherto not been intensively discussed for equivalent Paleogene deposits. We describe a red to purple shale interval from the Pabdeh Formation, Zagros basin, Iran, which can be assigned to Late Paleocene to Early Eocene age, nannofossil zones NP9-NP12. Parts of the purple marl interval within NP9/NP10 coincide with the PETM (Paleocene-Eocene Thermal Maximum) interval. Coccolithus pelagicus, Sphenolithus moriformis, Sphenolithus orphanknollensis, and Toweius ssp. are dominant in nannofossil assemblages in this interval, and PETM event taxa such as Discoaster araneus appear. Based on whole rock geochemistry and microfossil assemblages, the red to purple marls were deposited in an oligotrophic environment with low nutrient (Ba) values, and were accompanied by a shift to more oxic conditions and low amount of TOC in an oceanic basin. Low amount of major elements like Si, Al and Fe indicates low terrestrial input and relatively high amount of CaO (biogenic element) emphasizes the open sea and pelagic deposition of the shale. Warm deep water can be inferred by the presence of the dinoflagellate taxa Impagidinium and nannoplankton taxa, Discoaster. As a result, the purple shale can be considered as typical Paleogene ORBs in the Zagros basin deposited under very similar conditions as well studied Tethyan Cretaceous oceanic red beds.
Keywords: Oceanic red beds; purple shale; Tethyan realm; Zagros
11963Introduction
A growing number of studies have been published in recent years on Cretaceous Oceanic Red Beds (CORB), most of them indicating a Late Cretaceous age, the maximum extend for this facies [1-13]. In palaeogeographic terms, CORBs are mostly deposited in the low to middle latitudes [6] but occur in some localities such as Greenland and New Zealand also in high palaeolatitude settings [7,13]. In some times and places, especially in the Tethyan mid-Cretaceous, they are reported to be strongly connected to, and a subsequent result of oceanic anoxic events, i.e. of OAE1a [4] and OAE2 [3,6]. Rabbani et al. [14] studied the paleoenvironment of this red beds based on palynomorphs and concluded that they are mostly outer neritic depositional settings. Our study is the first record of Oceanic Red Beds (ORBs) from the Paleogene of Iran. Integrating stratigraphic, sedimentologic and geochemistry data allow us to constrain the depositional environment of these Paleogene ORBs. These red beds occur during the time of climate instability in the Late Paleocene to Early Eocene transitional interval.
Geological Setting And Lithostratigraphy
The Zagros Mountain belt, trending NW-SE, extends for over 1800 km from southeastern Turkey and northern Iraq toward the west and south east of Iran up to the Makran area, where oceanic subduction is still active [15]. The Zagros Mountains are tectonically a part of the Alpine–Himalayan mountain belt, and formed after the long standing convergence between Eurasia and Gondwana, followed by collision of the Eurasian and Africo-Arabian plates and finally the closure of the Neo-Tethys Ocean in southwest Iran [16-18]. The timing of the collision ranged from the Late Cretaceous to the Miocene [19] or Late Pliocene [20]. There is also evidence in support of Late Eocene to Oligocene initial collision [16]. Dominate part of the Zagros foldthrust belt developed as an epicontinental, synorogenic pro-foreland basin, which evolution is related to the tectonic and structural events of the associated Zagros orogen. The Zagros orogen is interpreted as the product of three major geotectonic events: 1) subduction of the Neo-Tethyan oceanic plate during Early to Late Cretaceous time, 2) obduction of Neo-Tethyan oceanic slivers (ophiolites) onto the Afro- Arabian passive continental margin in Late Cretaceous (Turonian to Campanian) time, and (3) collision of the Afro-Arabian plate with the Iranian plates in Late Cretaceous and later times [18]. Following these Late Cretaceous movements that resulted in closure of Neo-Tethys Ocean, during the Paleogene, the sea-level rose and a pro-forland basin was formed. The Pabdeh Formation was deposited in the deeper parts of this foreland basin [21-23]. The basal member of the Pabdeh Formation, informally termed ‘purple shale unit’ (“purple shale member-PSM, is in fact calcareous marl and marly limestone however, they have long been known as "purple shales" of the base of the Pabdeh Formation and thus the name is traditionally coined and used for the unit. To avoid any confusion we call the units with the same old name through this paper”) overlies the gray shale of the Gurpi Formation (Late Cretaceous-early Paleocene) in the three sections studied here. The Pabdeh Formation is known in outcrop and in subsurface sections in the provinces of Lurestan, Khuzestan, coastal and sub-coastal Fars of Iran [24]. Our studied sections are: a) Tange-Abolhayat section that is located on Shiraz – Kazeron road along the Tang-e-abolhayat (N 29º 42´ 17", E 51º 57´ 26") in Fars province (Southwest Shiraz, ), (b) Ilam section, south of Ilam, on the road to Ilam Dam (N 33 ° 31´ 32.3", E 46° 24´ 46.5") and (c) Dehloran section, on Dehloran to Mehran road in Havian abandoned village (N 32° 52´ 07.5" , E 46° 54´ 11.7"). Both of the two latter sections are located in Lorestan province (Figures 1 and 2).
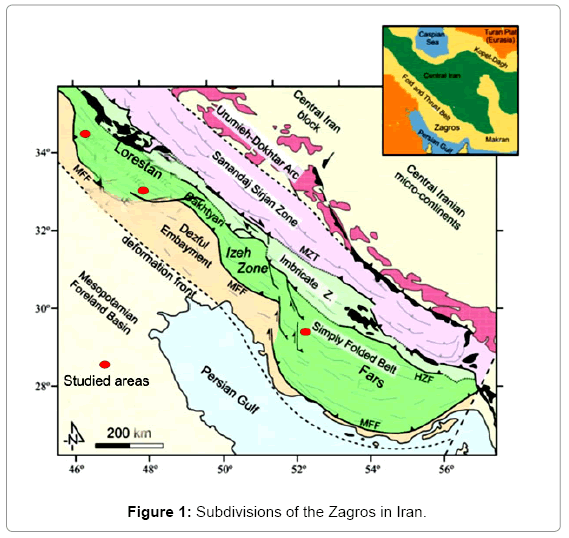
Figure 1: Subdivisions of the Zagros in Iran.
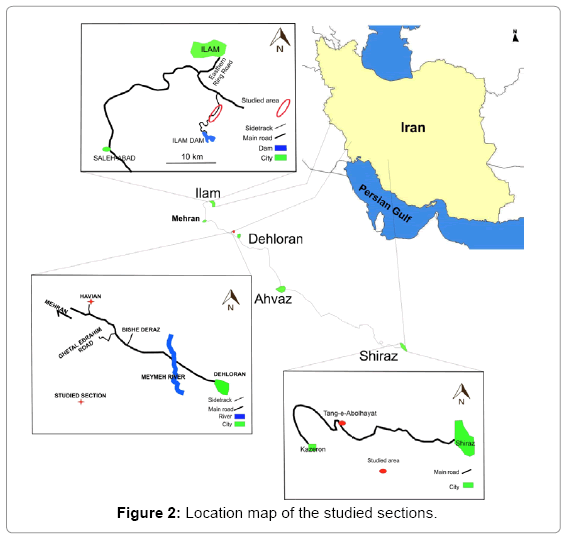
Figure 2: Location map of the studied sections.
Methods
A total of 34 samples from three sections (14 samples from Tange- Abolhayat; 10 samples from Ilam and 10 samples from Dehloran) were collected. Nine samples were analyzed for TOC and 10 samples for geochemistry contents.
Dinoflagellate processing
All of the samples were processed for palynology according to the standard palynological technique [25]. Fifteen gram of sediment were treated with HCL (10%) for 24 hours to dissolve carbonates, rest in 40% HF for two days to dissolve silicates. Each step was followed by a neutralizing period to avoid formation of fluoride gel. Then samples were washed and sieved through a nylon filter with a mesh size of 10 μm. The residue on the sieve was placed in an ultrasonic bath for 5 minutes and transferred to a glass tube and centrifuged with zinc chloride (with a density of 2) for 5 minutes at 2500 rpm, sieved again and palynological slides were made.
Nannoplankton preparation
A modified smear-slide technique [26] was used. For this, the accurate preparation technique for light microscopy described by Donally [27] was followed: 0.5 g of sample was powdered and decanted in 50 ml distilled water, then placed for 30 s in an ultrasonic bath. Next, the materials were to be settled for 1 min. After pouring out the upper solution and settling for 1 hour, the supernatant was poured off and the residue was diluted with distilled water and used for slide. The slides were studied with a polarized light microscope at 1000x magnification, using a gypsum plate.
Foraminiferal preparation
Samples were soaked in water and size sorted washing using sieves of 70, 120 and 230 μm.
TOC value
The TOC was measured by Rock Eval analysis by Chamran University of Ahvaz Lab.
Chemical analysis
The chemical analysis was done by AcmeLabs (Acme Analytical Laboratories Ltd.) in Vancouver (Canada). ICP- emissions spectroscopy was used to detect oxides (SiO2, Al2O3, Fe2O3, MgO, CaO, Na2O, K2O, TiO2, P2O5, MnO and Cr2O3), some minor elements (Ni, Ba, Be, Co, Cs, Ga, Hf, Nb, Rb, Sn, Sr, Ta, Th, U, V, W and Zr) and the loss on ignition (LOI). For the analysis of trace elements ICP-mass spectroscopy was used (REE: Sc, Y, La, Ce, Pr, Nd, Sm, Eu, Gd, Tb, Dy, Ho, Er, Tm, Yb and Lu; Noble and Base metals: Mo, Cu, Pb, Zn, Ni, As, Cd, Sb, Bi, Ag, Au, Hg, Tl and Se). Applied ICP-ES and ICP-MS techniques show precisions of 0.01% for oxides and 0.1-0.2% for trace elements, respectively.
Isotope analysis
Samples for δ13C and δ18O analysis of the carbonate were taken from polished slabs with a handheld micro-drill. Sample powders were reacted with 100% phosphoric acid at 70°C in a Kiel II automated reaction system, and the evolved carbon dioxide gas was analysed with a Finnigan Delta Plus mass spectrometer at the University of Graz (analytical precision < 0.05% for δ13C, < 0.1% for δ18O). The δ13C and δ18O values are corrected according to the NBS19 standard and reported in per mill (%) relative to the Vienna-PeeDee Belemnite (V-PDB) standard.
Results
Lithology
In all three investigated sections the Purple Shale (PSM) overlie the Gurpi Formation and are overlain by marls and limestones of the upper Pabdeh Formation. The PSM thickness in the Tang-e- Abolhayat section is about 18 meters. It consists of red to purple calcareous marl, purple marl with interbedded gray shale. In the Ilam section, 34.86 meters in thickness, the studied interval is mostly purple colored calcareous marl with a layer of gray shale near the top of the member. In the third investigated section, at Dehloran, the interval comprises mostly marl with purple, green and gray colors, and its thickness is about 35.5 meters (Figure 3). Microfacies contents of the samples shows micritic matrix with common to abundant pelagic microfossils (wackestone and wackstone-packstone with planktonic foraminifers) (Figure 4).
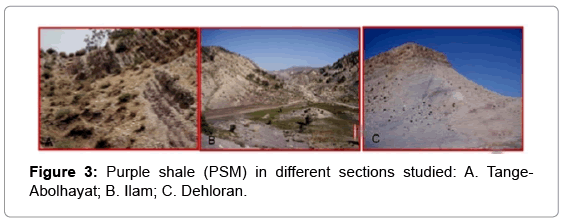
Figure 3: Purple shale (PSM) in different sections studied: A. Tange- Abolhayat; B. Ilam; C. Dehloran.
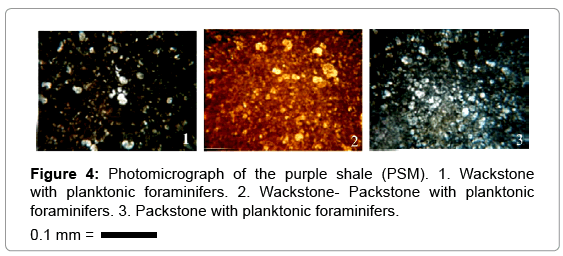
Figure 4: Photomicrograph of the purple shale (PSM). 1. Wackstone with planktonic foraminifers. 2. Wackstone- Packstone with planktonic foraminifers. 3. Packstone with planktonic foraminifers. 0.1 mm = ——
Biostratigraphy
Biostratigraphy is based on calcareous nannoplankton, dinoflagellate cysts and planktonic foraminifers. The first nannofossil biozone recorded is NP9. Its base is marked by the FO (first occurrence) of Discoaster multiradiatus and the top is determined by the FO of Discoaster diastypus [28]. This zone includes also the following nannofossil species: Fasciculithus tympaniformis, Fasciculithus aubertae, Discoaster multiradiatus, Neochiastozygus distentus, Toweius eminens and Biantholithus sparsus. Discoaster araneus (a taxon typical for the carbon isotope excursion around the PETM interval, e.g. Kahn and Aubry [29]) falls in this zone. This zone is distinguished in the Tange-abolhayat and Dehloran sections (Figure 5). The next biozone differentiated is NP 10-11. The top marker of NP10, Tribrachiatus contortus is absent in the studied sections, so these zones are combined and defined by the FO of Discoaster diastypus to the FO of Discoaster lodoensis. Discoster araneus is common in this interval and the other associated nanofossil species are: Sphenolithus radians, Sphenolithus editus, Sphenolithus moriformus, Coccolithus pelagicus, Coccolithus foraminis, Coccolithus minimus, Coronocyclus sp, Campylosphaera sp., Chiasmolithus solitus, Discoaster barbadiensis, Discoaster robustus, Discoaster deflandrei, , Discoaster salisburgensis, Girgisia gammation, Helicosphaera seminulum, Helicosphaera lophota, Ellipsolithus sp., Zygrhablithus bijugatus, Discoaster multiradiatus, Nechiastozygus junctus, Toweius eminens, Toweius magnicrassus, Biantholithus sparsus, The last biozone is NP12, with the FO of Discoaster lodoensis at the base and the top of the zone characterized by the last occurrence (LO) of Tribrachiatus orthostylus which occurs in the Dehloran section. But in the Tange-Abolhayat and Ilam sections, the top of this zone is marked by the FO of Reticulofenestra dictyoda [28]. This zone includes: Toweius callosus, Toweius sp., Zygrhablithus bijugatus, Coccolithus pelagicus, Coccolithus minimus, Coccolithus formosus, Sphenolithus moriformis, Sphenolithus radians, Discoaster kuepperi, Discoaster lodoensis, Discoaster deflandrie, Discoaster barbadiensis, Coronocyclus bramlettei, Pontosphaera sp,. Chiasmolithus bidens. Based on the NP nannofossil standard biozonation of Martini applied here, the age of the PSM in the studied sections is Late Paleocene (Thanetian) to Early Eocene (Ypresian). The base of the Eocene is commonly defined within NP9 (e.g. Luterbacher et al. in Gradstein et al. [30]).
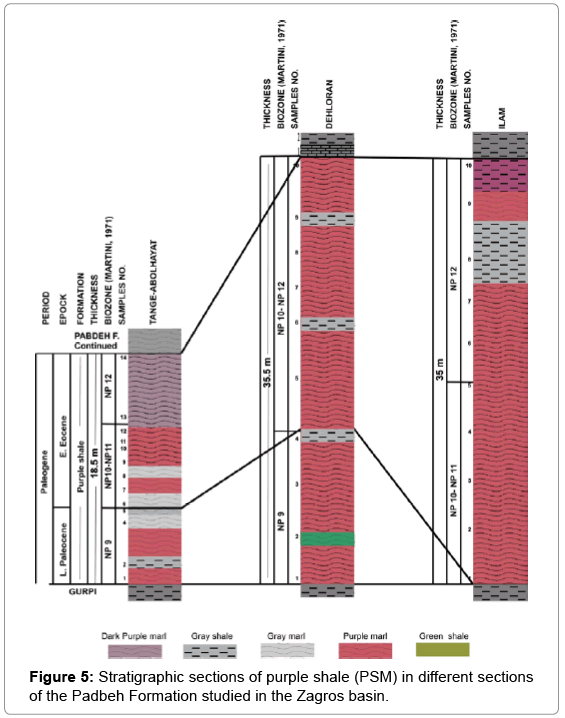
Figure 5: Stratigraphic sections of purple shale (PSM) in different sections of the Padbeh Formation studied in the Zagros basin.
Two bio-zones based on dinoflagellate cysts have also been differentiated (see North Hemisphere mid-latitude (NML) dinocyst zonation: Homotryblium tenuispinosum Zone (Late Paleocene- Early Eocene) and Cordosphaeridium funiculatum, Zone (Early Eocene). The associated species are: Apectodinium summisum, Spiniferites sp., Thalassiphora pelagic, Barssidinium evangelineae, Achomosphaera cf. multifurcata, Apectodinium ?quincuelatum, Operculodinium echigoense, Impgidinium sp., Apectodinium parvum, Achomosphaera alcicornu, Spiniferites ramosus, Hystrichokolpoma cinctum, Enneadocysta sp., Spiniferella cornuta?, Homotryblium tenuispinosum, Polysphaeridium sp. The dinoflagellate marker species for the PETM event, Apectodinium augustum augustum (e.g. Speijer et al. [31]), was not found in the present study, maybe as a consequence of unsuitable environmental condition. This age interpretation is supported by planktonic foraminifers. The zones identified include the Morozovella formosa Zone (E4), base defined by LO of Morozovella formosa, and its top by the FO of Morozovella aragonensis (early Ypresian). The follows the Morozovella aragonensis/Morozovella subbotinae Zone (E5) defined by LO of Morozovella aragonensis and the HO (Highest occurrence) of Morozovella subbotinae (Ypresian). Acarinina pentacamerata Zone (E6) bracketed by the HO Morozovella subbotinae and the LO Acarinina cuneicamerata (late Ypresian). The uppermost zone comprises the Acarinina cuneicamerata Lowest-occurrence Zone (E7) marked by LO Acarinina cuneicamerata and the LO of Guembilitrioides nuttalli (latest Ypresian). The planktonic foraminifer’s assemblage in the PSM therefore represents the E4-E7 planktonic foraminifer zones of the Early Eocene [32].
Isotope stratigraphy
An overview testing for stable isotopes of carbon and oxygen in the Tang-e-Ablhayat section showed no clear trend concerning a distinct (negative) carbon isotope excursion (CIE). However, a minor trend from 0.2% VPDB to -0.2 at section meter 3 could be recognized, followed by a significant increase up section to values around 0.7% starting at section meter 6.5 (Figure 5). This may correspond to a negative CIE, although only 1% fluctuations are recorded. A tentative correlation of this interval to the normally much more marked negative CIE at the Paleocene Eocene Thermal Maximum can be made [33,34], corroborated by using the biostratigraphic framework of NP9 to NP12. However, a high resolution study of carbon isotopes is needed to really identify the supposed PETM interval in detail (Figure 6). Oxygen isotopes show no comparable trend but stay for the most part of the section between -3.5 and -4.0% without significant changes.
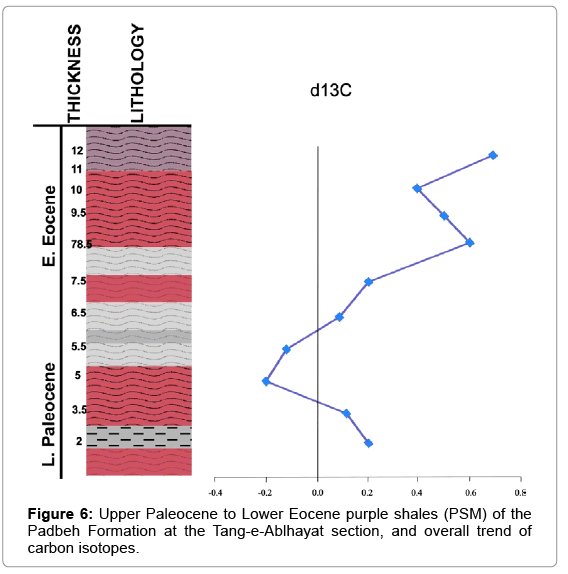
Figure 6: Upper Paleocene to Lower Eocene purple shales (PSM) of the Padbeh Formation at the Tang-e-Ablhayat section, and overall trend of carbon isotopes.
CaCO3 and TOC content
As above mentioned, the studied PSM, traditionally known as purple shale of the base of the Pabdeh Formation, are marly limestone with high carbonate content measured in the analyzed 2 sections. Our carbonate contents range between 51.4 and 77.2 percent in the SE and between 80.6 and 83.6% in the NW of the study area (Tables 1 and 2). The high carbon content shows a decrease in terrestrial input and indicates a pelagic environment far from inshore [35], above the calcite compensation depth. The high percentage of carbonate is accompanied by low amounts of organic carbon (Figure 6). Generally, in oceanic red beds, TOC is less than 0.1% [1] and in our study, the measured amount of TOC is between 0.05 to 0.13% with a low average of 0.085% in samples. On the other hand, high amounts of the RockEval oxygen index (OI > 150) indicate a predominantly oxidant marine environment for the depositional period of the PSM (Table 2).
| SAMPLENO. | Carbonate% | SAMPLE NO. | Carbonate % |
|---|---|---|---|
| TA1 | 83.3 | I1 | 71.2 |
| TA3 | 81.3 | I3 | 57.4 |
| TA5 | 81.3 | I4 | 62.6 |
| TA6 | 80.5 | I5 | 51.4 |
| TA7 | 81.0 | I6 | 66.4 |
| TA9 | 83.3 | I7 | 58.2 |
| TA11 | 85.2 | I8 | 55.3 |
| TA12 | 83.5 | I9 | 62.6 |
Table 1: Carbonate percentages in Tang-e-Abolhayat (TA, SE basin) and Ilam (I, NW basin) sections.
| Sample | S1 | S2 | S3 | Tmax | HI | OI | PI | TOC | RC | Minc |
|---|---|---|---|---|---|---|---|---|---|---|
| TA-1 | 0 | 0 | 0.17 | 262 | 0 | 340 | 0 | 0.05 | 0.05 | 9.79 |
| TA-3 | 0 | 0.01 | 0.12 | 428 | 20 | 240 | 0 | 0.05 | 0.05 | 9.3 |
| TA-6 | 0 | 0.02 | 0.21 | 352 | 22 | 233 | 0 | 0.09 | 0.07 | 9.2 |
| TA-10 | 0.04 | 0.05 | 0.4 | 346 | 38 | 308 | 0.46 | 0.13 | 0.11 | 10.14 |
| Ta-14 | 0 | 0.01 | 0.26 | 352 | 9 | 236 | 0 | 0.11 | 0.1 | 9.62 |
| I-2 | 0 | 0 | 0.25 | 425 | 0 | 278 | 0 | 0.09 | 0.08 | 5.65 |
| I-4 | 0 | 0 | 0.15 | 263 | 0 | 300 | 0 | 0.05 | 0.05 | 7.44 |
| I-5 | 0 | 0 | 0.21 | 262 | 0 | 300 | 0 | 0.07 | 0.06 | 6.38 |
| I-7 | 0 | 0 | 0.21 | 262 | 0 | 162 | 0 | 0.13 | 0.12 | 6.83 |
Table 2: Result of Rock Eval analysis in Tang-e-Abolhayat and Ilam sections.
Bulk geochemistry
Based on elemental analysis two factors were identified according to the factor analysis by Neuhuber and Wagreich [10]: Factor 1. Elements in factor 1 include trace metal (Ni, Cu, Pb, Co), Ba and phosphate and represent nutrients [10]. Low values of nutrient-related elements in studied areas are showing oligotrophic conditions and are correlated with warm-water nannofossil taxa. Factor 1 show a decreasing trend and indicates that primary productivity was low. This is emphasized by corresponding low TOC values (Figure 7 and Table 3). Ba amount is linked to higher nutrient availability in seawater. Decrease in Ba corresponds to low primary productivity at the surface of the ocean [36-38]. The lowest value of Barium in the different sections is recorded from the top of PSM in Ilam section and corresponds to maximum oligotrophic conditions. Factor 2 includes elements like Al, Rb, Mg and V are mainly related to terrestrial input [39]. This factor has a positive correlation with TOC components and negative with carbonate values, i.e. the more terrigenous input the less (autochthonous) pelagic carbonate. Al2O3 compared with Rb and Co, and MgO compared with V show a positive correlation, that indicates low terrigenous input. The triangle classification of CaO, SiO2 and Al2O3 for ORBs [11,13] used for our purple shale chemistry results in a classification in the deep sea carbonate field. This suggests low detrital input, and deep-water deposition above the carbonate compensation depth (Figure 8).
| D-1 | D-3 | D-5 | I-2 | 1-4 | I-5 | Sh-1 | Sh-3 | Sh-10 | Sh-12 | |
|---|---|---|---|---|---|---|---|---|---|---|
| Ni | 102 | 92 | 89 | 214 | 159 | 274 | 72 | 67 | 69 | 48 |
| Co | 6,8 | 6,4 | 4,2 | 16,1 | 10,7 | 19.5 | 4,3 | 4,2 | 3,1 | 2,1 |
| Cu | 11,9 | 19,4 | 12,3 | 22,5 | 15,1 | 24,1 | 6,7 | 5,8 | 11,9 | 6,5 |
| Pb | 2,1 | 2,3 | 1,6 | 3,3 | 2,3 | 2,4 | 1,1 | 1,6 | 1,4 | 1,3 |
Table 3: The amount of Ni, Co, Cu and Pb in various sections.
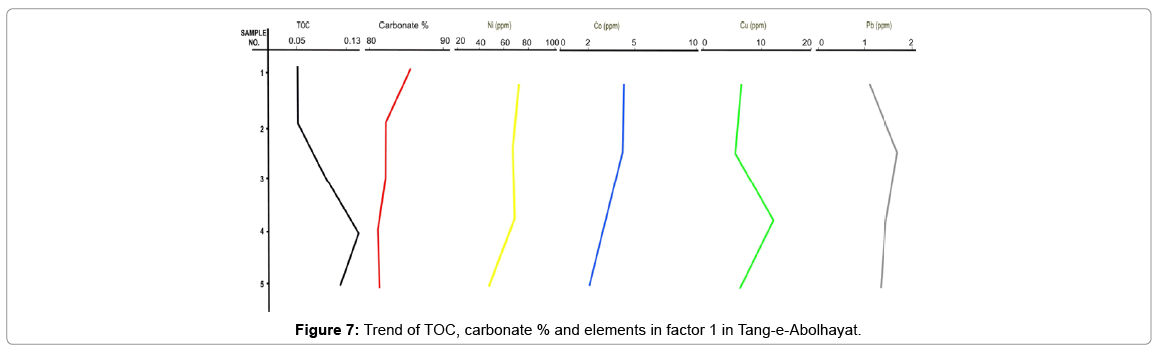
Figure 7: Trend of TOC, carbonate % and elements in factor 1 in Tang-e-Abolhayat.
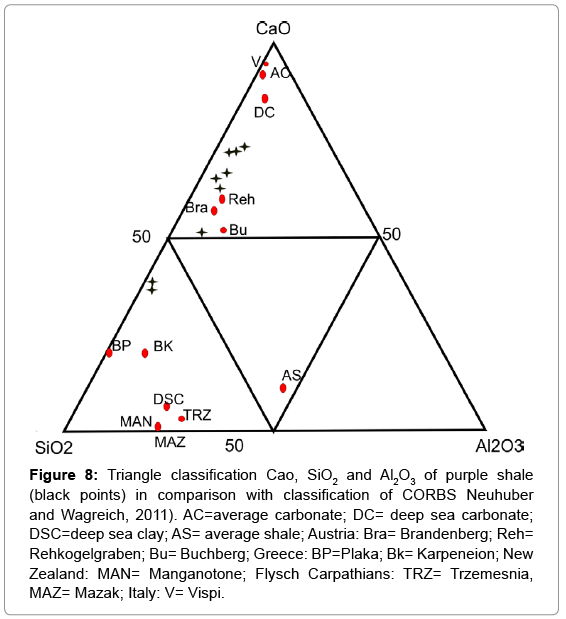
Figure 8: Triangle classification Cao, SiO2 and Al2O3 of purple shale (black points) in comparison with classification of CORBS Neuhuber and Wagreich, 2011). AC=average carbonate; DC= deep sea carbonate; DSC=deep sea clay; AS= average shale; Austria: Bra= Brandenberg; Reh= Rehkogelgraben; Bu= Buchberg; Greece: BP=Plaka; Bk= Karpeneion; New Zealand: MAN= Manganotone; Flysch Carpathians: TRZ= Trzemesnia, MAZ= Mazak; Italy: V= Vispi.
Major and minor elements
Major elements chemistry of the shales is dominated by SiO2 (13.52- 34.93 weight percent), Al2O3 (1.69-5.90 weight percent) and Fe2O3 (1.15-4.00 weight percent) with lowest values of major elements in Tange-Abolhayat section and highest values in Ilam section (Table 3). Low amount of major elements indicates low terrestrial input. The silica concentration in these sediments ranges from 13 to 35% which is lower than CaO (a biogenic element) which has a negative correlation to the other elements. As it is shown in Figure 5, the chemical composition of sediments have similar trends except for CaO and MnO in Tange- Abolhayt; MgO, CaO, Na2O and MnO in Dehloran; CaO and MnO in Ilam that show a negative correlation to others (Tables 4 and 5). The REE decreased to the top of purple shale in three sections without any Ce anomaly that classified this sediment as typical offshore deposits [40] (Figures 9 and 10).
| D-1 | D-2 | D-3 | I-2 | 1-4 | I-5 | Sh-1 | Sh-3 | Sh-10 | Sh-12 | |
|---|---|---|---|---|---|---|---|---|---|---|
| SiO2 | 18.72 | 18.68 | 17.96 | 34.93 | 25.24 | 33.45 | 13.52 | 16.81 | 14.28 | 15.03 |
| Al2O3 | 3.88 | 3.81 | 2.60 | 5.90 | 4.59 | 5.16 | 2.56 | 3.09 | 2.16 | 1.69 |
| Fe2O3 | 2.35 | 2.59 | 2.05 | 4.00 | 3.45 | 4.40 | 1.69 | 2.01 | 1.32 | 1.15 |
| MgO | 2.66 | 2.65 | 2.81 | 4.76 | 4.52 | 6.03 | 1.30 | 1.69 | 1.21 | 1.06 |
| CaO | 36.87 | 36.79 | 38.61 | 23.59 | 30.87 | 24.01 | 42.89 | 40.09 | 42.98 | 43.37 |
| Na2O | 0.08 | 0.06 | 0.07 | 0.10 | 0.07 | 0.10 | 0.06 | 0.11 | 0.05 | 0.08 |
| K2O | 0.62 | 0.62 | 0.43 | 0.95 | 0.74 | 0.78 | 0.48 | 0.59 | 0.35 | 0.25 |
| TiO2 | 0.26 | 0.23 | 0.16 | 0.47 | 0.36 | 0.43 | 0.14 | 0.18 | 0.11 | 0.09 |
| P2O5 | 0.18 | 0.19 | 0.12 | 0.16 | 0.14 | 0.14 | 0.25 | 0.26 | 0.12 | 0.12 |
| MnO | 0.05 | 0.04 | 0.05 | 0.06 | 0.07 | 0.06 | 0.05 | 0.04 | 0.04 | 0.04 |
| Cr2O3 | 0.020 | 0.025 | 0.018 | 0.036 | 0.030 | 0.102 | 0.022 | 0.013 | 0.031 | 0.014 |
Table 4: Major element composition of the Purple Shale.
| D-1 | D-2 | D-3 | I-2 | 1-4 | I-5 | Sh-1 | Sh-3 | Sh-10 | Sh-12 | |
|---|---|---|---|---|---|---|---|---|---|---|
| La | 14.6 | 15.4 | 11.3 | 16.8 | 14.4 | 14.1 | 16.7 | 18.2 | 15.2 | 11.0 |
| Ce | 17.4 | 16.2 | 12.6 | 24.1 | 18.6 | 20.9 | 14.2 | 17.0 | 12.2 | 10.0 |
| Pr | 2.61 | 2.69 | 1.99 | 3.25 | 2.68 | 2.83 | 2.82 | 3.18 | 3.22 | 1.73 |
| Nd | 10.0 | 10.0 | 8.6 | 13.3 | 11.0 | 11.7 | 11.1 | 11.8 | 9.4 | 6.4 |
| Sm | 2.15 | 2.22 | 1.52 | 2.61 | 2.05 | 2.31 | 2.31 | 2.54 | 1.61 | 1.28 |
| Eu | 0.53 | 0.51 | 0.37 | 0.69 | 0.52 | 0.57 | 0.56 | 0.63 | 0.40 | 0.33 |
| Gd | 2.42 | 2.30 | 1.62 | 2.72 | 2.21 | 2.46 | 2.62 | 3.04 | 1.95 | 1.46 |
| Tb | 0.38 | 15.4 | 0.28 | 0.45 | 0.37 | 0.43 | 0.43 | 0.50 | 0.31 | 0.26 |
| Dy | 2.18 | 16.8 | 1.91 | 2.86 | 2.22 | 2.13 | 2.62 | 2.96 | 2.03 | 1.63 |
| Ho | 0.51 | 2.69 | 0.42 | 0.56 | 0.48 | 0.48 | 0.60 | 0.66 | 0.46 | 0.38 |
| Er | 1.51 | 10.0 | 1.12 | 1.70 | 1.33 | 1.54 | 1.76 | 2.09 | 1.26 | 1.12 |
| Tm | 0.22 | 2.22 | 0.17 | 0.25 | 0.18 | 0.24 | 0.27 | 0.30 | 0.20 | 0.20 |
| Yb | 1.32 | 0.51 | 1.10 | 1.36 | 1.31 | 1.41 | 1.91 | 1.94 | 1.20 | 1.04 |
Table 5: REE concentrations in the Purple Shale.
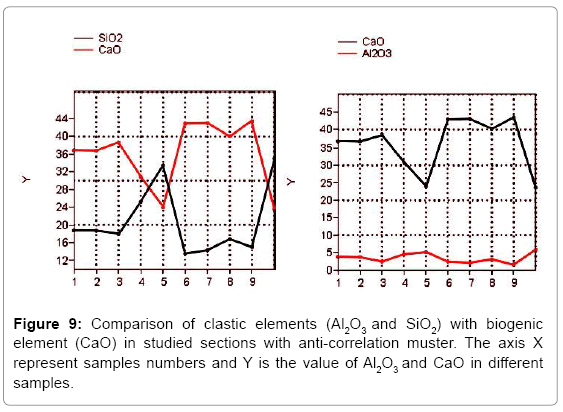
Figure 9: Comparison of clastic elements (Al2O3 and SiO2) with biogenic element (CaO) in studied sections with anti-correlation muster. The axis X represent samples numbers and Y is the value of Al2O3 and CaO in different samples
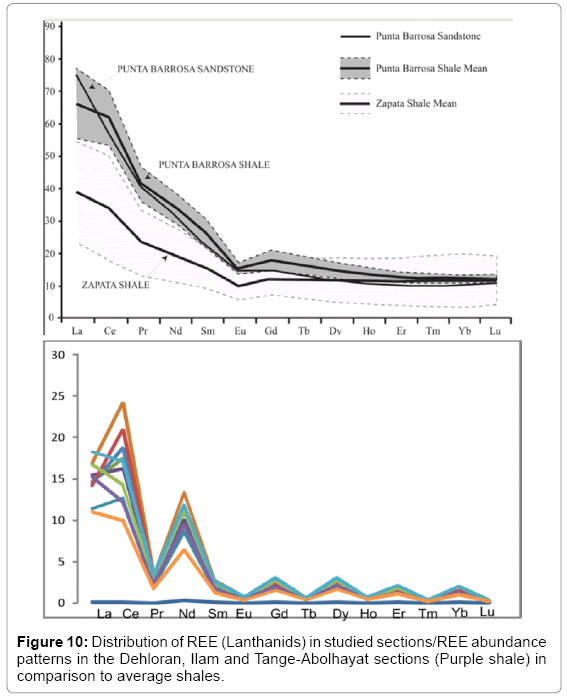
Figure 10: Distribution of REE (Lanthanids) in studied sections/REE abundance patterns in the Dehloran, Ilam and Tange-Abolhayat sections (Purple shale) in comparison to average shales.
Discussion
The microfacies of the investigated sections can be classified mostly as wackestone and wackstone-packstone with planktonic foraminifers that were deposited in an open deep shelf to basin setting [41]. This indicates that the pelagic purple shale unit was deposited in deep marine condition above calcite compensation depths. The unit is also rich in chorate dinoflagellate cysts, and calcareous nannoplankton confirming a deep-water pelagic depositional environment. Very low amount of TOC in the purple shale could be either as a result of low biogenic productivity or highly oxygenated bottom waters which in combination with a low sedimentation rate would allow deposited organic matter to be oxidized [5]. TOC is generally less than 0.1% in red beds [1] and in this study TOC is between 0.05-0.13 percent. Relatively, high amounts of oxygen index OI > 150 and presence of planktonic faunas and floras, indicate however a fully marine environment. The results of analysis of major elements show that the Ba/Al ratio, as an indicator of marine primary productivity [42], is low. Generally the purple shale was deposited in oligotrophic conditions in a deep marine environment. Coccolithus pelagicus, Sphenolithus moriformis, Sphenolithus orphanknollensis, Tribrachiatus orthostylus and Toweius are dominant in nannofossil assemblages in Late Paleocene-Early Eocene. First occurrence of excursion taxa such as Discoaster araneus occurs in this interval and has a global distribution during the PETM in the world’s oceans [43,44]. However relation of this sediment (PCM) to PETM needs more study. The association with nannofossil Discoaster, Fasciculithus and Sphenolithus indicate warm and oligotrophic environments. In the studied area their increases in abundance suggest increased oligotrophic conditions in the surface water at that time. Deep sea carbonates are generally richer in minor elements such as Sr with an average of 2000 ppm. However, this value is only 500 ppm in CORBs carbonate [9,11,39]. The Purple marls presented here contain high amount of carbonate (more than 50%) and Sr value (486 to 652 ppm) alike carbonate CORBs. The deposition of the purple shale can be interpreted as a result of an oligotrophic and oxic environment [9] in the sedimentary basin. The chemistry of the Paleogene purple shale interval in the Zagros Mountains is very similar to Cretaceous ORBs of the Alps, especially the Ultrahelvetic successions [11,39] which were interpreted as oligotrophic and oxic deposits. Oligotrophic condition are also emphasized by nannofossil assemblages, with an increase in relative abundance of Discoaster, Sphenolithus in 3 sections, and Fasciculithus genera in Tange Abolhayat and Dehloranbut which coincides with radiation of oligotrophic planktonic foraminifers such as Morozovella [45] in studied area. In addition, the presence of the dinoflagellate genus Impagidinium, which even in small number indicates oceanic environments (e.g., Dale [46]; Marret and Zonneveld [47]), implies an offshore, rather oligotrophic depositional environment (Appendix).
Conclusions
The Late Paleocene-Early Eocene time interval in the Zagros basin was a time period of oligotrophic conditions with low nutrient (Ba) and warm-water taxa (Discoasters, Sphenolithus) in studied areas. This time accompanies the global oceanic deep water warming of the PETM [31], and oligotrophic condition increased in the surface water [43], resulting in a significant increase in relative abundance of mentioned genera. The presence of Impagidinium spp. emphasizes an offshore environment for studied sediments. The composition of these sediments is predominantly reddish colored to purple shale and marl. They are interpreted to be of deep water, pelagic to hemipelagic deposition, and their TOC value is very low. The high carbonate content of the sediments and the anti-correlation of Al2O3 and SiO2 to MgO and MnO, indicate a low input of clastic material, and thus a position distal from the shoreline. In conclusion, our study demonstrates the existence of oceanic red beds (ORBs) in the Paleogene sediment (Iran), especially within the Paleocene-Eocene interval, and concludes, based on geochemistry and microfossil assemblages, similar oligotrophic and oxic depositional conditions as put forward for Cretaceous ORBs - CORBs in the sense of Hu et al. [2] However, no significant carbon burial event and no anoxic events can be related to the formation of these oceanic red beds as, in contrast, was demonstrated for some of the Cretaceous oceanic red beds [6]; the relation of these Paleogene ORBs to the hyper thermal events still needs further elaboration.
Acknowledgment
The authors would like to thank Mr. A. Agdari, head of Geological Survey of Ahvaz, Dr. M. Khanebad, M. Sabagh, M. Badpa and M. Shafie Ardestani of Ferdowsi University of Mashhad for their help provided during the course of this study. This is contribution to UNESCO-IUGS IGCP 609, Climate-environmental deteriorations during greenhouse phases: Causes and consequences of shortterm Cretaceous sea-level changes.
References
- Zou YR, Kong F, Peng P, Hu X, Wang C (2005) Organic geochemistry characterization of Upper Cretaceous oxic oceanic sediments in Tibet, China: a preliminary study. Cretaceous Res 26: 65-71.
- Hu X, Jansa L, Wang C, Sarti M (2005) Upper Cretaceous oceanic red beds (CORBs) in the Tethys: occurrence, lithofacies, age, and environments. Cretaceous Res 26: 3-20.
- Hu X, Cheng W, Ji J (2009) Origin of the Cretaceous Oceanic Red Beds from the Vispi Quarry Section, Central Italy: Visible Reflactance and Inorganic Geochemistry. In: Hu X,Wang C, Scott RW, Wagreich M, Jansa L (Eds), Cretaceous Oceanic Red Beds: Stratigraphy, Composition, Origions, Paleoceanographic, and Paleoclimatic Significance: SEPM Special Publication,Tulsa, OK 91: 183- 197.
- Hu X, Wang C, Li X, Jansa L (2006) Upper Cretaceous oceanic red beds in southern Tibet: Lithofacies, environments and colour origin. Earth Sci 49: 785-795.
- Wang C, Hu X, Sarti M, Scott RW, Li X (2005) Upper Cretaceous oceanic red beds in southern Tibet: a major change from anoxic to oxic deep â??sea environments. Cretaceous Res 26: 21- 32.
- Wang C, Hu X, Huang Y, Wagreich M, Scott RW, et al. (2011) Cretaceous oceanic red beds as possible consequence of oceanic anoxic events. Sedimentary Geol 235: 27-37.
- Chen X, Wang CS, Hu XM, Huang YJ, Wang PK, et al. (2007) Cretaceous oceanic red beds: distribution, lithostratigraphy and paleoenvironments. ActaGeologicaSinica 81: 1070-1086.
- Yilmaz IO (2008) Cretaceous pelagic red beds and black shales (Aptian- Santonian), NW Turkey: global oceanic anoxic and oxic events. Turkish J Earth Sci 17: 265-295.
- Wagreich M, Neuhuber S (2009) Cretaceous oceanic red beds (CORB) in the Austrian Easthern Alps: passive-margin vs. Active-margin depositional settings SEPM 91: 73-88.
- Neuhuber S, Wagreich M (2009) Geochemical characterization of Santonian Cyclic Oceanic Red Beds in the Alpine Tethys (RehkogelGraben Section, Austria). Cretaceous Oceanic Red Beds: Stratigraphy, Composition, Origins, and Paleoceanographic and PaleoclimaticSignificance . SEPM Special Publication No. 91SEPM (Society for Sedimentary Geology) 199-207.
- Neuhuber S, Wagreich M (2011) Geochemistry of Cretaceous Oceanic Red Beds â?? A synthesis. Sedimentary Geology 235: 72-78.
- Li G, Jiang G, Wan X (2011) The age of the Chuangde Formation in Kangmar, southern Tibet of China: implication for the origin of Cretaceous Oceanic Red Beds (CORBs) in the Northern Tethyan Himalaya. Sedimentary Geology 235: 111-121.
- Hu X, Scott RW, Cai Y, Wang C, Melinte-Dobrinescu MC (2012) Cretaceous oceanic red beds (CORBs): Different time scales and models of origin. Earth Sci Rev 115: 217-248.
- Rabbani J, Ghasemi-Nejad E, Ashori AR, Vahidinia M (2013) Quantitative palynostratigraphy and palaeoecology of Tethyan Paleoceneâ??Eocene red beds in north of Zagros sedimentary basin, Iran. Arabian Journal Geoscience.
- Smith J, Burg JP, Dolayi A, Sokoutis D (2010) Effects of mass waste events on thrust wedges: Analogue experiments and application to the Makranaccretionary wedge. Tectonics 29, TC3003, 11.
- Lacome O, Grasemann B, Simpson G (2011) Introduction: geodynamic evolution of the Zagros, Geology Magezine148: 689-691.
- AgardP, Omrani J, Jolivet L, Whitechurch H, Vrielynck B, et al. (2011) Zagros orogeny: a subduction-dominated process. GeoogyMagezine 148: 692-725.
- Alavi M (2004) Regional Stratigraphy of the Zagros Fold – Trust belt of Iran and its Proforland Evolution. Am J Sci 304: 1-20.
- Berberian F, Berberian M (1981) Tectono-plutonic episodes in Iran. In Zagros-Hindu Kush-Himalaya Geodynamic Evolution, Washington, D.C.: American Geophysical Union 3: 5-32.
- Stöcklin J (1968) Structural history and tectonics of Iran: a review. Am Association of Petroleum Geologists Bulletin 52: 1229-1258.
- Sampo M (1969) Microfaciesand Microfossils of the Zagrous Area Southwest Iran (From pre- Permian to Miocene). Leinden, The Netherlands: Brill EJ.
- Motiei H (1993) Geology of Iran: Stratigraphy of Zagrous. Geological survey of Iran. 536.
- Aghanabati A (2004) Geology of Iran. Tehran,: Geological survey of Iran 708.
- Tabatabaei H, Motamed A, Soleimani B, Kamali MR (2012) Chemical Variation during Pabdeh Formation Deposition, Zagros Basin: Gurpi-Pabdeh-Asmari Boundaries determination and Paleoenvironmental Condition. J GeolGeosci 1: 1000102.
- Traverse A (2007) Palaeopaly some other points for corrections were also found through the text. Do not forget to do these as wellnology, (2ndedn). Springer 800.
- Bown PR, Young JR (1998) Techniques. In: Bown PR, (Eds), Calcareous nannofossil biostratigraphy Chapman and Hall, Khuwer Academic Publishers 16-28.
- Donally DM (1989) Calcareous nannofossil of the Noewegian-Greenland Sea: ODP LEG 104. Proceeding of the Ocean Drilling Program, Scientific Result 104: 458-486.
- Perch-Nielsen K (1985) Cenozoic calcareous nannofossils. In Bolli HM, Saunders JB, Perch-Nielsen K, (Eds), Plankton Stratigraphy. Cambridge University Press 427-554.
- Kahn A, Aubry MP (2004) Provincialism associated with the Paleocene/Eocene thermal maximum: temporal constraint. Marine Micropaleontol 52: 117-131.
- Gradstein FM, Ogg JG (2004) Geological Time Scale 2004- why, how, and where next! Lenthaia 37: 175-181.
- Speijer RP, Schebner C, Stassen P, Morsi AMM (2012) Response of marine ecosystems to deep-time global warming: a synthesis of biotic patterns across the Paleocene-Eocene thermal maximum (PETM). Austrian Journal of Earth Science 105: 6-16.
- Berggren WA, Pearson PN (2005) A revised tropical to subtropical Palaeogene planktonic foraminiferal zonation. J Foraminiferal Res 35: 279-298.
- Zachos JC, Bohaty SM, John CM, McCarren H, Kelly DC, et al. (2007) The Palaeocene-Eocene carbon isotope excursion: constraints from individual shell planktonic foraminifer records. Philosopical Transactions of the Royal Soc A 365: 1829-1842.
- Wagreich M, Egger H, Gebhardi H, Mohammad O, Spötl C, et al. (2011) A new expanded record of the Paleocene-Eocene transition in the Gosau Group of Gams (Eastern Alps, Austria). Annals of the Natural History Museum Vienna, series A 113: 35-65.
- Wehausen R, Tian J, Brumsack HJ, Cheng X, Wang P (2003) Geochemistry of Pliocene sediments from ODP Site 1143 (Southern South China Sea). Prell, WL, Wang P, Blum P, Rea DK, and Clemens SC (Eds) P of the Ocean Drilling Program, Scientific Results 184: 1-25.
- Dehairs F, Chesselet R, Jedwab J (1980) Discrete suspended particles of barite and the barium cycle in the open ocean, Earth Planetary Sci Letters 49: 528-550.
- Bains S, Norris RD, Corfield RM, Faul KL (2000) Termination of global warmth at the Paleocene/Eocene boundary through productivity feedback, Nature 407: 171-174.
- Babu CP, Brumsack HJ, Schnetger B, Böttcher ME (2002) Barium as a productivity proxy in continental margin sediments: a study from the eastern Arabian Sea. Marine Geol 184: 189-206.
- Neuhuber S, Wagreich M, Wendler I, Spötl C (2007) Turonian Oceanic Red Beds in the Eastern Alps: Concepts for palaeoceanogtaphic changes in the Mediterrranean Tethys. Palaeogeography. Palaeoclimatology, Palaecol 251: 22-238.
- Minai Y, Tominga T (1985) Geochemistry of Deep Sea sediments from the Nankai Trough, the Japan Trench, and adjacent regions. Kagarni H, Karig DE, Coulboara WT, Initial Reports DSDP 87: 643-657.
- Flügel E (2010) Microfacies of carbonate rock, Analysis, Interpretation and Aplication. Springer 976.
- Thompson EI, Schmitz B (1997) Barium and the Late Paleocene d13C maximum: Evidence of increased marine surface productivity. Paleoceanography 12: 239-254.
- Bralower TJ (2002) Evidence of surface water oligotrophy during the Paleocne-Eocene Thermal Maximum: Nannofossil assemblages data from Ocean Drilling Program Site 690. Maud Rise, Weddell Sea. Paleoceanography 17: 1-12.
- Raffi I, Backman J, Zachos JC, Sluijs A (2009) The response of calcareous nannofossil assemblages to the Paleoceene Eocene Thermal Maximum at the Walvis Ridge in the South Atlantic. Mar Micropaleontol70: 201-212.
- Fuqua LM, Bralower TJ, Arthur MA, Patzkowsky ME (2007) Evolution of Calcareous Nannoplankton and the Recovery of Marine Food Webs After the Cretaceous-Paleocene Mass Extinction. Palaios 23: 185-194.
- Dale B (1996) Dinoflagellatecyct ecology: modeling and geological application, In Jansonius J & McGregor DC (Eds) Palynology: Principles and Applications. American Association of Stratigraphic Palynologists Foundation, Dallas 3: 1249-1275.
- Marret F, Zonneveld KAF (2003) Atlas of modern organic-walled dinoflagellate cyst distribution. Revof Palaeobotany and Palynology 125: 1-200.
Citation: Khorassani MPK, Ghasemi-Nejad E, Wagreich M, Hadavi F, Richoz S, et al. (2015) Biostratigraphy and Geochemistry of Upper Paleocene - lower Eocene Oceanic Red Beds from the Zagros Mountains, SW Iran. J Earth Sci Clim Change. 6: 302. DOI: 10.4172/2157-7617.1000302
Copyright: © 2015 Khorassani MPK. This is an open-access article distributed under the terms of the Creative Commons Attribution License, which permits unrestricted use, distribution, and reproduction in any medium, provided the original author and source are credited.
Select your language of interest to view the total content in your interested language
Share This Article
Recommended Journals
Open Access Journals
Article Tools
Article Usage
- Total views: 13014
- [From(publication date): 10-2015 - Aug 29, 2025]
- Breakdown by view type
- HTML page views: 11937
- PDF downloads: 1077