Research Article Open Access
Brain Activity during the Observation, Imagery, and Execution of Tool Use: An fNIRS/EEG Study
| Hideki Nakano1,2*, Kozo Ueta1, Michihiro Osumi1and Shu Morioka1 | |
| 1Department of Neurorehabilitation, Graduate School of Health Science, Kio University, Japan | |
| 2Japan Society for the Promotion of Science, Japan | |
| Corresponding Author : | Hideki Nakano Department of Neurorehabilitation Graduate School of Health Science Kio University, 4-2-2 Umami-naka, Koryo-tyo Kitakatsuragigun, Nara 635-0832, Japan Tel: +81-745-54-1601 Fax: +81-745-54-1600 E-mail: H1081007@kio.ac.jp |
| Received August 20, 2012; Accepted October 04, 2012; Published October 30, 2012 | |
| Citation: Nakano H, Ueta K, Osumi M, Morioka S (2012) Brain Activity during the Observation, Imagery, and Execution of Tool Use: An fNIRS/EEG Study. J Nov Physiother S1:009. doi:10.4172/2165-7025.S1-009 | |
| Copyright: © 2012 Nakano H, et al. This is an open-access article distributed under the terms of the Creative Commons Attribution License, which permits unrestricted use, distribution, and reproduction in any medium, provided the original author and source are credited. | |
Visit for more related articles at Journal of Novel Physiotherapies
Abstract
This study used a functional near-infrared spectroscopy (fNIRS)/electroencephalogram (EEG) system to investigate brain activity during a daily living situation where subjects are engaged in the observation, imagery, and execution of tool use. The subjects were 24 healthy adults who signed an agreement to participate in the present study. All subjects were right-handed according to the Edinburgh Handedness Inventory. The subjects sat on a chair and participated in the observation, imagery, and execution of chopstick and hammer movements. Each trial consisted of observation, imagery, and execution and the trials were performed in triplicate. The timing protocol was 15.0, 15.0, 15.0, 15.0, and 15.0 s for rest, task, rest, task, and rest, respectively, and brain activity was measured during these periods. fNIRS and EEG were used to measure brain activity. Optical fibers of fNIRS were positioned over the frontoparietal area. Oxyhemoglobin served as a parameter, and NIRS-statistical parametric mapping (SPM) was used for data analysis. EEG measurements were made using 32 electrodes with an international 10–20 system. The event-related desynchronization of the Mu frequency band (8-12 Hz) was calculated by power spectrum analysis. The brain regions activated during the imagery and execution of the chopsticks movement were the dorsolateral prefrontal cortex, inferior frontal gyrus, premotor cortex, and primary somatosensory cortex, while the mu ERD values were obtained under both conditions. The brain regions that were mainly activated under all three conditions of the hammer movement, i.e., observation, imagery, and execution, were the dorsolateral prefrontal cortex, inferior frontal gyrus, and premotor cortex, while the mu ERD values were obtained under all three conditions. These results suggest that brain activity during the observation, imagery, and execution of tool use differed according to the sensory modality linked to a tool.
| Keywords |
| Functional near-infrared spectroscopy (Fnirs); EEG (Electroencephalogram); Tool use |
| Introduction |
| Studies have shown that improvements in the upper limb function of post-stroke victims tend to be worse than those in the lower limb functions, and there is generally a poorer prognosis for the upper limbs [1]. This is because the upper limbs demand greater involvement of the parietal lobe (surrounding the intraparietal sulcus and the inferior parietal lobule) and the frontal lobe (ventral premotor area) compared with the lower limbs, in addition to requiring a more advanced information processing [2]. Furthermore, when hemiplegia is seen in a stroke victim, the individual is no longer capable of motor function. This causes greater difficulties in the functional activation of these brain regions. |
| Methods such as action observation therapy, which utilizes movement observation, and mental practice, which utilizes the imagery of movements, have recently been developed to address this issue, and these methods are increasingly attracting attention [3]. Action observation therapy requires the subject to observe video footage of a series of movements or actions undertaken by a third party during which the subject attempts to mentally simulate the same actions [4]. In contrast, mental practice has been defined as the internal replay of movements or actions [5], i.e., the repetitive mental simulation of specific actions. These methods do not require actual physical movement and are therefore beneficial for patients with motor paralysis. |
| Such mental simulations of actions, including action observation and action imagery, have been shown to share the same neural basis as that used for the execution of the actual physical movement in question [6]. During the observation, imagery, and execution of a finger tapping action, Macuga and Frey [7] showed that the premotor cortex, presupplementary motor area, posterior parietal cortex, anterior cranial area, and primary sensory motor areas were jointly activated. Furthermore, Filimon et al. [8] showed that the observation, imagery, and execution of an arm reaching motion caused the overlapping activation of the dorsal premotor cortex, superior parietal lobe, and intraparietal sulcus. Thus, the similarities in brain activities observed between the actual execution, observation, and imagery of actions suggest that the observation and imagery of actions could be an effective training method during rehabilitation [3]. |
| The upper limbs are predominantly engaged in the operation of tools during daily life. A number of previous studies have compared observation and execution as well as imagery and execution of tool use [9,10]. However, the specific brain activity that occurs during three conditions of tool use, i.e., observation, imagery, and execution, remains unclear. The current study set up a hypothesis that a similar brain activity occurs during the observation, imagery, and execution of tool use. Furthermore, most previous studies have measured brain activity using functional magnetic resonance imaging (fMRI). However, fMRI greatly restricts body movements and places subjects in an environment that is greatly different from the environment of actual daily life. In comparison, functional near-infrared spectroscopy (fNIRS) and electroencephalogram (EEG) are less restrictive and allow measurements to be made in an environment that can simulate normal and actual daily life. Thus, studies using these methods are capable of measuring brain activity even while the subject is standing or walking [11-13]. Neurofeedback training using fNIRS and EEG are currently under development [14,15]. The studies of brain activity during the observation, imagery, and execution of actions using fNIRS and EEG will contribute directly to the development of more effective neurofeedback training. |
| This study used an fNIRS/EEG system to analyze brain activity occurring during the observation, imagery, and execution of the operation of certain tools. |
| Materials and Methods |
| Subjects |
| Twenty-four (12 females and 12 males; mean age, 24.8 ± 5.7 years) subjects were recruited. All subjects were right-handed according to the Edinburgh Handedness Inventory [16]. Subjects were excluded if they had a chronic (orthopedic, neurological, or psychiatric) disease that might influence the results. All subjects gave their informed consent according to the Declaration of Helsinki. They were free to withdraw from the study at any time. The procedure was approved by the local Institutional Ethics Committee (Kio University). |
| Procedure |
| Subjects were seated in a chair with a backrest, and then they participated in the observation, imagery, and execution of the actions of chopsticks and hammer handling. Each subject performed a trial comprising the observation, imagery, and execution conditions, and each trial was repeated three times by each subject. The protocol for each condition was as follows: rest (15 s), task (15 s), rest (15 s), task (15 s), and rest (15 s). After each subject had completed three trials with one tool (chopsticks or hammer), they undertook three trials with the other tool. The tool used in the first set of tasks was selected at random. All subjects wore an orthopedic collar to prevent cervical movements during experiments. |
| The chopsticks movement involved chopsticks being operated with the right hand to transfer dried sardines from one plate to another. The two plates were positioned one in front of the other in line with the subject, with the sardines originally placed on the plate further away from the subject being transferred to the plate directly in front of the subject. The hammer movement required that a hammer was operated using the right hand, and the subject had to strike against a nail inserted into a piece of wood placed in front of the subject. |
| Under the observation condition, the subjects viewed the action via a computer monitor placed directly in front of them. During the task phases, first-person footage (i.e., footage taken from the same point of view as though the subject is executing the task) was presented with the chopstick and hammer movements, and the subjects were asked to attempt first-person observation. During the rest phases, a cross was displayed in the middle of the screen and each subject was instructed to focus on this cross during these periods. |
| Under the imagery conditions, the subjects focused on the tools, i.e., chopsticks or a hammer, placed in front of them. During the task phases, the subjects were instructed to imagine the movement required to operate the tool placed in front of them (first-person imagery). During the rest phases, the subjects were instructed to relax without thinking about this movement. |
| Under the execution conditions, the subjects were instructed to focus on the tool, i.e., the chopsticks or hammer, placed in front of them. During the task phases, the subjects were instructed to use the tool and physically perform the movement observed and imagined previously. During the rest phases, the subjects were instructed to relax without performing the movement. |
| fNIRS/EEG measurements |
| An fNIRS/EEG system and fNIRS/EEG folder of the whole brain was used to measure brain activity. |
| The fNIRS system (FOIRE-3000, Shimadzu, Japan) used continuous wave laser diodes with wavelengths of 780, 805, and 830 nm to record cortical activity at a sampling rate of 4 Hz. This system detected changes in the cortical concentration levels (mM×mm) of oxygenated hemoglobin (oxyHb), deoxygenated hemoglobin (deoxyHb), and total hemoglobin by applying the modified Beer– Lambert law [17]. We used a 42-channel system with 27 optodes (14 light sources and 13 detectors) (Figure 1). After the subjects’ 10-20 system benchmarks and fNIRS probe locations were measured using a 3D position measuring system (FASTRAC, Polhemus, USA) and stochastic registration of the Montreal Neurological Institute (MNI) brain coordinates was performed using NIRS-statistical parametric mapping (SPM) [18,19], the brain locations corresponding to each channel were identified. |
| During fNIRS data analysis, we used the oxyHb levels as markers of cortical activity because oxyHb is the most sensitive indicator of changes in regional cerebral blood flow [20-22]. Moreover, oxyHb signal changes served as measurements of cortical activation for neurofeedback [14]. After collecting the fNIRS data, signal averaging of the three trials was performed for each condition. |
| The EEG data were recorded continuously (bandpass, 0.01–100 Hz; sampling rate, 2048 Hz; ActiveTwo system, BioSemi, Netherlands) using 32 scalp electrodes positioned over the whole scalp according to the 10–20 system (Fp1, Fp2, AF3, AF4, F7, F3, Fz, F4, F8, FC5, FC1, FC2, FC6, C3, Cz, C4, T7, T8, CP5, CP1, CP2, CP6, P7, P3, Pz, P4, P8, PO3, PO4, O1, Oz, and O2). According to BioSemi’s design, the reference electrode during acquisition was formed by a Common Mode Sense active electrode and a Driven Right Leg passive electrode. Vertical and horizontal electro-oculograms were recorded by attaching additional flat electrodes (Flat Active Electrode, BioSemi) below both eyes and at the outer canthi of both eyes. |
| The EMSE software suite (Source Signal Imaging, La Mesa, USA) was used for EEG data analysis. Ocular artifacts, such as blinks and large eye movements, were removed from data using a specially designed spatial filter in EMSE. Only artifact-free EEG data were used for analysis. The artifact-free EEG data were used as input for power spectrum analysis, which was segmented into successive 1-s windows, and Fourier transformation (FFT) with a Hanning window was applied to each segment. |
| Mu rhythm is a spontaneous characteristic feature of the electroencephalogram (EEG)/magnetoencephalogram (MEG) pattern that has 8-13 Hz activities that appear maximally over the central rolandic or sensorimotor area during a relaxed state. Mu rhythm is suggested to be present in 50-100% of healthy subjects [23], and is generally accepted as the idling rhythm engendered from the synchronized neurons involved in the thalamocortical loop [24,25]. The mu rhythm is attenuated by tactile stimulation, movement execution, and motor imagery, which are referred to as event-related desynchronization (ERD) [23,26,27]. Such ERD of mu rhythm, named mu ERD in this paper, are interpreted as the desynchronized activities of the activated neurons due to externally or internally paced events [21]. |
| The mu ERD was calculated using the well-known standard formula: |
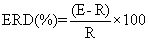 |
| where E indicates the mu power density during the event period and R indicates the mu power density during the baseline period. In the present study, the “event” period was the task period (from +1 s to +14 s), and the “baseline” period was the rest period before the task period (from +1 s to +14 s). After the mu ERD values of each condition and trial had been calculated, signal averaging of the three trials in the C3, Cz, and C4 was performed. |
| Statistical analysis |
| NIRS data: NIRS-SPM was used for fNIRS data analysis. NIRSSPM is an SPM [28] and MATLAB-based software package used for statistical analysis of NIRS signals, developed at the Bio Imaging Signal Processing laboratory, KAIST, Korea [18,19]. Noise was removed from the measurement data by wavelet minimum description length detrending [29], and SPM was performed using a generalized linear model. The level of significance was set at a p value of <5%. |
| EEG data: A repeated measure two-way analysis of variance was used to compare the mu ERD values for the observation, imagery, and execution of chopstick and hammer movements, and a Tukey post hoc test was also applied. Statistical analysis was performed using SPSS ver 17.0 (SPSS, Chicago, USA). The level of significance was set at a p value of <5%. |
| Results |
| NIRS data |
| For the chopsticks movement, a significant increase in oxyHb levels was observed in the regions corresponding to BA8, BA45, BA44, BA6, and BA1 during imagery and the regions corresponding to BA9, BA8, BA45, BA44, BA43, BA6, BA4, BA1, BA2, and BA40 during movement execution (p<0.05). No significant differences were observed during observation (Figure 2a, Table 1). |
| For the hammer movement, a significant increase in the oxyHb levels was observed in the regions corresponding to BA9, BA8, BA45, BA44, BA43, and BA6 during observation, in the regions corresponding to BA9, BA8, BA45, BA43, BA6, BA1, BA2, and BA40 during imagery, and in the regions corresponding to BA9, BA8, BA45, BA44, BA43, BA6, BA4, BA1, BA2, and BA40 during movement execution (p<0.05) (Figure 2b, Table 2). |
| For the chopsticks movement, the brain regions BA8, BA45, BA44, BA43, BA6, and BA1 exhibited a significant increase in the oxyHb levels during imagery and movement execution. For the hammer movement, the brain regions BA9, BA8, BA45, BA44, BA43, and BA6 exhibited a significant increase in the oxyHb levels during observation and movement execution. Imagery and execution correlated with a significant increase in the oxyHb levels in the brain regions BA9, BA8, BA45, BA44, BA43, BA6, BA1, BA2, and BA40. Finally, the brain regions where a significant increase in the oxyHb levels was observed during observation, imagery, and execution were BA9, BA8, BA45, BA44, BA43, and BA6. |
| EEG data |
| The mu ERD values for the execution of the chopsticks movement showed an increased trend compared with that for movement observation (C3, p=0.08; C4, p=0.04). Observation of the hammer movement produced a significant increase in the mu ERD values compared with that of the chopsticks movement (C3, p=0.03; Cz, p=0.04; C4, p=0.02) (Figure 3). |
| Discussion |
| Observation |
| The NIRS-SPM results showed a significant increase in the oxyHb levels in the dorsolateral prefrontal cortex, inferior frontal gyrus, and premotor cortex during the hammer movement, whereas no such increases were observed during the chopsticks movement. The mu ERD values increased significantly during the hammer movement compared with the chopsticks movement. The inferior frontal gyrus and premotor cortex are both involved in the mirror neuron system [30]. A mirror neuron is a nerve cell that fires when an individual executes an action and observes the same action being executed by another individual. The dorsolateral prefrontal cortex is activated when movements that match normal human movements are observed [31]. Previous studies have also shown that the mu ERD value for the sensorimotor regions increases during the observation of hand movements [32-35]. These studies indicate that during the observation of the hammer movement, the subjects were observing the footage of others performing the action while mentally simulating the same action. |
| The lack of a significant increase in the oxyHb levels during the chopsticks movement and the significantly smaller mu ERD values compared with the hammer movement suggested that first-person observation of the hammer movement was possible, but it was difficult to achieve first-person observation during the chopsticks movement. Therefore, the sensory modality recalled during movement observation is thought to differ between the hammer and chopstick movements. The hammer movement is dynamic; therefore, the strength and muscular senses are easily recalled during the observation of this movement. The chopsticks movement is a comparatively elaborate action and is difficult to recall. Studies have found that activation of the mirror neuron system requires information that is meaningful to the individual if that same individual is to recall the movement [36]. This suggests that different sensory modalities were recalled during the observation of chopstick and hammer movements and these modalities influenced the oxyHb levels and mu ERD values. |
| Imagery |
| The NIRS-SPM results showed a significant increase in the oxyHb levels in the dorsolateral prefrontal cortex, inferior frontal gyrus, premotor cortex, and primary somatosensory cortex during the chopstick and hammer movements, while an additional significant increase in the levels was observed in the left inferior parietal lobule during the hammer movement. The mu ERD values were obtained for the chopstick and hammer movements, but no significant difference was observed in these values between the two movements. Imagery can be divided into two main types: first-person (muscular sensory) imagery and third-person (visual) imagery. Studies have shown that the dorsolateral prefrontal cortex, inferior frontal gyrus, premotor cortex, primary somatosensory cortex, and inferior parietal lobule are activated during first-person imagery [6,37,38]. Moreover, the left inferior parietal lobule is activated more during first-person imagery than during third-person imagery [39]. The mu ERD values for the sensorimotor region also increased during the imagery of hand movements [40-44]. Therefore, the results suggest that the subjects were engaged in first-person imagery during the chopstick and hammer movements, where the subjects visualized themselves performing the actions. |
| Execution |
| The NIRS-SPM results showed a significant increase in the oxyHb levels in the dorsolateral prefrontal cortex, inferior frontal gyrus, premotor cortex, primary motor cortex, primary somatosensory cortex, and inferior parietal lobule during the chopstick and hammer movements. The mu ERD values were obtained for the chopstick and hammer movements, but no significant differences in these values were observed between the two movements. Studies have shown that the dorsolateral prefrontal cortex, inferior frontal gyrus, premotor cortex, primary motor cortex, primary somatosensory cortex, and inferior parietal lobule are activated during the execution of hand movements or the handling of tools [6,10,45]. The mu ERD values for the sensorimotor region is known to increase during the execution of hand movements [36,41,43]. Therefore, the brain activity detected in this study during the execution of chopstick or hammer movements supports the results obtained in previous studies. |
| Comparison of movement modes |
| The brain regions activated during the imagery and execution of the chopsticks movement were the dorsolateral prefrontal cortex, inferior frontal gyrus, premotor cortex, and primary somatosensory cortex, while the mu ERD values were obtained under both conditions. The brain regions activated during the observation and execution of the hammer movement were the dorsolateral prefrontal cortex, inferior frontal gyrus, and premotor cortex, while the mu ERD values were obtained under both conditions. The main brain regions activated during imagery and execution were the dorsolateral prefrontal cortex, inferior frontal gyrus, premotor cortex, primary somatosensory cortex, and inferior parietal lobule, while the mu ERD values were obtained under both conditions. Finally, the brain regions that were mainly activated under all three conditions, i.e., observation, imagery, and execution, were the dorsolateral prefrontal cortex, inferior frontal gyrus, and premotor cortex, while the mu ERD values were obtained under all three conditions. These results show that the brain activity was similar during the imagery and execution of the chopsticks movement, while a similar brain activity occurred during the observation, imagery, and execution of the hammer movement. Therefore, the brain activity during the imagery of tool utilization was similar to that when executing the movement and recalling elaborate actions, such as using chopsticks. In contrast, the results of this study suggest that first imagery and then observation produced a brain activity similar to that produced by movement execution when recalling the strength and muscular senses required during hammer use. |
| A number of previous studies have compared observation vs. execution and imagery vs. execution during tool use. Järveläinen et al. [9] measured brain activity during the observation and execution of tool use by magnetoencephalography and found similarities in the brain activity between observation and execution. Higuchi et al. [10] measured brain activity by fMRI during imagery and execution using 16 different types of tools. They also found similarities in the brain activity between the imagery and execution of tool use. These previous studies also compared observation and execution as well as imagery and execution of tool use; however, no clear conclusions about the brain activity between observation, imagery, and execution were made. Unlike previous studies, our study utilized an fNIRS/EEG system to measure brain activity during the observation, imagery, and execution of tool use. The results of our study suggest that similar brain activity occurs during the imagery and execution of tool use that requires the recollection of elaborate movements, such as the use of chopsticks, whereas the use of a hammer required the recollection of strength and muscular senses, which elicited similar brain activity during observation, imagery, and execution. |
| Previous studies that compared observation, imagery, and execution have included the measurement of the reaching movements of arms using fMRI [8], the reaching motion of the arm using virtual reality and fNIRS [46], wrist movements using fMRI [47], hand movements using transcranial magnetic stimulation (TMS) [48,49], finger movements using fMRI [7], ankle movements using fMRI [50], and the squatting movements of the lower limbs using the heart and breathing rates as indicators [51]. Each of these studies reported similar results under all three conditions. Therefore, this is the first study to simultaneously use fNIRS to measure cerebral blood flow during brain activity and EEG to measure the brain potential during the observation, imagery, and execution of movements involving tools. |
| The brain regions during tool use clarified in this study will present a fine target when the subjects will be trained with neurofeedback training in the future. The results of this study are valuable and may contribute toward the development of neurofeedback training that applies an fNIRS/EEG system to upper limb movements, particularly during tool use. Moreover, the brain regions during tool use clarified in this study will be able to present a fine target when the subjects will be trained with neurofeedback training in the future. |
| Limitations |
| The first limitation of this study was that only two tools were utilized. The limited number of tools studied may mean that the same results might not be produced with other tools, although this remains unclear. Second, there was no way of measuring the observation and/or imaginative abilities of each subject who performed in the observation and imagery tasks. Therefore, it is possible that the results may differ among subjects with variable observation/imagery abilities. Third, muscular activity was not measured by electromyography during each task. Thus, an effect of muscular activity on the observation or imagery results cannot be ruled out. Fourth, the conditions of observation, imagination and execution were not randomized. Therefore, future studies should consider these known limitations to further elucidate the brain activities involved during the observation, imagery, and execution of movements. |
| Acknowledgements |
| This work was supported by JSPS KAKENHI Grant Number 23500630. |
References
- Carr JH, Shepherd RB (2002) Stroke Rehabilitation: Guidelines for Exercise and Training to Optimize Motor Skill. (3rdedn), Butterworth-Heinemann Ltd. UK.
- Murata A, Gallese V, Luppino G, Kaseda M, Sakata H (2000) Selectivity for the shape, size, and orientation of objects for grasping in neurons of monkey parietal area AIP. J Neurophysiol 83: 2580-2601.
- Mulder T (2007) Motor imagery and action observation: cognitive tools for rehabilitation. J Neural Transm 114: 1265-1278.
- Ertelt D, Small S, Solodkin A, Dettmers C, McNamara A, et al. (2007) Action observation has a positive impact on rehabilitation of motor deficits after stroke. Neuroimage 36: T164-T173.
- Jackson PL, Lafleur MF, Malouin F, Richards C, Doyon J (2001) Potential role of mental practice using motor imagery in neurologic rehabilitation. Arch Phys Med Rehabil 82: 1133-1141.
- Gr�?¨zes J, Decety J (2001) Functional anatomy of execution, mental simulation, observation, and verb generation of actions: a meta-analysis. Hum Brain Mapp 12: 1-19.
- Macuga KL, Frey SH (2012) Neural representations involved in observed, imagined, and imitated actions are dissociable and hierarchically organized. Neuroimage 59: 2798-2807.
- Filimon F, Nelson JD, Hagler DJ, Sereno MI (2007) Human cortical representations for reaching: mirror neurons for execution, observation, and imagery. Neuroimage 37: 1315-1328.
- J�?¤rvel�?¤inen J, Sch�?¼rmann M, Hari R (2004) Activation of the human primary motor cortex during observation of tool use. Neuroimage 23: 187-192.
- Higuchi S, Imamizu H, Kawato M (2007) Cerebellar activity evoked by common tool-use execution and imagery tasks: an fMRI study. Cortex 43: 350-358.
- Mihara M, Miyai I, Hatakenaka M, Kubota K, Sakoda S (2008) Role of the prefrontal cortex in human balance control. Neuroimage 43: 329-336.
- Miyai I, Tanabe HC, Sase I, Eda H, Oda I, et al. (2001) Cortical mapping of gait in humans: a near-infrared spectroscopic topography study. Neuroimage 14: 1186-1192.
- Gwin JT, Gramann K, Makeig S, Ferris DP (2011) Electrocortical activity is coupled to gait cycle phase during treadmill walking. Neuroimage 54: 1289-1296.
- Mihara M, Miyai I, Hattori N, Hatakenaka M, Yagura H, et al. (2012) Neurofeedback using real-time near-infrared spectroscopy enhances motor imagery related cortical activation. PLoS One 7: e32234.
- Shindo K, Kawashima K, Ushiba J, Ota N, Ito M, et al. (2011) Effects of neurofeedback training with an electroencephalogram-based brain-computer interface for hand paralysis in patients with chronic stroke: a preliminary case series study. J Rehabil Med 43: 951-957.
- Oldfield RC (1971) The assessment and analysis of handedness: the Edinburgh inventory. Neuropsychologia 9: 97-113.
- Cope M, Delpy DT, Reynolds EO, Wray S, Wyatt J, et al. (1988) Methods of quantitating cerebral near infrared spectroscopy data. Adv Exp Med Biol 222: 183-189.
- Ye JC, Tak S, Jang KE, Jung J, Jang J (2009) NIRS-SPM: statistical parametric mapping for near-infrared spectroscopy. Neuroimage 44: 428-447.
- http://bisp.kaist.ac.kr/NIRS-SPM.html
- Hoshi Y, Kobayashi N, Tamura M (2001) Interpretation of near-infrared spectroscopy signals: a study with a newly developed perfused rat brain model. J Appl Physiol 90: 1657-1662.
- Strangman G, Franceschini MA, Boas DA (2003) Factors affecting the accuracy of near-infrared spectroscopy concentration calculations for focal changes in oxygenation parameters. Neuroimage 18: 865-879.
- Wolf M, Wolf U, Toronov V, Michalos A, Paunescu LA, et al. (2002) Different time evolution of oxyhemoglobin and deoxyhemoglobin concentration changes in the visual and motor cortices during functional stimulation: a near-infrared spectroscopy study. Neuroimage 16: 704-712.
- Arroyo S, Lesser RP, Gordon B, Uematsu S, Jackson D, et al. (1993) Functional significance of the mu rhythm of human cortex: an electrophysiologic study with subdural electrodes. Electroencephalogr Clin Neurophysiol 87: 76-87.
- Pfurtscheller G, Lopes da Silva FH (1999) Event-related EEG/MEG synchronization and desynchronization: basic principles. Clin Neurophysiol 110: 1842-1857.
- Suffczynski P, Kalitzin S, Pfurtscheller G, Lopes da Silva FH (2001) Computational model of thalamo-cortical networks: dynamical control of alpha rhythms in relation to focal attention. Int J Psychophysiol 43: 25-40.
- Kuhlman WN (1978) Functional topography of the human mu rhythm. Electroencephalogr Clin Neurophysiol 44: 83-93.
- Kozelka JW, Pedley TA (1990) Beta and mu rhythms. J Clin Neurophysiol 7: 191-207.
- http://www.fil.ion.ucl.ac.uk/spm/
- Jang KE, Tak S, Jung J, Jang J, Jeong Y, et al. (2009) Wavelet minimum description length detrending for near-infrared spectroscopy. J Biomed Opt 14: 034004.
- Molenberghs P, Cunnington R, Mattingley JB (2012) Brain regions with mirror properties: a meta-analysis of 125 human fMRI studies. Neurosci Biobehav Rev 36: 341-349.
- Casile A, Dayan E, Caggiano V, Hendler T, Flash T, et al. (2010) Neuronal encoding of human kinematic invariants during action observation. Cereb Cortex 20: 1647-1655.
- Avanzini P, Fabbri-Destro M, Dalla Volta R, Daprati E, Rizzolatti G, et al. (2012) The dynamics of sensorimotor cortical oscillations during the observation of hand movements: an EEG study. PLoS One 7: e37534.
- Schuch S, Bayliss AP, Klein C, Tipper SP (2010) Attention modulates motor system activation during action observation: evidence for inhibitory rebound. Exp Brain Res 205: 235-249.
- Calmels C, Jarry G, Stam CJ (2009) Changes in local and distant EEG activities before, during and after the observation and execution of sequential finger movements. Neurophysiol Clin 39: 303-312.
- Muthukumaraswamy SD, Johnson BW (2004) Changes in rolandic mu rhythm during observation of a precision grip. Psychophysiology 41: 152-156.
- Craighero L, Metta G, Sandini G, Fadiga L (2007) The mirror-neurons system: data and models. Prog Brain Res 164: 39-59.
- Lorey B, Pilgramm S, Bischoff M, Stark R, Vaitl D, et al. (2011) Activation of the parieto-premotor network is associated with vivid motor imagery--a parametric FMRI study. PLoS One 6: e20368.
- Solodkin A, Hlustik P, Chen EE, Small SL (2004) Fine modulation in network activation during motor execution and motor imagery. Cereb Cortex 14: 1246-1255.
- Lorey B, Bischoff M, Pilgramm S, Stark R, Munzert J, et al. (2009) The embodied nature of motor imagery: the influence of posture and perspective. Exp Brain Res 194: 233-243.
- Nam CS, Jeon Y, Kim YJ, Lee I, Park K (2011) Movement imagery-related lateralization of event-related (de)synchronization (ERD/ERS): motor-imagery duration effects. Clin Neurophysiol 122: 567-577.
- Yuan H, Liu T, Szarkowski R, Rios C, Ashe J, et al. (2010) Negative covariation between task-related responses in alpha/beta-band activity and BOLD in human sensorimotor cortex: an EEG and fMRI study of motor imagery and movements. Neuroimage 49: 2596-2606.
- Pfurtscheller G, Brunner C, Schl�?¶gl A, Lopes da Silva FH (2006) Mu rhythm (de)synchronization and EEG single-trial classification of different motor imagery tasks. Neuroimage 31: 153-159.
- McFarland DJ, Miner LA, Vaughan TM, Wolpaw JR (2000) Mu and beta rhythm topographies during motor imagery and actual movements. Brain Topogr 12: 177-186.
- Pfurtscheller G, Neuper C (1997) Motor imagery activates primary sensorimotor area in humans. Neurosci Lett 239: 65-68.
- Imazu S, Sugio T, Tanaka S, Inui T (2007) Differences between actual and imagined usage of chopsticks: an fMRI study. Cortex 43: 301-307.
- Holper L, Muehlemann T, Scholkmann F, Eng K, Kiper D, et al. (2010) Testing the potential of a virtual reality neurorehabilitation system during performance of observation, imagery and imitation of motor actions recorded by wireless functional near-infrared spectroscopy (fNIRS). J Neuroeng Rehabil 7: 57.
- Szameitat AJ, Shen S, Conforto A, Sterr A (2012) Cortical activation during executed, imagined, observed, and passive wrist movements in healthy volunteers and stroke patients. Neuroimage 62: 266-280.
- L�?©onard G, Tremblay F (2007) Corticomotor facilitation associated with observation, imagery and imitation of hand actions: a comparative study in young and old adults. Exp Brain Res 177: 167-175.
- Clark S, Tremblay F, Ste-Marie D (2004) Differential modulation of corticospinal excitability during observation, mental imagery and imitation of hand actions. Neuropsychologia 42: 105-112.
- Orr EL, Lacourse MG, Cohen MJ, Cramer SC (2008) Cortical activation during executed, imagined, and observed foot movements. Neuroreport 19: 625-630.
- Mulder T, de Vries S, Zijlstra S (2005) Observation, imagination and execution of an effortful movement: more evidence for a central explanation of motor imagery. Exp Brain Res 163: 344-351.
Tables and Figures at a glance
| Table 1 | Table 2 |
Figures at a glance
 |
 |
 |
| Figure 1 | Figure 2 | Figure 3 |
Relevant Topics
- Electrical stimulation
- High Intensity Exercise
- Muscle Movements
- Musculoskeletal Physical Therapy
- Musculoskeletal Physiotherapy
- Neurophysiotherapy
- Neuroplasticity
- Neuropsychiatric drugs
- Physical Activity
- Physical Fitness
- Physical Medicine
- Physical Therapy
- Precision Rehabilitation
- Scapular Mobilization
- Sleep Disorders
- Sports and Physical Activity
- Sports Physical Therapy
Recommended Journals
Article Tools
Article Usage
- Total views: 7726
- [From(publication date):
specialissue-2012 - Aug 29, 2025] - Breakdown by view type
- HTML page views : 3076
- PDF downloads : 4650