Building Livelihood Resilience Capacities of Pastoral Households towards Drought Disaster: The Case of Borana Zone of Southern Oromia Region, Ethiopia
Received: 21-Sep-2023 / Manuscript No. EPCC-24-114509 / Editor assigned: 25-Sep-2023 / PreQC No. EPCC-24-114509 (PQ) / Reviewed: 09-Oct-2023 / QC No. EPCC-24-114509 / Revised: 08-Mar-2025 / Manuscript No. EPCC-24-114509 (R) / Published Date: 15-Mar-2025
Abstract
Resilience is becoming a commonly driver of multifaceted catch-all agenda in all the sustainability and humanity sciences; in science policy interphase and in the formulation and implementation of development polices/program across all level, especially, in response to climate change. Objective of this study was to analyze the livelihood resilience capacity of the Borana pastoralists of Southern Oromia, Ethiopia towards drought of 2016. Data were collected from 290 households of Bulbuli villages/Gololcha of Dirree district and Dambi villages/Dikale of Yabello district in 2020. In the process, districts were purposely selected while villages/Gandas were selected through lottery methods of sampling techniques. In this study, Principal Component Analysis (PCA) method was used to analyze the data in RStudio tools/software. Unlike other many resilience studies; this study was categorized drought resilience in to the resilience process/drought preparedness practices and resilience outcome/resource endowment/ absorptive capacities of the household in all the data collection process and analysis. The findings of this study showed that use of indigenous weather knowledge, establishment and maintenance of water sources, rangeland management, livestock mobility and social support are among the drought resilience determinant practices that are employed by the Borana pastoral households’. Similarly, cattle, sheep, goats, camels, water and rangeland resources productivity were among the very important asset/absorptive capacity endowed by the pastoral households’. The values of the PCA factor loadings revealed that cattle and sheep were less resilient while goats, camels and rangeland productivity were more resilient to 2016 drought. Hence, drought resilience should be derived with safe innovative SMART preparedness/response and livelihood diversification to ensure productivity and sustainability of pastoral livelihoods.
Keywords: Drought preparedness; Resilient capacity; Drought resilience; Resilient community; Borana pastoralists; Oromia; Ethiopia
Introduction
Resilience is becoming a commonly driver of multifaceted catch-all agenda at all cross-scale phenomena. It was developed from the Latin word resilio which is to jump back to its previous state. Recently, it is widely used across all disciplines to denote the ability of a given system to resist and /or other wise to bounce back to its previous (and good) condition without losing its major elements and function after a disturbance/shock. Despite, the recent popularity of the concept of resilient in development; the use of resilience in analytical frameworks were begin with in the general theory of systems and later on widely used in ecology, engineering, psychology and epidemiology, etc.
In this regard, currently, the term resilience/resilient is the major crucial aspects of the studies within all disciplines of sustainability and humanity sciences and within the development practices and studies (of science-policy interphase) of the nations, systems, institutions, policies, programming and interventions and within the study of corporate/enterprises, community and individuals. In addition, it is becoming the priority area of development partners, governments, society and individuals in policy/strategy formulation and designing of development projects, especially, through associating all cross-scale issues of development and sectors with the aspects of disaster risk management and development. This study was mainly focused on the drought disaster resilience capacity of the Borana pastoral community of Southern Oromia, Ethiopia.
In this case, resilience theory proposes an ongoing preparedness practices to strengthen the system through using continuum of innovative capacities in multidimensional circumstances to resist shocks and/or to return to its appropriate original function/state after shocks. In this regard, innovative capacity is mainly focused in the making of the paradigm shift in decision/thought that are supported with the practices of improving known traditional six resilience capacities. Traditional resilience capacities includes anticipatory/ knowledge, mitigation/preparedness measures, absorptive (resource/ asset endowment), adaptive (adjusting the practices with the continuum of change) and advocating/working for transformative capacity (production system modification/examples to market oriented pastoralism) through collective social action capacities and through performing alternative state development society environment relations to sustainably strengthen the well-being of the structures of the system.
This implies that resilience is about change within the continuum of the change through the rational thought of innovative capacity without causing damage in the process of making response to keep and/or to maintain the original structures and proper functioning of a given system with in the domain and beyond in all dimension. In the process of resilience building any activities without in-depth knowledge/ emotional based damaging response could leads to the long vicious cycle of the scenario and continuous failure of the system. However, wrong responses could not completely impede continuum of constructive rational change (resilience) in the long run.
In this case, it is possible to say that resilience is sonorous with sustainability and accountability. Contrary, vulnerability to disaster is the results of the lack of capacity to sustain the system and lack of accountability for/of the sets within and beyond the domain of the system; and the resilience capacity denotes the recovering/re functioning capacity of a given system after disturbances in claim to the maintenances of the prototype of the original state of the entity/ structures with in the process of ensuring resilience. This implies that vulnerability to drought disaster is a function of susceptibility and sensitivity. In connection with this, understanding of the three major traditional resilience/vulnerability factors such as exposure, sensitivity, and adaptive capacity are mandatory in the process of designing successful drought/disaster preparedness and mitigation measures to ensure resilience with in the continuum of change.
Existing literature confirmed that drought resilience is maintained through well-articulated, multi-dimensional knowledge based, inclusive framework and proactive area specific drought risk reduction planning, preparedness, mitigation and collective social action approach than focusing only on the crises management/emotional based damaging and emergency responses. This indicates that resilience is mainly rest upon the rational and functional flexible decision making capacity of a given community through associating the real issues on the ground with the dynamic contexts of external and internal factors which could help to reduce shocks/impacts of drought risk /disaster and then hasten the bouncing back of the system after occurrence of a probable given disturbance/drought.
The first steps in understanding the resilience level of the systems are beginning with the identification of the potential risk/hazard threatening the system; susceptibility/vulnerability of the system to the probable occurrence of the risk, and resource endowment/copying capacity of the system to resist the adverse effects of the disaster/ capacity to proper re-functioning/bounce back of the system. Threat/ risk includes natural hazards such as drought, flood, disease outbreak; social/economical hazards such as market shock, conflict, etc., and technological hazards, etc. Susceptibility/vulnerability includes mainly lack of six traditional resilience capacities and lack of accountability to resist/to mitigate the risk and to recover from the disaster/ disturbance. Capacity includes the endowment of the traditional six resilience capacities by a given system.
The next steps requires, reducing the vulnerability of the system through designing appropriate inclusive emergency, mitigation, development policy; strategy, programme, projects, plan and activities to improve sustainability of the six traditional capacities such as the anticipatory, mitigation, absorptive, adaptive and transformative capacity, collective social network capacity and well-being of the entities/structures within and beyond the system.
Resilience of a community is the outcome of the cumulative effects of six capacities of the system. In this case, characteristics of resilience mode of anticipatory capacity includes the use of knowledge, technology, innovation, invention, SMART development planning and physical planning, input; good governance and strong institution, rational attitude/non-violent mind set, equity and just, capacity to adapt to the continuum of uncertainty and change, participation, appropriation of indigenous knowledge and values, production value add chains, high diversity, scaling up and scaling out, dynamism, social learning/practices, accountability and transparency, rule of law, etc.
Absorptive capacity is about the resource endowment/ fair access to main five or more livelihood capitals: Natural, social, financial, physical capital, political capital, technology, and etc. Mitigation/ development measure implies appropriate designing of short to long term development proposal and operation of activities with in the six capacities. Adaptive capacity implies modification of existing norm/ modalities to make more re-functioning the system with in the continuum of change. Adaptive capacity is the flexibility of a given system to undergo re-configuration to make more sustain its structures and functions within the dynamic continuum of external and internal environmental change and/or within the extent of adverse contexts. Transformative capacity implies shifting existing dominant process of norm of action/modalities in dimension with the prevailing continuum of change/condition, for example shifting to market oriented pastoralism, livelihood diversification, asset protection, financial protection, rural insurance, improved trade and finance, micro enterprise, innovation, irrigation/infrastructures, green-economy, discovery, exploration, value add chains, use of technology, innovation and invention, etc. In addition, transformative capacity includes using the principles of research-society-practices/production measures linkage, farmers-research-extension linkage and research and development linkage in all the aspects of measures and levels. A social network based resilience capacity implies the process of ongoing collective action to ensure well-being among all the sets/structures within/beyond the system within inclusive mind set.
Furthermore, in the third steps cross-scale based holistic development based approach of operational methods have decisive factors in the ongoing livelihoods decision making related to the elements of the resilience indicators: Anticipatory, mitigation, absorptive, adaptive, and transformative capacity, collective social actions capacity and well-being of the sets of the system. Resilience is a function of adaptive capacity and vulnerability. Resilience is the outcome of the subsequent drought preparedness of six traditional resilience capacities practices which are resulting in resisting the adverse effects of the shocks and/or speeding up the normal re functioning of the system aftershocks. Drought preparedness is not static; it is performed and/or revised periodically through associating variability of influential risk/threat/hazard factors with the dynamic continuum of livelihood resources/capitals in a given specific environment. In this regard, endowing/access to basic service and livelihood asset such as social, economic, human, political capital, physical and natural capitals are the basis in the process of ensuring resilience. In this regard, realization of resilient systems have demonstrated more through proper functioning of multidimensional attributes including reduced rate of poverty, effective governance and institution, balancing/addressing existing distorted dominant norms of action/process, collective local action, use of the recent international multilateralism model in all the aspects, stability, performance of pro poor inclusive development policy, justice and equity, participation, etc., through taking in to account specific dynamics in local reality.
Collective capacity/climax might including multilateralism in this case is the level of resilience that could maintain the well-being of the sets of its structures is the stage of flexibility of a given system to undergo re-configuration to make more sustain its structures and functions within the dynamic continuum of external and internal environmental change. Although there are many definition of resilience in the literature this study tried to synthesis/defines drought resilience using the Hollinig definition as the base. Here, this study is conceptualized resilience as the persistent ability of a system to reconfigure its capacity to respond better to the inevitable continuum of the dynamics of a change/to adapt to environmental shocks and re continue proper functioning without a major change to its original features in timely and in effective manner after stress/shock.
Since time immemorial, the context of the term resilience is accustomed among pastoralism. Pastoral scholars claim that the term resilience is synonyms with dominant literatures in pastoralism like the model of bounce back in the boom/bust drought cycles, disequilibrium ecology paradigm which incorporates ideas of resilience with the notions of flexibility and mobility that have decisive in pastoralism. As a theory, resilience of a given system is maintained through designing of area specific holistic development approach. In non-equilibrium environment, under poor technology and poor capital pastoralism is a viable livelihood/production system than other land use system. Among pastoralism, resilience is the outcome of the relationships, interconnections, networks and practices using decision making based on indigenous knowledge and cultures.
In this case, Little and Mcpeak, argued that as the notion of thresholds is critical to understanding the relevance’s of resilience to pastoralism and development. Indeed, Lybbert et al., argued the two key thresholds in pastoralism:
• The subsistence constraints.
• The herd size thresholds which played a key role in understanding pastoral systems and resilience.
Recently, especially, starting from 2011 the term resilience is contextualized with in the development agenda of the Horn of African dry lands to build resilient community towards drought that is exacerbated by the adverse effects of climate change as an option to the dominant paradigm of humanitarian emergency response. In this regard, increasing herd size to minimize total loss by drought, periodically mobility, indigenous governance, social network and support, drought/weather forecast, traditional by-law based rangeland and water point management and allocation, etc. are some of the traditional resilient strategies of Borana pastoralists towards drought. Hence, objective of this study was focused on the investigation of the 2016/17 severe drought disaster resilience capacity of the livelihoods’ of the Borana pastoral communities’ of Southern Oromia region, Ethiopia.
Materials And Methods
This study used quantitative data derived through household survey. In this case, purposive and lottery methods/sampling techniques were used to select the research subjects. In this regard, Borana zone and respective districts were purposively selected due to their vulnerability to recurrences/challenges of drought disaster, degradation of livelihood sources by drought and persistence modes/way of pastoral livelihoods/life. Next, lottery methods were used to select respective Kebeles and villages. In this case, Bulbuli village of Gololcha Kebele and Dambi village of Dikale kebele were selected to collect the required data through household survey. In Gololchaa village and Dikale vilage 87 and 95 households had resided, respectively; however, during the data collection period in April 2020 this study accessed only 75 and 70 households (total of 145 households) for data collection from both villages, respectively. The absenteeism was mainly due to social reason and mobility with livestock in search of pasture and water. Hence, panel data of 290 observations were collected from 145 households using closed ended survey questionnaires [1].
Data were collected from 145 (9 females and 136 males) households. In this case, closed ended household survey questioners which were focused on the variables/type of activities that were employed in the villages in the process of making ongoing recovery from the 2016/17 severe drought were used during data collection. In principle analyzing resilience level of a given system/an entity required panel data that constitute data of the same variables before and after the occurrence of the disaster. However, in all developing economies availability of panel data at the household level is very rare. Hence, this study used simultaneously, to collect 2016/before drought and 2020/after drought/households data using closed ended questionnaires constituted of the same variables. To minimize the loss of data, especially, with regard to the data of 2016 enough times were allocated while collecting the data from individual households. In addition, during the data collection, four local enumerators were participated in the data collection after receiving training on each variables of the study. Furthermore, traditionally, Borana pastoral community could make attention to (eager to memorize) the number of livestock an individual household had held before drought, number died by the drought and number of its livestock that were escaped the drought which were made an opportunity in the process of capturing necessary data required for this study. Hence, panel data of 290 observations were collected from 145 households using closed ended survey questionnaires. In this case, 145 observations were represented data before drought and 145 observations were represented data after drought of 2016 with respective data of different variables (22 drought preparedness variables and 15 resource endowment variables) from each of the 290 observations [2-4].
In this regard use of indigenous weather and scientific weather information, indigenous social network and social support, mobility, household asset endowment, Water harvesting and natural resource management, access to infrastructures, perception on policy and institution, access to social and economic services, access to finance and credit service, use of input supply and technology were among the variables on which the data were collected to identify the 2016/17 drought resilience level of the households livelihoods in the study are. In addition, data were collected on the dimension of livelihood diversification, on the extent of livestock production for market oriented pastoralism, and on food security, etc. The details of the variables used for data collection can be seen from the Table 1 [5,6].
| No | Description of variables |
Unit |
DS |
| 1 | Use of Indigenous Weather Information (IWI) |
Extent |
HH |
| 2 | Use of Scientific Weather Information (SWI) |
Extent |
|
| 3 | Mobility during drought-mobility. |
Extent |
HH |
| 4 | HH asset/communal asset: Cattle, sheep, goat, camel, poultry, equine, crop productivity, water, rangeland and farm land-HH asset. |
Number |
HH |
| 5 | Functionality of indigenous ways of life/living, social/cultural network, IK based asset/livelihood governance, risk management and social support-IK |
Ext |
HH |
| 6 | Natural resource, water harvesting, and rangeland. management-WNRLM |
Extent |
HH |
| 7 | Social and economic infrastructures-infrastructures. |
% C |
HH |
| 8 | Grassroots level/community centered inclusive policy, improved local level decision making capacity through sound full public and stakeholder participation, functional legal framework; accountability, transparency, effectiveness, efficiency, democracy, good governance, impartiality and extent of institution at all level, policy and institution |
Extent |
HH |
| 9 | Access of the community to social and economic service delivery; water, healthy, extension service, irrigation, market, trade, cooperatives/union, input supply service, etc.)-services |
% age |
HH |
| 10 | Access to bank, micro-finance, credit, insurance-finance service and financial protection |
Extent |
HH |
| 11 | Access to primary, secondary and tertiary education, research center, etc.,-education |
Cover |
HH |
| 12 | Access to production enhancing input, technology, information and communication, TV, radio, internet, data, capacity building, etc.,-technology |
Extent |
HH |
| 13 | Attitude of local communities towards livelihood diversification, agro-industry (sugar-cane, beverage crop production, etc,)-diversification |
Extent |
HH |
| 14 | Local level market oriented production (mining, gum, commercial crop farming, horticulture, commercial fodder production, livestock selling and market oriented pastoralism-production for market and trade |
Extent |
HH |
| 15 | Status of multidimensional-innovation, structural change in economy; settlement, well land use plan, local based planned urban development, industry, technology, agriculture, trade, social protection, community based organization, expansion of local producers based enterprise and company, improved means of production, natural and manmade disaster management, etc.,-innovation |
Extent |
HH |
| 16 | Informal daily labor, charcoal and firewood selling-Destitution |
Extent |
HH |
| 17 | Vulnerability to drought, flood, market shock, disease outbreak, violence, conflict, war, etc.–peace and stability |
Extent |
HH |
| 18 | Food Security-FS |
Extent |
HH |
Table 1: List of households’ drought resilience variables.
Data analysis
This study used Principal Component Analysis (PCA) data analysis technique. Principal Component Analysis (PCA) is a multivariate type of data analysis technique. It is applied in all disciplines. In this regard, PCA transforms data; identify patterns, similarities and differences in the data set and help to predict/project phenomena. It is among the old type of adaptive data analysis techniques used to minimize large data with many observations and variables in to small manageable representative new data with minimized dimensions (without losing its original features) in the components; and alongside increase its interpretability [7].
However, its popularity grows in the recent later decades simultaneously with the beginning of the use of electronic computer which make ease the computational problem of large data. In this process PCA reduces the complex large data set in to manageable dimension of small components of new data set without losing its statistical information in the original data [8].
Analysis and interpretation is done using new and reduced data set. This means that PCA ‘preserving as much variability as possible’ translates into finding new variables that are linear functions of those in the original dataset, that successively maximize variance which are uncorrelated with each other [9,10]. PCA is defined as an orthogonal linear transformation that re-expresses multivariate data. It extracts and displays the greatest variance in a data on the first axis (called the first principal component), the second greatest variance on the second axis (which is orthogonal to the first) and so on.
In addition, PCA is mainly used for the analysis and prediction of descriptive statistics with large observations and variables. In this case, PCA created new uncorrelated variables of data with descending order of maximum variance. The variance explained the proportion of the percentage of the variation in the original data. PCA can be based on either the covariance matrix or the correlation matrix. Finding of such new variables called the Principal Components (PCs), reduces to solving an eigenvalue/eigenvector problem. Its aim is to reduce a larger set of variables into a smaller set of 'new' variables, called 'principal components', which account for most of the variance in the original variables. The PCA aims to combine various correlation indicators to include as much information as possible for each original dataset. In particular, it efficiently recognizes data patterns to minimize information loss while reducing the high dimensionality of the dataset.
This study was only focused to amylase the recovery status/resilience capacity of the variables/livelihood sources of the study area after the severe drought of 2016/17 using PCA factor loadings and cumulative variability of PCA values in percentage. In the majority of the cases If the proportion of a given variable PCA factor loadings is below 0.5 it denotes that the concerned variable was not resilient to the aforementioned drought disaster of 2016/17. In addition, depending on the original total quantity of the given variables of data before and after the drought; individual researcher could decide the dimensions/ interpretations of the values of the factor loadings [11].
Resilience analysis required a long periods/continuous decades of household livelihoods data, especially, quantitative data of every and each disaster cycles of before and after the disaster of the concerned specific area.
However, due to lack of long period of drought cycles data on the required resilience variables and observations/households socio economic data/this study subjected to undertake analysis of resilience capacity only based on the households’ data of 2016/17 drought. Hence, the analysis was only reflecting the recovery/resilience capacity of the households’ livelihoods towards 2016/17 drought depending only on the variation of household data of before and after 2016/17 drought in the study area.
In this regard, this study used PCA to analyze list of panel data collected from 290 observations/pastoral households (75 from Dirre woreda and 70 from Yabello woreda) to identify the resilience level of the households livelihoods against 2016/17 drought. The data were arranged in 290 observations/rows with respective data of 22 and 15 drought preparedness and resource endowment variables, respectively, in columns with excel format. The panel data constitute households’ quantified information on drought resilience variables in two times intervals. Information on 145 observations were represented data before drought of 2016 and the rest 145 were represented data after drought/April 2020. This study used XLSTAT analytical solver software to analyze PCA based drought resilience status of the study area. In this regard, PCA were creating one index variable (or a few) from a set of variables. This index variable was a weighted average of the original variables.
In this case, the standard framework for PCA as exploratory data analysis mechanisms includes a dataset with observations on p numerical variables, for every one of n objects or entities. These data values describe an n × p-data matrix X, whose jth column is the vector xj of observations on the jth variable. In this case, PCA seek a linear combination of the columns of matrix X with maximum variance. This linear combinations are given by equation:
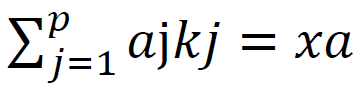
Where a is a vector of constants a1, a2, ..., ap. The variance of any such linear combination is given by var (Xa)=a’ Sa, where S is the sample covariance matrix associated with the dataset and ‘ denotes transpose. Hence, identifying the linear combination with maximum variance is equivalent to obtaining a p-dimensional vector a maximizes the matrix form a ‘Sa. In this process, for this problem to have a well-defined solution an additional restriction is set.
One of such restriction includes identifying an Eigenvalues of the matrix. Eigenvalue can be termed as characteristic value, characteristic root, proper values or latent roots as well. Eigen values represent the total amount of variance that is explained by the PCA using a given original data. The dimension of Eigen value in a scree/scatter/biplot is positive or negative in theory. However, Eigenvalues with a value of greater than zero have a good sign of prediction. Eigenvalue is a scale that is used to transform the eigenvector which is given by the equation:
Sa- λa ⇆ Sa- λa (2)
Thus, a is eigenvector, and λ is the corresponding eigenvalue, of the covariance matrix S.
The best n-point approximation to the scatterplot, in a q dimensional subspace is where the sum of squared distances between corresponding points in each scatterplot is minimized, as in the original approach by Pearson. This property of singular value decomposition implies interesting geometric interpretations of a PCA. Given any rank r matrix Y of size n × p, the matrix Yq of the same size, but of rank qequation
Where,
Lq is the q × q diagonal matrix with the first (largest) q diagonal elements of L and Uq, A’q’ are the n × q and p × q matrices obtained by retaining the q corresponding columns in U and A.
In this case, the quality of any q-dimensional approximation can be measured by the variability associated with the set of retained PCAs. Hence, the standard measure of quality of a given PCA is the proportion of total variance that it accounts for, which is represented by the equation:
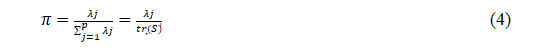
Where tr(S) denotes the trace of S. The incremental nature of PCs also means that we can speak of a proportion of total variance explained by a set S of PCs (usually, but not necessarily, the first q PCs), which is often expressed as a percentage of total variance accounted for: ∑jesπj * 100%
In this case, it is common practices to use some predefined percentage of total variance explained to decide how many PCs should be retained (70% of total variability is a common), although the requirements of graphical representation often lead to the use of the first two or three PCs. Even in such situations, the percentage of total variance accounted for is a fundamental tool to assess the quality of these low-dimensional graphical representations of the dataset. The emphasis in PCA is almost always on the first few PCs, but there are circumstances in which the last few may be of interest, such as in outlier detection or some applications of image analysis.
Results And Discussion
This study tried to identify the determinants of resilience and the resilience capacities of the resources endowed/asset endowed/ by the pastoral households in the study area. In this regard, out of the 22 original variables loaded in to PCA; PCA output retained only values of five very important variables of the determinants of resilience in a linear based decreasing/increasing order that were employed by the study area pastoralists. PCA outputs have retained only the variables with significant values of variance among observation with cumulative multidimensional impacts over the other variables in the component. This implies that those of the PCA output of the retained five determinants of resilience/preparedness activities that were traditionally used in the study area have multidimensional cumulative impacts on the other activities employed by the households. These five determinants of resilience that were retained in PCA output in linear based decreasing/increasing order were includes indigenous weather forecasting, maintenances and establishment of traditional water points, rangeland management with its periodical allocation along livestock categories, mobility and social networks and support.
Similarly, out of 15 absorptive capacities/resources endowed by the households that were loaded to the PCA only five very important variables that have cumulative impacts on the other variables and with high variability value among the observations were retained by the PCA. Those of the variables with high variability were cattle, sheep, goats, camels and rangeland productivity. Although Gololcha and Dikale villages’ cattle holdings were not resilient to the drought of 2016 with PCA factor loadings of -0.42 and -0.57, respectively, its cumulative PCA output with variability value of 87% and 54% still showed its importance and its multidimensional impacts over the other variables in the components. In this study PCA output values showed that cattle and sheep were not resilient to drought of 2016 whereas goats, camels and rangeland productivity were resilient to the drought of 2016 [12].
Drought preparedness practices
This section was focused on the analysis of the determinants of the resilience capacities/preparedness activities of the households in the study area. In this case, HH responses on the 22 variables/drought preparedness practices such as use of indigenous weather forecasting knowledge in the process of livelihood decision making, establishment and maintenance of water points, rangeland management, mobility, social support and networks, production for market oriented pastoralism, pity trade, micro and small enterprise, saving cash in bank, crop farming, access to and use of production enhancing input and technology, access to health, education, market, cooperatives, extension service, credit service, rural insurance, irrigation, communication service/ information, use of scientific weather information, good governance and justice were loaded in to PCA. As it can be seen from Tables 2-6; and Figures 1-4 of Gololcha village; PCA output retained 9 and Dikale village PCA output retained 8 very important drought preparedness livelihood activities/variables out of the 22 original variables which were routinely performed in the study area in the process of ensuring drought resilience. In this case, PCA output retained only those variables/livelihood activities which their values revealed significant variation before and after the drought among the observation. In addition, as it can be seen from Figures 1 and 4; PCA output retained very important variables with in linear order variance value in descending/ascending order.
| Resource endowment/asset | Drought preparedness practices | |||||||||
| Cattl e |
Sheep | Goat s |
Camels | RP | IWK | MOB | SNS | RM | ABS | |
| Golocha | -0.429 | -0.571 | 0.286 | 0.286 | 0.286 | -0.286 | 0.2 | 0.2 | 0.3 | 0.3 |
| Dikale | -0.571 | -0.286 | 0.143 | 0.143 | 0.286 | -0.333 | 0.333 | 0.111 | 0.222 | 0.444 |
Table 2: PCA factor loadings value of the drought resilience data set of the study area.
In this case, drought preparedness activities that were highly performed before and after the drought of 2016 with high cumulative impact over the other variables with in the component were represented by high variance values in the PCA output. As it can be seen in Figure 1. Indigenous weather forecasting knowledge which was represented by F1 in PCA have eigenvalues of 131 with the cumulative variability of 87%.This implies that its cumulative role over other activities/variables with in the component and use of IK weather knowledge for livelihood decision making role was decreased by 13% in 2020 after the previous drought. However, still IK based weather forecasting has cumulative leading role with 87% variability in livelihood decision making over the other activities undertaken by the household with in the component in the process of drought resilience. This implies that to make decisions of timely mobility in escaping from drought, in the management of traditional water points and rangeland management, sell of livestock, reservation of dry season grazing /seasonal based resource allocation for different livestock categories, in making social support and for making of opportunistic farming, etc., still now Borana pastoralists use indigenous weather forecasting knowledge in decision making process.
Traditionally, based on weather information decision making; the first important livelihood activities that were employed by the Gololcha and Dikale villages pastoral households were establishment and maintenances of water points (traditional eela or ponds) which was represented in Figures 1 and 4 by F2 in PCA with eigenvalues of 12 and 2 and variability of 8% and 2%, respectively. This implies that extent of water points and rangeland management, establishment of new water points; and mobility for search of water and pasture were increased by 8% and 2% after drought of 2016 in the villages, respectively. The next activities that were undertaken by Gololcha and Dikale villages’ pastoralists were rangeland and natural resource management which was represented in Figures 1 and 4 by F3 with eigenvalues of 2 and 0.5 and with variability of 1% and 0.3%, respectively.
Mobility and social supports are the next most important activities employed by the study area pastoralists that are retained by the PCA output. Access to education, health, agricultural extension, crop farming and market oriented pastoralism and others variables/practices were revealed below 1 eigenvalues and variability of below 0.3% in both villages. PCA output was not retained values of households cash saving in bank, access to rural finance, trade, use of scientific weather information, rural insurance, irrigation, etc . This is due to the fact that PCA do not predict values of the variables with very law variance/ with continuous values in the original variables/ with similar variance values among the observations in the list.
As it can be seen from the Table 2. PCA output factor loadings retained only five very important activities/variables (in linear orders that arranged from high to law or low to high) employed by the households in the study area out of 22 original variables. In this regard, Gololcha and Dikale villages PCA factor loadings values vis à-vis of the use of indigenous weather knowledge showed -0.28 and-0.33 which implies that correlation of the use of IK weather forecast before and after the drought of 2016 was decreased from 1 to about 0.72 and 0.67, respectively. In both villages SNS (Indigenous social support and cash transfer based on public work) was declined after the drought of 2016 up to 2020. In addition, PCA factor loadings values of both villages regarding access to basic services were 0.300 and 0.444, respectively. This designates that as the quality and coverage of basic services such as healthy, credit, transport, insurance, irrigation, access to water, livestock market information and cooperatives, etc., were very poor in the study area.
Resource endowment/absorptive capacity
This section was focused on the analysis of the resilience capacity of the household assets/resources towards 2016 drought. In this case a total of 15 variables such as size of household cattle, sheep, goat, camels, annual rangeland productivity, annual income from sell of livestock and livestock product, household farm land size in hectares, annual household crop productivity, annual income from trade, annual income from remittance, annual income from off-farm activities, total annual expenditures and annual net cash saving and annual food security status of the households were loaded in to the PCA.
In this regard, in Golocha and Dikale villages from the total original 15 variables; PCA output values retained only five very important variables with high variance (in linear order from the high to law or low to high) that were endowed by the household of the study area before and after drought of the 2016. In principle, the first three to five variables with high variance in the components of PCA output are the variables with high score in the original variables and have cumulative multidimensional impacts on the entire of the variables in the components. This implies that those of the first to three or five PCA output based retained variables are the very important livelihood resources that are employed by the household of the study area. In this case, as it can be seen from Tables 4 and 5; and Figures 2 and 3 PCA output values of cattle of Gololcha and Dikale were represented by F1 with eigenvalues of 106.5 and 74 and with variability of 71% and 57%, respectively. This implies that in 2020 households in Gololcha and Dikale villages had endowed only 71% and 57% of the proportion of their 2016 cattle size. However, still cattle were the main dominant livelihood sources with high variance/high variability with high multidimensional cumulative impact on the other variables in all the component of the PCA output in the study area. The second variables with high variability/variance was sheep with declining proportion in percentage in 2020. Contrary to this, as it can be seen from Tables 3-5 and Figures 2 and 3 PCA output values of Gololcha and Dikale villages goats were retained with eigenvalues of 14 and 11 and with variability of 9.5% and 8%, respectively. This implies that in Gololcha and Dikale size of goats were increased by 9.5% and 8% respectively, in 2020 against its size before 2016. Similarly, size of camels was increased by 9.5% and 3% in Gololcha and Dikale, respectively. The fifth variable retained by the PCA output value was rangeland productivity. The rest variables such as annual income from livestock and livestock product sell, household farm land in hectares, annual household crop productivity, annual income from trade, annual income from remittance, annual income from off-farm activities, total annual expenditures and annual net cash saving and annual food security status were not retained by the PCA output. In principles PCA retained variables that are revealed significant variation in values among the observation before and after the specified period. This indicates that those of the variables were more or less had continuous in their values before the 2016 drought and during the data collection in 2020.
Similarly, PCA factor loadings were retained only values of the five variables such as cattle, sheep, goats, camels and rangeland productivity in both villages. In this regard, as can be seen from Table 2 PCA factor loadings value of Gololcha and Dikale cattle endowment were -0.429 and -0.571, respectively. This implies that cattle were more resilient in Gololcha of Dire district while it is not resilient in Dikale of Yabello districts. In contrary, goats had showed increment by 0.286 and 0.144 in Gololcha and Dikale, respectively. In both villages, goats and camels were more resilient to drought of 2016 when compared to cattle and sheep.
|
|
F1 |
F2 |
F3 |
F4 |
F5 |
F6 |
F7 |
F8 |
F9 |
|
Eigenvalue |
131.332 |
12.653 |
1.856 |
1.19 |
0.952 |
0.834 |
0.672 |
0.397 |
0.114 |
|
Variability (%) |
87.554 |
8.435 |
1.237 |
0.794 |
0.635 |
0.556 |
0.448 |
0.265 |
0.076 |
|
Cumulative % |
87.554 |
95.99 |
97.227 |
98.02 |
98.655 |
99.211 |
99.659 |
99.924 |
100 |
Table 3: Gololcha drought preparedness practices PCA output values.
Scree plot of PCA output cumulative variability (%) and Eigenvalue of Gololcha drought preparedness is displayed in Figure 1.

Figure 1: Scree plot of PCA outputcumulative variability (%) of Gololcha drought preparedness.
| F1 | F2 | F3 | F4 | F5 |
| 106.534 | 15.72 | 14.378 | 12.356 | 1.012 |
| 71.023 | 10.48 | 9.585 | 8.237 | 0.675 |
| 71.023 | 81.503 | 91.088 | 99.325 | 100 |
Tables 4: Gololcha household resource endowment/assets PCA output value.
Screeplot of PCA outputcumulative variability (%) and Eigenvalue of Gololcha HH resource displayed in Figure 2.

Figure 2: Gololcha resource endowment scree plot.
Screeplot of of PCA outputcumulative variability (%) and Eigenvalue of Dikale HH drought PP is displayed in Figure 3.

Figure 3: Dikale preparedness practices PCA output value.
|
|
F1 |
F2 |
F3 |
F4 |
F5 |
F6 |
F7 |
F8 |
|
Eigenvalue |
136.293 |
3.036 |
0.519 |
0.402 |
0.32 |
0.256 |
0.124 |
0.051 |
|
Variability (%) |
96.662 |
2.153 |
0.368 |
0.285 |
0.227 |
0.182 |
0.088 |
0.036 |
|
Cumulative % |
96.662 |
98.814 |
99.183 |
99.468 |
99.694 |
99.876 |
99.964 |
100 |
Table 5: Dikale drought PP PCA output value.
|
|
F1 |
F2 |
F3 |
F4 |
F5 |
|---|---|---|---|---|---|
|
Eigenvalue |
77.156 |
46.107 |
11.434 |
5.006 |
1.297 |
|
Variability (%) |
54.72 |
32.7 |
8.109 |
3.55 |
0.92 |
|
Cumulative % |
54.72 |
87.42 |
95.529 |
99.08 |
100 |
Table 6: Dikale household resource endowment PCA value.
Screeplot of PCA outputcumulative variability (%) and Eigenvalue of Dikale HH resource endowment is displayed in Figure 4.

Figure 4: Dikale resource endowment PCA output value.
Quality/performance of the PCA output values
PCA literatures argued that if the first three to five variables in the component have cumulative variance of 70% and more values it revealed that the PCA output values illustrated a promising potential of predicting the variable under concern among the observation in the list. In this regard all the PCA output values of the resource endowment and drought preparedness variables of both villages showed more than 70% cumulative variability/variance in the first three to five variables. This implies that the first five variables had cumulative multidimensional impacts on the rest of the other variables within the components.
Conclusion
This study identified that although cattle were not resilient to 2016 drought it has still high cumulative multidimensional impacts on the rest of the variables in the components. Goats and camels were more resilient to 2016 drought in the study area. Cattle, sheep, goats, camels, water and rangeland resources productivity are among the very important pastoral households’ asset/absorptive capacity and their variability revealed significant variation after the drought of the 2016 with multidimensional cumulative impacts on the other variables in the components. The other pastoral household variables/asset showed low variability/variance in the PCA output according to their importance in ensuring drought resilience in decreasing order were not retained in the PCA output. However, all the 15 variables loaded in the components were mandatory for the households in the study area. This implies that resilience is the outcome of collective action in all the components. In this case, variance of the asset/variables not retained in the PCA output (those out of the five variables with in linear order and having cumulative impacts on the variables not retained) were explained/pulled in to the first five very important variables/asset with high variation among the observation/households.
Similarly, PCA output revealed that drought preparedness activities such as indigenous weather forecasting, traditional water maintenance and establishment, rangeland management and allocation of livestock category according to pasture availability and accessibility, mobility and social network/support are the determinants of drought/drought preparedness activities that were employed by the households of the study area with high multidimensional cumulative impacts over the rest of the preparedness practices.
Recommendations
Resilience is about making positive/constructive change within the inevitable continuum of all multidimensional nature and manmade based change (in our case drought exacerbated by anthropogenic effect) to ensure the sustainability of a given livelihoods/entity/system. Hence, drought resilience should be derived with safe innovative livelihood diversification and has to be guided by the SMART planning and holistic preparedness/response and should be without causing any shock to any entity in the process. However, any wrong emotional short term based emergency response could leads to the vicious cycle of the scenario, however, wrong action do not completely impede continuum of required change (resilience) in the very long run. Hence, any process in drought resilience preparedness taken towards drought should be multidimensional and inclusive to strengthen the resilience in sustainable manner. Continuous and further study will also require to have an up-to-date information on the resilience dimension of the study area.
Specifically, this study forwarded the following recommendation for future action with regard to drought resilience in the study area.
• Being resilient is an outcome of multidisciplinary efforts and actions. Hence, mainstreaming drought resilience planning and its implementation among all sectors/stakeholders in the study area can strengthen the livelihood resilience of the Borana community.
• Working for innovative drought preparedness practices and livelihood diversification will strengthen the drought resilience capacities of the community in the study area in sustainable basis instead of focusing on emergency response.
• Making structural changes on the dominant norms of action through market oriented pastoralism, Index/weather Based Livestock Insurance (IBLI), expansion of rural credit and rural finance, enhancing producer/pastoralist based livestock trade and export, micro and small enterprise, cooperatives, improving access to basic service, enhancing culture of selling livestock and saving cash in Bank, collective social action and social support, etc can improve the transformative resilience capacity of the Borana pastoralists. In line with this establishment and maintenance of water sources, rangeland management, herd diversification, opportunistic crop farming will enhance the resilience capacity of pastoral community, strengthening social network and support; and enhancing livestock mobility during severe drought could improve the resilient capacity of the community, etc.
References
- Abel N, Wise RM, Colloff MJ, Walker BH, Butler JR, et al. (2016) Building resilient pathways to transformation when “no one is in charge” insights from Australia's Murray-Darling Basin. Ecol Soc 1: 2.
- Alraggad M, Johnsen-Harris B, Shdaifat A, Hamaideh A (2017) Groundwater resilience to climate change in the Eastern Dead Sea Basin Jordan. Sci Res Essays 12: 24-41.
- Birhanu Z, Berhanu N, Ambelu A (2015) Rapid appraisal of resilience to the effects of recurrent droughts in Borana zone, Southern Ethiopia, Jemma University, Ethiopia.
- Petit FD, Bassett GW, Black R, Buehring WA, Collins MJ, et al. (2013) Resilience measurement index: An indicator of critical infrastructure resilience. Argonne National Lab.(ANL), Argonne, IL United States.
- Arjjumend H (2018) Review of pastoralists’ resilience and adaptation to climate change: Can technology help pastoralists mitigate the risks? Int J Stress Manag 9: 118-128.
- Bahta YT (2022) Nexus between coping strategies and households’ agricultural drought resilience to food insecurity in South Africa. Land 11: 893.
- Bahta YT, Myeki VA (2021) Adaptation, coping strategies and resilience of agricultural drought in South Africa: Implication for the sustainability of livestock sector. Heliyon 7
[Crossref] [Google Scholar] [PubMed]
- Basiago AD (1998) Economic, social, and environmental sustainability in development theory and urban planning practice. Environmental 19: 145-161.
- Bega D, Gramaglia M, Fiore M, Banchs A, Costa-Perez X (2020) AZTEC: Anticipatory capacity allocation for zero-touch network slicing. IEEE 6: 794-803.
- Berhanu W (2011) Recurrent shocks, poverty traps and the degradation of pastoralists’ social capital in southern Ethiopia. Afr J Agric Res 6: 1-5.
- Berhanu W, Beyene F (2015) Climate variability and household adaptation strategies in southern Ethiopia. Sustainability 7: 6353-6575.
- Tadic L, Brlekovic T, Potocki K, Leko-Kos M (2021) Application of principal component analysis to drought indicators of three representative Croatian regions. 12: 41-55.
Citation: Dinsa AB, Wakjira FS, Demmisie ET, Negash TT (2025) Building Livelihood Resilience Capacities of Pastoral Households towards Drought Disaster: The Case of Borana Zone of Southern Oromia Region, Ethiopia. Environ Pollut Climate Change 9: 429
Copyright: © 2025 Dinsa, et al. This is an open-access article distributed under the terms of the Creative Commons Attribution License, which permits unrestricted use, distribution and reproduction in any medium, provided the original author and source are credited.
Select your language of interest to view the total content in your interested language
Share This Article
Recommended Journals
Open Access Journals
Article Usage
- Total views: 251
- [From(publication date): 0-0 - Nov 16, 2025]
- Breakdown by view type
- HTML page views: 162
- PDF downloads: 89