Carbon Stock Assessment in the Vegetation of the Chitteri Reserve Forest of the Eastern Ghats in India Based on Non-Destructive Method Using Tree Inventory Data
Received: 30-Mar-2014 / Accepted Date: 21-Apr-2014 / Published Date: 24-Apr-2014 DOI: 10.4172/2157-7617.S11-001
Abstract
Carbon stock assessment in the vegetation of forest ecosystems has attracted worldwide attention following their role in the mitigation of greenhouse gas and climate change. The aim of the present study was to assess the total carbon stock of trees in the Chitteri reserve forest of the Eastern Ghats in India, based on tree inventory. The entire stretch of the forest covering 742 km2 area was divided into twenty grids of 6.25 km × 6.25 km, and from each grid a transect of size 5 m × 1000 m was established. A total of 5022 live trees (≥ 9.5 cm diameter at breast height) representing 143 species were inventoried from the twenty transects (totaling 10 ha). Carbon stock of each tree was determined by a non-destructive method following standard allometric equation using the tree diameter. The total carbon stock of the tree vegetation for the 10 ha sampled in the Chitteri reserve forest was 585.50 tonnes. The average carbon stock for the twenty 0.5 ha transect was 29.28±21.7 tonne. The minimum and maximum carbon stock estimated for the 20 transects was 1.98 t/0.5 ha and 76.89 t/0.5 ha, respectively. The average carbon stock sequestered by a single tree was 0.12±0.24 t/tree. The maximum carbon value was observed for Mangifera indica (1.73 t/tree) and the minimum was for Glycosmis pentaphylla (0.01 t/tree). However, overall contribution to the total carbon stock of tree vegetation in the Chitteri reserve forest was observed greater for Memecylon edule (8.5 %), followed by Canthium dicoccum var. dicoccum (7.4 %), Anogeissus latifolia (6.4 %), Albizia amara (4.9 %) and Mangifera indica (4.4 %). A significant strong positive relationship was observed between carbon stock with tree density (R2=0.689), but not with tree diversity (R2=0.422) and with altitude (R2=0.399) of forest location.
Keywords: Chitteri reserve forest; Carbon sink; Eastern ghats; Forest ecosystem; Tree vegetation
10581Introduction
Carbon dioxide increase is attributed mainly to fossil fuel combustion and deforestation worldwide [1]. The current atmospheric carbon concentration is 397.60 ppm [2]. It is well known that the global climate is changing drastically as a result of natural as well as anthropogenic activities. Development as well as transportation activities is increasing the atmospheric concentration of greenhouse gases especially carbon dioxide [3]. Undoubtedly, climate change is one of the few global issues to receive more attention from the scientific communities in recent years.
Forest ecosystem plays a vital role in the global carbon cycle. Vegetation of global forests covers approximately 27 % of the earth’s land surface, but they form an active carbon sink that accounts for 60 % of the total carbon stored in the earth’s land surface [4]. However, unprecedented increase in anthropogenic activities due to globalization and subsequent industrialization and urbanization lead to a drastic decline and degradation of forest ecosystems of the world [5]. Protecting carbon stocks in the existing forest vegetation have become important to mitigate the increasing carbon dioxide concentration in the atmosphere [6].
Trees are one of the prime components of forest ecosystems besides acting as a major carbon dioxide sink that captures carbon from the atmosphere and storing it in fixed woody biomass by photosynthesis during the growth process. Although, India has a diverse range of forests covering 64 million hectares, no proper carbon assessment and management systems are available to quantify the carbon pool and their regional variation. Hence, the present study is an attempt to assess the total carbon stock of the Chitteri reserve forest of the Eastern Ghats in India.
Materials And Methods
Study area
The Eastern Ghats are a discontinuous range of mountains that run almost parallel to the east cost of India. Chitteri Reserve Forest (CRF), the present study area is one of the hill forests of Eastern Ghats that lies at a latitude of 11°43.5’ to 12°06.0’ N and a longitude of 78°18.5’ to 78°40.5’ E, covering an area of about 742 km2 (Figure 1). The altitude of CRF ranged from 400 m to 1649 m above mean sea level. It is composed of masses of Charnockite associated with gneisses and varied metamorphic rocks. The soil is red, loamy and lateritic in nature.
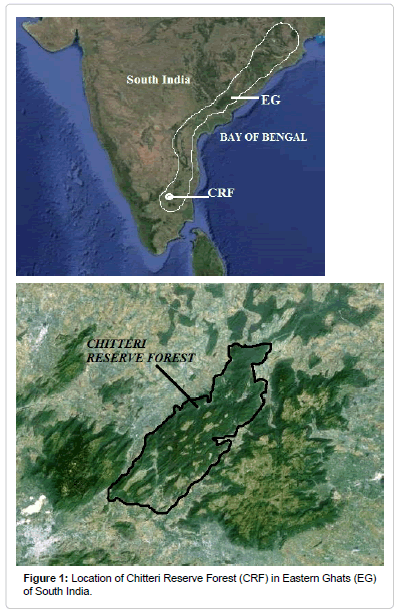
Figure 1: Location of Chitteri Reserve Forest (CRF) in Eastern Ghats (EG) of South India.
Climate
The mean annual temperature for the past two decades is 28.3°C. The annual rainfall is 1058 mm with average rainy days of 61 days. The bulk of the rainfall is observed during August to October.
Methods
The entire stretch of the Chitteri reserve forest was divided into twenty 6.25 km × 6.25 km grids. In each grid, a transect of 5 m × 1000 m was established randomly. All live trees ≥ 9.5 cm diameter at breast height i.e. trees ≥ 30 cm girth at breast height were inventoried from the twenty transects [7]. The inventory data were used for the assessment of the total carbon stock of tree vegetation in Chitteri hills.
Total Carbon Stock (TCS) of each tree was determined by following equation,
TCS = (AGB + BGB) × 0.5 (1)
Where ‘AGB’ is aboveground biomass, ‘BGB’ is below ground biomass, and ‘0.5’ is the conversion factor which represents that the carbon content is assumed as 50% of the total biomass as followed by Takimoto [8], Khan [9], Sundarapandian [10].
Estimation of AGB
Aboveground biomass was estimated using allometric equation following Brown [11].
Y = 34.4703 – 8.0671D + 0.6589D2 (2)
Where, ‘Y’ is AGB in kg, ‘D’ is diameter at breast height in cm
Most of the research work revealed that AGB is strongly correlated with tree diameter [12-14]. Also, it is accepted that simple model with only diameter as input is a good estimator of aboveground biomass [12,14-16]. Hence in the present study allometric equation using tree diameter to estimate aboveground biomass was used following Brown [11].
Estimation of BGB
Below ground biomass was calculated considering 15% of the aboveground biomass as followed by MacDicken [17], Alamgir [18] and Pragasan [3].
BGB = AGB × (15/100) (3)
Statistical analysis
Regression analysis was used to test the relationship between carbon stock and tree density, tree diversity and altitude of the forest location for the twenty transects inventoried in Chitteri. The vegetation of the 20 transects was classified into three forest types viz. semi-evergreen, mixed deciduous and scrub forests. Analysis of Variance (ANOVA) was performed to check the significance of variation in total carbon stock among the three forest types.
Results
Tree vegetation
A total of 5022 trees representing 143 species was recorded from 10 ha (twenty 0.5 ha transects) area sampled in CRF [7]. The average tree density per transect was 251±120 individuals/0.5 ha, and it ranged from 96 to 477 individuals/0.5 ha (Table 1). While the average tree diversity per transect was 37±11 species/0.5 ha with a range of 14 to 58 species/0.5 ha (Table 1).
| Grid no | Forest type | Altitude (m) | No of individuals/0.5 ha transect | No of species/0.5 ha transect |
|---|---|---|---|---|
| Grid 1 | SE | 815.9 | 314 | 46 |
| Grid 2 | SE | 720.9 | 477 | 46 |
| Grid 3 | SE | 913.6 | 437 | 38 |
| Grid 4 | SE | 979.6 | 451 | 36 |
| Grid 5 | SE | 507.5 | 300 | 53 |
| Grid 6 | SE | 1011.3 | 341 | 46 |
| Grid 7 | SE | 752.8 | 357 | 33 |
| Grid 8 | SE | 408.5 | 312 | 39 |
| Grid 9 | SE | 454.1 | 221 | 26 |
| Grid 10 | SE | 627.5 | 210 | 23 |
| Grid 11 | SE | 494 | 312 | 58 |
| Grid 12 | SB | 532.5 | 96 | 26 |
| Grid 13 | MD | 488.5 | 162 | 31 |
| Grid 14 | MD | 718.8 | 153 | 40 |
| Grid 15 | MD | 621.4 | 118 | 33 |
| Grid 16 | MD | 689 | 167 | 45 |
| Grid 17 | SB | 431.5 | 159 | 14 |
| Grid 18 | MD | 526.5 | 166 | 42 |
| Grid 19 | SB | 472.7 | 159 | 33 |
| Grid 20 | MD | 493.3 | 110 | 22 |
Table 1: Tree species density and richness for the twenty grids in the Chitteri reserve forest of the Eastern Ghats in India.
Tree biomass
The total biomass of tree vegetation in the 20 transects (10 ha) sampled in CRF was 1171.0 tonnes, with an average biomass of 58.6±43.4 t/0.5 ha transect, and it varied from 3.96 to 153.79 t/0.5 ha per transect (Table 2). The total Above Ground Biomass (AGB) and Below Ground Biomass (BGB) for the total 10 ha (20 transects) was 1018.26 tonnes and 152.74 tonnes, respectively (Table 2). The average AGB and BGB per transect was 50.9 t/0.5 ha and 7.6 t/0.5 ha, and the range was from 3.45 to 133.73 t/0.5 ha for AGB and 0.52 to 20.06 t/0.5 ha for BGB.
| Grid no | Aboveground biomass (t/0.5 ha) | Below ground biomass (t/0.5 ha) |
Total biomass (t/0.5 ha) | Total carbon stock (t/0.5 ha) |
|---|---|---|---|---|
| Grid 1 | 133.7 | 20.1 | 153.8 | 76.9 |
| Grid 2 | 71.4 | 10.7 | 82.1 | 41 |
| Grid 3 | 97.6 | 14.6 | 112.2 | 56.1 |
| Grid 4 | 105.6 | 15.8 | 121.4 | 60.7 |
| Grid 5 | 69.2 | 10.4 | 79.5 | 39.8 |
| Grid 6 | 81.8 | 12.3 | 94.1 | 47 |
| Grid 7 | 61.5 | 9.2 | 70.7 | 35.4 |
| Grid 8 | 66.2 | 9.9 | 76.2 | 38.1 |
| Grid 9 | 34.7 | 5.2 | 39.9 | 19.9 |
| Grid 10 | 34.8 | 5.2 | 40.1 | 20 |
| Grid 11 | 92.9 | 13.9 | 106.8 | 53.4 |
| Grid 12 | 11.6 | 1.7 | 13.3 | 6.6 |
| Grid 13 | 17.3 | 2.6 | 19.8 | 9.9 |
| Grid 14 | 21.2 | 3.2 | 24.3 | 12.2 |
| Grid 15 | 28.2 | 4.2 | 32.4 | 16.2 |
| Grid 16 | 41.5 | 6.2 | 47.8 | 23.9 |
| Grid 17 | 6.5 | 1 | 7.5 | 3.7 |
| Grid 18 | 31.8 | 4.8 | 36.6 | 18.3 |
| Grid 19 | 7.4 | 1.1 | 8.6 | 4.3 |
| Grid 20 | 3.4 | 0.5 | 4 | 2 |
Table 2: Tree biomass and carbon stock for the twenty grids in the Chitteri reserve
forest of Eastern Ghats.
Total carbon stock
The total carbon stock estimated for the tree vegetation sampled in the 20 transects (10 ha) in CRF was 585.5 tonnes. The average carbon stock per transect was 29.28±21.7 t/0.5 ha, and the minimum and maximum carbon stock estimated was 1.98 t/0.5 ha and 76.89 t/0.5 ha respectively (Table 2).
Carbon stock by the three forest types
The carbon stock of semi-evergreen forest (44.4 t/0.5 ha) is almost ten times greater than the carbon stock of scrub forest (4.89 t/0.5 ha) and three times greater than mixed-deciduous forest in the Chitteri reserve forest (Figure 2). ANOVA revealed that there existed a significant variation in the total carbon stock among the three forest types (F (2, 17) = 15.343, p < 0.001).
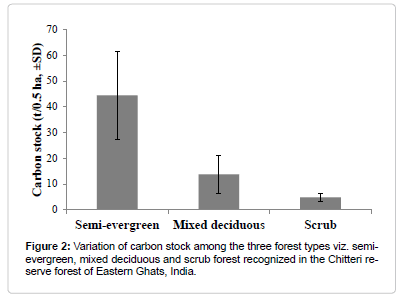
Figure 2: Variation of carbon stock among the three forest types viz. semievergreen, mixed deciduous and scrub forest recognized in the Chitteri reserve forest of Eastern Ghats, India.
Carbon stock by different size class
Based on diameter at breast height (DBH) trees were categorized into ten size classes viz. 9.5-20cm class, 20-30cm, 30-40cm, 40-50cm, 50-60cm, 60-70cm, 70-80cm, 80-90cm, 90-100cm and >100cm. The contribution of total carbon stock was observed maximum (34.8%) for 20-30cm class followed by 30-40cm class (Figure 3). A negative correlation was observed between the mean tree diameter of each size class with the total carbon stock (rs = -0.673, p<0.05). While, a positive correlation was noted between the density and the total carbon stock among the different tree size classes (rs = 0.509, p<0.05).
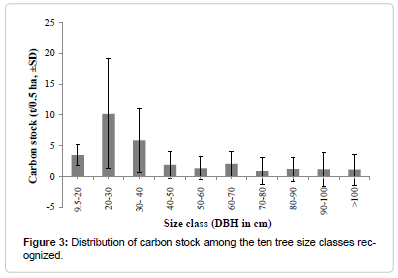
Figure 3: Distribution of carbon stock among the ten tree size classes recognized.
Carbon stock by single tree
Out of the 5022 individuals recorded from the total 10 ha (20 transects) area, the average carbon stock sequestered by a single tree was 0.12±0.24 t/tree (Table 3). The carbon stock was found maximum in Mangifera indica (1.73 t/tree), followed by Ficus benghalensis (1.48 t/tree), Sterculia urens (0.93 t/tree), Ficus microcarpa (0.78 t/tree), Terminalia chebula (0.60 t/tree) and Ficus nervosa (0.55 t/tree), and the minimum was recorded in Glycosmis pentaphylla (0.01 t/tree).
| Species (Family) | No of individuals | AGB | BGB | TB | TCS | AC |
|---|---|---|---|---|---|---|
| MemecyloneduleRoxb. (Melastomataceae) | 427 | 86.4 | 12.96 | 99.36 | 49.68 | 0.12 |
| Canthiumdicoccum (Gaertn.) Teijsm. &Binn. var. dicoccum (Rubiaceae) | 553 | 75.55 | 11.33 | 86.88 | 43.44 | 0.08 |
| Anogeissuslatifolia (Roxb. ex DC.) Wall. exGuill. &Perr. (Combretaceae) | 275 | 65.66 | 9.85 | 75.51 | 37.75 | 0.14 |
| Albiziaamara (Roxb.) Boivin (Mimosaceae) | 333 | 50.19 | 7.53 | 57.71 | 28.86 | 0.09 |
| Mangiferaindica L. (Anacardiaceae) | 15 | 45.16 | 6.77 | 51.93 | 25.97 | 1.73 |
| Ficusbenghalensis L. (Moraceae) | 15 | 38.59 | 5.79 | 44.38 | 22.19 | 1.48 |
| Schleicheraoleosa (Lour.) Oken (Sapindaceae) | 51 | 35.27 | 5.29 | 40.56 | 20.28 | 0.4 |
| DalbergiapaniculataRoxb. (Papilionaceae) | 80 | 33.98 | 5.1 | 39.07 | 19.54 | 0.24 |
| Nothopegiaheyneana (Hook.f.) Gamble (Anacardiaceae) | 150 | 31.4 | 4.71 | 36.11 | 18.06 | 0.12 |
| Terminaliabellirica (Gaertn.) Roxb. (Combretaceae) | 33 | 29.49 | 4.42 | 33.92 | 16.96 | 0.51 |
| DiospyrosebenumKoen. (Ebenaceae) | 71 | 26.52 | 3.98 | 30.5 | 15.25 | 0.21 |
| Commiphora caudate (Wight &Arn.) Engler (Burseraceae) | 59 | 25.88 | 3.88 | 29.76 | 14.88 | 0.25 |
| GyrocarpusasiaticusWilld. (Hernandiaceae) | 85 | 22.99 | 3.45 | 26.44 | 13.22 | 0.16 |
| Chloroxylonswietenia DC. (Flindersiaceae) | 186 | 22.31 | 3.35 | 25.65 | 12.83 | 0.07 |
| Drypetessepiaria (Wight &Arn.) Pax&Hoffm. (Euphorbiaceae) | 168 | 21.56 | 3.23 | 24.79 | 12.4 | 0.07 |
| Hardwickia binateRoxb. (Caesalpiniaceae) | 47 | 21.21 | 3.18 | 24.4 | 12.2 | 0.26 |
| Mimusopselengi L. (Sapotaceae) | 36 | 19.74 | 2.96 | 22.7 | 11.35 | 0.32 |
| Terminaliacoriacea (Roxb.) Wight &Arn. (Combretaceae) | 61 | 17.58 | 2.64 | 20.22 | 10.11 | 0.17 |
| DiospyrosmelanoxylonRoxb. (Ebenaceae) | 72 | 15.59 | 2.34 | 17.93 | 8.97 | 0.12 |
| FicusmicrocarpaL.f. (Moraceae) | 11 | 15 | 2.25 | 17.25 | 8.63 | 0.78 |
| VitexaltissimaL.f. (Verbenaceae) | 72 | 14.76 | 2.21 | 16.98 | 8.49 | 0.12 |
| Terminaliachebula Retz. (Combretaceae) | 13 | 13.62 | 2.04 | 15.66 | 7.83 | 0.6 |
| SterculiaurensRoxb. (Sterculiaceae) | 8 | 12.99 | 1.95 | 14.93 | 7.47 | 0.93 |
| Ficus nervosaHeyne ex Roth (Moraceae) | 13 | 12.35 | 1.85 | 14.2 | 7.1 | 0.55 |
| FicusmollisVahl (Moraceae) | 13 | 11.53 | 1.73 | 13.26 | 6.63 | 0.51 |
| DiospyrosmontanaRoxb. (Ebenaceae) | 122 | 10.76 | 1.61 | 12.37 | 6.19 | 0.05 |
| Buchananiaaxillaris (Desr.) Ramam. (Anacardiaceae) | 38 | 9.91 | 1.49 | 11.4 | 5.7 | 0.15 |
| Strychnosnux-vomica L. (Loganiaceae) | 38 | 9.31 | 1.4 | 10.71 | 5.36 | 0.14 |
| Tamarindusindica L. (Caesalpiniaceae) | 13 | 8.99 | 1.35 | 10.34 | 5.17 | 0.4 |
| StrychnospotatorumL.f. (Loganiaceae) | 106 | 8.6 | 1.29 | 9.89 | 4.94 | 0.05 |
| Drypetesroxburghii (Wall.) Hurusawa (Euphorbiaceae) | 26 | 7.74 | 1.16 | 8.9 | 4.45 | 0.17 |
| PremnatomentosaRoxb. (Verbenaceae) | 70 | 6.95 | 1.04 | 7.99 | 4 | 0.06 |
| GarugapinnataRoxb. (Burseraceae) | 24 | 6.84 | 1.03 | 7.87 | 3.93 | 0.16 |
| SapindusemarginatusVahl. (Sapindaceae) | 39 | 6.77 | 1.01 | 7.78 | 3.89 | 0.1 |
| Lanneacoromandelica (Houtt.) Merr. (Anacardiaceae) | 26 | 6.12 | 0.92 | 7.04 | 3.52 | 0.14 |
| Cassineglauca (Rottb.) Kuntze (Celastraceae) | 15 | 6.07 | 0.91 | 6.98 | 3.49 | 0.23 |
| GivotiarottleriformisGriff. (Euphorbiaceae) | 12 | 6.03 | 0.9 | 6.93 | 3.47 | 0.29 |
| StreblusasperLour. (Moraceae) | 52 | 5.89 | 0.88 | 6.78 | 3.39 | 0.07 |
| CleistanthuscollinusBenth. exHook.f. (Euphorbiaceae) | 78 | 5.47 | 0.82 | 6.29 | 3.15 | 0.04 |
| Scolopiacrenata (Wight &Arn.) Clos (Flacourtiaceae) | 46 | 4.94 | 0.74 | 5.69 | 2.84 | 0.06 |
| Walsuratrifolia (A.Juss.) Harms (Meliaceae) | 20 | 4.9 | 0.73 | 5.63 | 2.82 | 0.14 |
| Diospyrosferrea (Willd.) Bakh. var. buxifolia (Rottb.) Bakh. (Ebenaceae) | 96 | 4.87 | 0.73 | 5.6 | 2.8 | 0.03 |
| Euphorbia antiquorum L. (Euphorbiaceae) | 123 | 4.77 | 0.72 | 5.49 | 2.74 | 0.02 |
| DiospyrosbarberiRamaswami (Ebenaceae) | 24 | 4.69 | 0.7 | 5.39 | 2.7 | 0.11 |
| DalbergialatifoliaRoxb. (Papilionaceae) | 13 | 4.67 | 0.7 | 5.36 | 2.68 | 0.21 |
| IxorapavettaAndr. (Rubiaceae) | 107 | 4.61 | 0.69 | 5.3 | 2.65 | 0.02 |
| Pongamiapinnata (L.) Pierre (Papilionaceae) | 22 | 4.57 | 0.69 | 5.26 | 2.63 | 0.12 |
| Gardenia resinifera Roth (Rubiaceae) | 59 | 4.55 | 0.68 | 5.23 | 2.62 | 0.04 |
| Atalantiaracemosa Wight &Arn. (Rutaceae) | 42 | 4.4 | 0.66 | 5.06 | 2.53 | 0.06 |
| Wrightia tinctoria (Roxb.) R.Br. (Apocynaceae) | 62 | 4.13 | 0.62 | 4.74 | 2.37 | 0.04 |
| Remaining 93 species | 902 | 96.4 | 14.46 | 110.86 | 55.43 | 0.06 |
| Total | 5022 | 1018.3 | 152.74 | 1171 | 585.5 | 0.12 |
Table 3: Biomass (AGB-aboveground biomass; BGB-below ground biomass; TB-total biomass) and carbon stock (TCS-total carbon stock; AC-average carbon stock by single tree) of different tree species in Chitter reserve forest of Eastern Ghats, India.
Contribution of different tree species to total carbon stock
Among the 143 different tree species identified, the contribution of Memecylon edule to the total carbon stock in CRF was high (8.5 %), followed by Canthium dicoccum var. dicoccum (7.4 %), Anogeissus latifolia (6.4 %), Albizia amara (4.9 %) and Mangifera indica (4.4 %) (Table 3). A positive correlation was observed between the carbon stock and density of the top 50 species which contributed predominantly to the total carbon stock (rs = 0.773, p<0.05).
Relationship of carbon stock with density, diversity and altitude of forest location
Regression analysis done between carbon stock and density, diversity and altitude for the twenty transects under the study revealed a significant strong positive relationship between carbon stock and tree density (Figure 4), and the following regression equation was obtained:
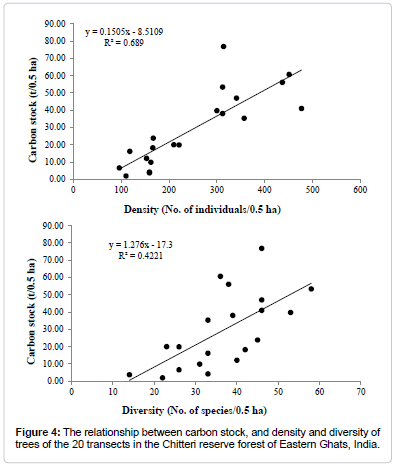
Figure 4: The relationship between carbon stock, and density and diversity of trees of the 20 transects in the Chitteri reserve forest of Eastern Ghats, India.
Y = 0.1505X – 8.5109 (R2 = 0.689) (4)
However, no significant relationship was observed between carbon stock and tree diversity (R2= 0.422; Figure 4) and with the altitude of the forest (R2 = 0.399; Figure 5).
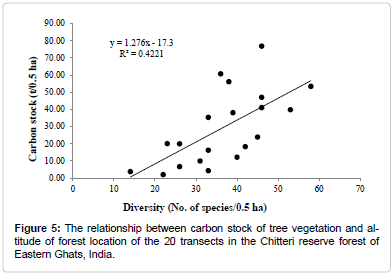
Figure 5: The relationship between carbon stock of tree vegetation and altitude of forest location of the 20 transects in the Chitteri reserve forest of Eastern Ghats, India.
Discussion
It is important to understand the role of tree vegetation in the global carbon cycle. The total carbon stock of tree vegetation of the present study is well within the limits of natural forests reported worldwide as well as in India. The carbon stock of Chitteri reserve forest (58.55 t/ ha) is low when compared with the tropical rainforests (137.73 t/ha) of Thailand, but higher than the tropical mixed deciduous forests (48.14 t/ ha) of Thailand [3,19]. In the present study, carbon capture by a single tree was recorded maximum for Mangifera indica (1.73 t/tree) which is almost fifteen times greater than the maximum value (0.11 t/tree) recorded for Acacia nilotica from a mixed tree plantation in India [3]. However, Memecylon edule shared the highest carbon stock of 8% from the total carbon stock estimated. It was observed in the present study that the carbon stock of top 50 tree species positively correlated tree density, and this revealed that the carbon stock of tree species increases with an increase in its density. Also, a positive correlation was observed between the total carbon stock and density of trees among the different size classes. Further, the regression analysis performed to check the relationship of vegetation traits such as tree density, diversity and altitude of the forest on the total carbon stock, revealed no significant relation was observed between the total carbon stock with the tree diversity and altitude of the forest, but a strong significant relation was noted between the tree density and the total carbon stock. These suggest that higher the tree density in a forest ecosystem higher will be its carbon stock.
The carbon stock among the different size class positively correlated with tree density and negatively correlated with their mean tree diameter revealed that the density of trees with bigger DBH is very low which was reflected in their total carbon stock sharing in CRF of the Eastern Ghats in India.
Among the three forest types recognized in the Chitteri reserve forest, the order of carbon stocks can be justified as scrub forest < mixed deciduous < semi-evergreen forest. And, there existed a significant variation in the total carbon stock among the three forest types. This reflects that semi-evergreen forests are better forest type when compared to the mixed deciduous and scrub forests in terms of density as well as carbon stocking potential, and demands priority for conservation.
In the present study, allometric equation following Brown [11] was used to estimate aboveground biomass uniformly for all the three forest types mainly to find the difference in their carbon stocking potential by using a uniform methodology, and also assuming that all the trees were inventoried from the same reserve forest in a tropical region. To get accurate carbon stocking data for CRF species-specific allometric models are warranted, and that can be done by destructive sampling of a few individuals for each tree species.
The results of the present study prove that tree vegetation in natural forest ecosystem acts as storehouse of carbon by storing carbon in their tissues as biomass and thereby reducing the concentration of atmospheric CO2. Natural forests being undisturbed ecosystems prove to be having a great potential of curbing the increasing concentration of greenhouse gas in the atmosphere [3]. 90% of all the biomass organic carbon is stored by the trees on earth which accounts for 500 Gt C, which is close to the total amount of carbon in the atmosphere (750 Gt C). Atmospheric carbon dioxide is highly sensitive to forest destruction hence conservation measures are needed to protect Chitteri reserve forest.
Despite the fact that CRF falls in the reserve forest category, the local people have unlimited access to firewood collection and herding cattle for grazing, besides illegal extraction of timber and non-timber resources. Hence, restoration of the already degraded CRF through tree plantation is necessary to protect the total carbon stock in the forest vegetation. Further, it is necessary to conduct awareness programs for the local people in this regard.
Acknowledgements
I sincerely thank Dr. N. Parthasarathy, Professor of Ecology and Environmental Sciences, Pondicherry University, for all his support and encouragements.
References
- Jana BK, Biswas S, Majumder M, Roy PK, Mazumdar A (2009) Carbon sequestration rate and above ground biomass carbon potential of four young species. J Ecol Nat Enviro 1: 015-024.
- National oceanic and atmospheric administration (2014) Earth System Research Laboratory, USA.
- Pragasan LA, Karthick A (2013) Carbon stock sequestered by tree plantations in university campus at Coimbatore, India. International J Environ Sci 3: 1700-1710.
- Wilson BR, Daff JT (2003) Australiaâ??s state of the forests report. Department of Agriculture, Fisheries and Forestry, Govt. of Australia, Australia.
- Mohanraj R, Saravanan J, Dhanakumar S (2011) Carbon stock in Kolli forests, Eastern Ghats (India) with emphasis on aboveground biomass, litter, woody debris and soils. iForest 4: 61-65.
- Lal R (2005) Forest soils and carbon sequestration. Forest EcolManag 220: 242-258.
- Pragasan LA, Parthasarathy N (2010) Landscape-level tree diversity assessment in tropical forests of southern Eastern Ghats, India. Flora 205: 728-737.
- Takimoto A, Nair PK, Nair VD (2008) Carbon stock and sequestration potential of traditional and improved agroforestry systems in the West African Sahel. AgriEcosys Environ 125: 159-166.
- Khan AB (2013) Assessment of carbon storage in Pondicherry mangroves, Pondicherry, India. Acta BiologicaMalaysiana 2: 95-99.
- Sundarapandian SM, Amritha S, Gowsalya L, Kayathri P, Thamizharasi M, et al. (2013) Estimation of biomass and carbon stock of woody plants in different land-uses. Forest Res 3: 115.
- Brown S, Gillespie AJR, Lugo AE (1989) Biomass estimation methods for tropical forests with applications to forest inventory data. Forest Sci 35: 881-902.
- Brown S (1997) Estimating biomass and biomass change of tropical forests: a primer. Rome, Italy: FAO Forestry Paper Paper - 134.
- Brown S, Lugo AE (1984) Biomass of tropical forests: a new estimate based on forest volumes. Science 223: 1290-1293.
- Clark DA, Brown S, Kicklighter DW, Chambers JQ, Thomlinson JR, et al. (2001) Net primary production in tropical forests: an evaluation and synthesis of existing field data. Ecol Appl 11: 371-384.
- Nelson BW, Mequita R, Pereira JL, de Souza SG, Batista GT, et al. (1999) Assessing tree and stand biomass: a review with examples and critical comparisons. Forest Sci 45: 573-593.
- Djomoa AN, Ibrahimab A, Saborowskic J, Gravenhorsta J (2010) Allometric equations for biomass estimations in Cameroon and pan moist tropical equations including biomass data from Africa. Forest EcolManag 260: 1873-1885.
- MacDicken KG (1997) A guide to monitoring carbon storage in forestry and agro forestry projects USA. Winrock International Institute for Agricultural Development, USA
- Alamgir M, Al-Amin M (2008) Allometric models to estimate biomass organic carbon stock in forest vegetation. J Forestry Res 19: 101-106.
- Terakunpisut J, Gajaseni N, Ruankawe N (2007) Carbon sequestration potential in above ground biomass of Thong PhaPhum National Forest, Thailand. Appl Ecol Environ Res 5: 93-102.
Citation: Pragasan LA (2014) Carbon Stock Assessment in the Vegetation of the Chitteri Reserve Forest of the Eastern Ghats in India Based on Non-Destructive Method Using Tree Inventory Data. J Earth Sci Climat Change S11: 001. DOI: 10.4172/2157-7617.S11-001
Copyright: © 2014 Pragasan LA. This is an open-access article distributed under the terms of the Creative Commons Attribution License, which permits unrestricted use, distribution, and reproduction in any medium, provided the original author and source are credited.
Select your language of interest to view the total content in your interested language
Share This Article
Recommended Journals
Open Access Journals
Article Tools
Article Usage
- Total views: 16436
- [From(publication date): 0-2014 - Jun 24, 2025]
- Breakdown by view type
- HTML page views: 11645
- PDF downloads: 4791