Causative Factors for the Initiation of Atherosclerotic Plaques
Received: 09-Nov-2017 / Accepted Date: 24-Nov-2017 / Published Date: 30-Nov-2017
Abstract
Three main factors account for the accumulation of lipoprotein complexes at focal zones of the arterial tree which then can lead to plaque development: (a) diverging flow of the arterial tree which is punctuated at arterial bifurcations, (b) the arterial wall is a semi-permeable membrane with steady bulk flow of fluid, through the interstices of the intimal wall, and (c) shear dependent diffusivity of macromolecules which depends strongly on local shear rate. In the absence of the any factors, either no wall accumulation would occur or lipoproteins would form layers over the entire arterial tree. Models are developed and applied to various zones of an arterial branch, which shows large variations in wall accumulations. The models show that the most important aspects occur from the wall. Very high accumulations of lipids of factors of 2 to 6 times the bulk values in the recirculating flow downstream of branches or at aneurisms while other are show minimal accumulations.
These causative factors directly relate to clinical data, which links smoking to increased wall permeability and thus permeation rate, to incidence and severity of atherosclerotic plaques as well as substantial data linking high blood pressure affecting wall permeation rate with severity or incidence of plaque formation. There is also evidence of feedback whereby the local swelling of the intima increases the interstitial gaps which allow bulk fluid to pass more readily, thus accelerating the local accumulations in these zones.
This work integrates aspects, which have been studied separately but are not all present in previous work.
Keywords: Arteriosclerosis plaques; Smoking; Blood pressure; Diabetes
Introduction
Given that heart disease and arteriosclerosis is the leading cause of death in the US and the very strong relationships not only to diet and exercise but also with smoking, high blood pressure and also diabetes, it is interesting that no unifying consensus has developed about the initiating cause.
The dominant characteristics of the disease can be measured by the occurrence of atherosclerotic plaques [1]. They occur only in the arterial tree and not the venous system [2]. They are a surface phenomenon [3]. They occur in localized zones or spots typically downstream of branches in the arteries.
Flow area increases, average velocity decreases in the arteries as the network branches while the venous system converges and flow accelerates. Despite the fact that venous walls are thinner and also permeable, lesions occur in the thicker walled arteries. This can be accounted for by the occurrence of flow separation in the arteries when the flow area increases suddenly while this does not occur in the venous system. The focal lesions occur at points of possible backflow and therefore very low or zero wall shear rate or stress.
The phenomenon occurs at the surface of the intimal layer. Initially the development is completely linked to the transport to and through the surface of the wall and thus the main variables of interest are those, which operate or vary within a thin boundary layer of the surface.
Detailed measurements in vitro [3] of transport of macromolecules, i.e. LDL, HDLs and fibrinogen, show transport by pinocytotic movement which occurs on the time scales of hours and days. On the other hand, bulk fluid, mostly water, flows through rapidly under a hydraulic pressure gradient driven by local external fluid pressure. Thus the arterial wall acts as a semi-permeable membrane and the net effect of bulk fluid flow through the wall is a buildup or concentration gradient of macromolecules at the surface as shown later.
A simple model of the stagnant boundary layer shows that the diffusive transport away from the wall balances the convective transport to the wall in a pseudo steady state. The higher permeation velocity and smaller the diffusivity lead to higher wall gradient and surface concentration. Analysis of the Navier Stokes equations shows s that the inertial terms are negligible in a boundary zone near the wall, which includes the concentration boundary layer. The viscous boundary layer contains the relevant fluid flow profile. Thus, the analysis that follows takes the view of the near wall conditions rather than the bulk fluid flow conditions as the determining factors.
A simple model of the stagnant boundary layer shows that the diffusive transport away from the wall balances the convective transport to the wall in a pseudo steady state. The higher permeation velocity and smaller the diffusivity lead to higher wall gradient and surface concentration. Analysis of the Navier Stokes equations shows s that the inertial terms are negligible in a boundary zone near the wall, which includes the concentration boundary layer. The viscous boundary layer contains the relevant fluid flow profile. Thus, the analysis that follows takes the view of the near wall conditions rather than the bulk fluid flow conditions as the determining factors.
In zones where wall shear rate is very low, diffusion coefficients will approach the binary values while in higher shear zones diffusivity increases significantly. The net effect is that mass transfer rate between the bulk and wall varies significantly throughout the arterial tree. This leads to a wide variation in wall polarization, which can account for the focal occurrence of plaques after long periods of time.
The boundary layer nature of the concentration and velocity profiles are very helpful in simplifying the analysis of the fluid mechanics and mass transfer in the relevant regions.
For example, the oscillatory nature of the bulk blood flow has little if any effect in the viscous and concentration boundary layers. This can be shown from full CFD analysis for a standard waveform in the carotid artery [4]. For this reason, secondary flows or the curvilinear nature of the arterial junctions is not overly significant.
In the perspective of the very thin concentration boundary layer, the external flow appears to be an external boundary condition while all the phenomena of importance are within the thin boundary zone in which the permeation velocity, the local wall shear gradient and the local effective eddy diffusivity are the dominant variables.
The factors that affect the focal accumulation of macromolecules can also contribute to the accumulation of thrombosis products in the same zones thus contributing to the plaque buildup
This paper discusses the following areas of the arterial tree: a straight section of a vessel (Zone C), the zone at a branch where the flow stagnates on the downstream wall (Zone B) and the so-called wake region if it occurs in the smaller branch (Zone A).
The following schematic of the arterial bifurcation includes three areas of interest, the entrance zone starting with AF, the stagnation zone centered on H and the minor branch ending with BC. The walls are not actually straight and the stagnation zone is neither symmetric nor sharp. The shapes are all curved and three dimensional. However, since the geometry at branches is so variable, it is assumed that the model is varied over wide ranges in geometry and flow rates to account qualitatively for the transient and three dimensional aspects of the actual bifurcation. For details on the following development and results (Figure 1).

Figure 1: 2-D Arterial Bifurcation.
Arterial Wall Filtration
Plasma filtration through the arterial wall has long been suspected to be important in the development of fatty streaks [1], which are early forms of plaque. Although the filtration rates so far measured appear small (approx. 3.4 × 10⁻⁶ cm/s) by Wilens [2], such rates might lead to a substantial increase in wall lipid concentration over the average blood lipid level particularly for large lipoprotein molecules with characteristically low diffusion coefficients. This value is used for all subsequent work except where we analyze the sensitivity to wall permeation velocity.
For example, consider an idealized system in which a semipermeable surface bounds a well-stirred fluid except for a stagnant film of thickness δc near the surface. With fluid flowing through the surface with velocity vw in the steady state, the convective transport of lipid toward the surface (vwc) is equal to the diffusive transport of lipid away from the surface (dc/dy). When this steady state flux relationship (1) is solved for wall concentration, cwall
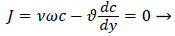 (1)
(1)
We obtain,
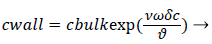 (2)
(2)
Where terms are bulk concentration, Cbulk, diffusivity, fluid velocity, Vw, and film thickness δc.
Defining the polarization P as
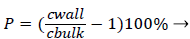 (3)
(3)
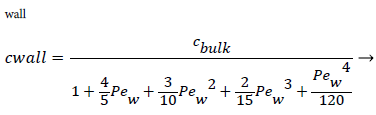
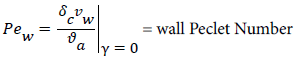
and the wall Peclet number Pew defined as  , equal to the product of Reynolds and Schmidt numbers, we obtain
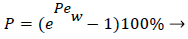 (4)
(4)
For experimental values of Vw and=10-7 cm2/s i.e. approx. binary diffusivity, Pew= 0.68 and P is nearly 100%. This is double the bulk value for physically reasonable values of δc equal to 0.02 cm. The definition of Peclet number (equal to the product of Reynolds and Schmidt numbers) is used throughout will not be repeated. This result ignores the effect of augmented diffusion and applies strictly in a stagnant film. This shows that significant wall lipid concentrations could develop in relatively stagnant, i.e slow shear, regions of the arterial system.
Micro-mixing Diffusion Augmentation
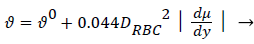
There is ample experimental evidence that red blood cell rotation mixes the fluid near the cell thereby augmenting the diffusion of plasma components over that by binary diffusion alone. The expression for the augmented diffusivity is given by [5].
 (5)
(5)
Where is the augmented diffusivity, 0 is the so-called binary or Fick's Law diffusivity, Drbc is the major diameter of the red blood cell, du/dy is the absolute value of the local fluid shear rate which is generally positive except in the recirculation zone in the branch and the second term in (5) is the so-called eddy diffusivity. One can see that will be dominated by the eddy diffusivity for shear rates of 10 s-1 or greater which is commonly exceeded in most regions of the arterial tree particularly areas such as Zone C (Figure 1) where atheromas seldom occur. Furthermore, the larger values of in these regions effectively reduce P by reducing Pew. This can be seen by examining (2) and (3) above. However in Zones B and C (Figure 1) where wall shear rates are low, is nearly equal to 0 which is small (≈10-7 cm2/s) and P may be relatively large. Therefore, one might suspect that a link may exist between the variation in wall shear rate, lipid diffusivity, wall polarization and the variation in the occurrence of plaques and atheromas in the arterial tree. Thus micro-mixing would tend to reduce rather than increase P in regions of high shear.
Case 1: Wall Polarization in Steady Fully Developed Flow in a Straight Semi-Permeable Cylindrical Tube
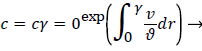
For a straight circular tube is a rough approximation to the conditions in the upper aorta with the exception of flow pulsations, the steady wall concentration, c, [1 p. 2.17-2.19, 5] is given by
 (6)
(6)
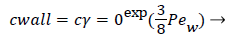
Where cr=0 is the centerline lipid concentration and is the lipid diffusivity which is assumed constant. Substituting for v, the wall concentration, cwall, can be expressed in terms of cr=0 and the Peclet Number, Pew is d Vw/ where d is the tube diameter.
 (7)
(7)
Assuming d of 0.5 cm, diffusivity of 1.8 × 10⁻⁶ cm2/sec and Vw=3.4 × 10⁻⁶ cm/s, the ratio of Cwall to Cr=0 is 1.425 or a value of wall polarization of 42.5% which depends on the wall permeation rate. This agrees with the value reported by [4] for a straight section of the carotid artery using a pressure wave form. The value if used above was an augmented diffusivity based on a shear rate of 100 s-1 using (5). The above value of polarization represents an upper limit at which a fully developed concentration profile is attained in a steady parabolic velocity profile. This calculation illustrates the high wall polarization achievable even for rather low wall permeation rates provided micro mixing is neglected.
Blood Bulk Viscosity
Note that bulk viscosity doesn’t enter into the above velocity profiles. However viscosity plays an important role in hemodynamics in the arterial system. Blood viscosity is discussed in detail in [1 p2.2-2.3 and Appendix C]. Viscosity depends on pH, temperature as well as hematocrit, local shear rate and geometrical factors. Cells naturally align in smaller vessel thus reducing the apparent viscosity. At high shear rates seen in Zones B and C, particularly near the vessel wall, viscosity can be assumed Newtonian with values of 4 to 5 centipoise. In zone A particularly at the separation and reattachment points and also in the viscous wake if it occurs, shear rates are much lower and the assumption of Newtonian behavior is not as well justified. However, the following treatment can be modified to account for a shear dependent viscosity in the wake region in future work [1, Appendix C].
Model Of Wall Concentration Polarization For Boundary Layer Cases
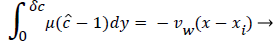
The following integral boundary layer technique was used to compute the wall polarization for Case 2 (developing flow in a permeable channel) and Case 3 (stagnation flow onto a series of permeable wedges). The same procedure was used as a starting point for the development of the lipid transport model in the recirculating flow region (Case 4). The details of this derivation can be found in [1, p 2.28-2.34 and Appendix B]. The dimensionless lipid concentration in the concentration boundary layer ĉ, normalized by Cbulk, δc, the boundary layer thickness, axial velocity u and Vw are related in the following way,
 (8)
(8)
where  x is the axial coordinate, y is the normal coordinate and xi is the point at which δc is zero. For this geometry Vw is taken as negative since it is toward the wall. Thus Pew in (11) is also negative. Equation 8 says that the growth of the dimensionless concentration c is directly proportional to the length of the surface through which the wall permeation rate operates. Equation 9-11 apply everywhere in the arterial system except at a Recirculation zone where it is modified to include the effect of recirculation shown later.
When is expressed as a power series in distance from the wall, y, whose coefficients are determined by applying a number of boundary and compatibility conditions to, we obtain.
 (10)
(10)
where
 (11)
(11)
a is the augmented diffusivity given by (5). Substituting (9), (10) and (11) into (8) and the equations for u as a function of y in the boundary layer, we obtain a nonlinear algebraic equation forC as a function of xxi. Cwall and P. First we must determine the boundary layer velocity distribution, u, for each case. The velocity distribution is determined using the relevant Prantdl boundary layer form of the momentum balance and solved by the Pohlhausen method briefly described below and in [1].
Case 2: Developing Flow in the 2-D Permeable Channel
For 2-D channel flow the boundary layer momentum balance is
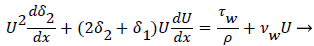 (12)
(12)
where the displacement thickness and momentum thickness are defined as follows,
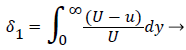 (13)
(13)
 (14)
(14)
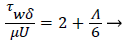
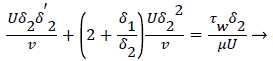
and U is a function of x. u is the velocity distribution in the boundary layer. The wall shear stress is defined the usual gradient form based on the velocity gradient at the wall.
Subscript w indicates the value at the wall. The term for the velocity at the wall, i.e. the wall permeation rate, can be neglected and the term  is the wall shear stress.
The general case of the velocity profile parallel to the wall as a function of distance from the wall, is developed in detail in [1 p. 3.7-3.20] and [6] following the integral boundary layer method valid in the relevant region near the wall. These conditions apply to a straight or curved section of an artery upstream of a bifurcation (Zone C). For an enclosed flow in a channel, the bulk velocity U outside the momentum boundary layer is defined in terms of the average inlet velocity Uo and the channel half-width R as follows,
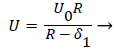 (15)
(15)
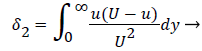
δ1, the displacement thickness represents the displacement of the external potential flow field from the wall due to the growth of the boundary layer. δ1, is defined later in terms of the boundary layer thickness δ and the shape factor Λ defined below
The velocity parallel to the wall, u, is approximated by a power series in η=y/δ which can be reduced to the following compact form
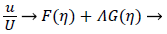 (16)
(16)
where U is defined by (12). η is the normalized coordinate normal to the vessel wall, y/δ, and δ, the boundary layer thickness, is defined as
 (17)
(17)
Functions F and G are given by (18) and (19)
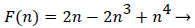 (18)
(18)
With the definitions above the and can be expressed as functions of shape factor
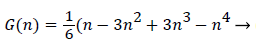 (19)
(19)
With the definitions above the and can be expressed as functions of shape factor
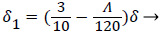 (20)
(20)
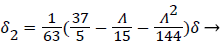 (21)
(21)
where the dimensionless shape factor, Λ, is related to the boundary layer thickness and the external velocity gradient as
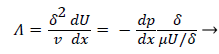 (22)
(22)
The wall shear stress then becomes
 (23)
(23)
The momentum balance is then converted to the following dimensionless form
 (24)
(24)
Λ represents the ratio of the pressure force to the viscous force. ν is the kinematic viscosity of the fluid in the boundary layer, μ/ρ. The shape factor becomes important in determining the point of boundary layer separation as well as being fundamental to the solution of the velocity distribution within the boundary layer as a function of x.
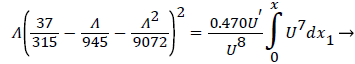
Throw a series of steps involving the introduction of a second shape factor and other terms, as well as a convenient approximation, the nonlinear ordinary differential equation (22) is transformed into an integral equation solvable by numerical quatrature for each value of x (23). Several forms of this final result exist and are used depending on the form of the external velocity function, U.
For developing flow, Λ, is zero at the entrance and increases along the axis of the channel. Relying on Walz’ modification, the momentum equation relating the above variables for developing flow in the channel becomes [1, p. 3.10].
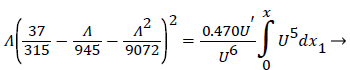 (25)
(25)
Shape factor is computed as the solution to (23) for a specified external velocity, which then determines the remaining variables. The solution of the above fluid mechanical equations and the coupled mass transport equations determine the development of the concentration and velocity profiles in the entrance-like flow in the 2-D channel, which is very representative of the upper aorta. These equations accurately predict the distance to a fully developed profile as well as the final velocity profile and maximum velocity in the channel.
Results for Case 2
These regions are found to be relatively free of atherosclerotic development except under experimentally induced hyperlipidemic conditions. Profiles of P and augmented diffusivity a are shown in Figure 2 for values of NRe of 100 and 400 where NRe is defined as U0D/ ν. The maximum wall polarization achieved at Xfd was in general quite small for values of NRe characteristic of the arterial system (100-400). For example, D=1 cm, ν=0.01 cm/s2, U0=10 cm/s, NRe=100, X fd =3.5 cm and, P=1.5%. Because this distance to reach a fully developed velocity profile (3.5 cm) is comparable to the distances between the various flow disruptions such as bifurcations, one would expect high shear rate entrance-like flow and low wall polarizations to prevail in these zones.
Figure 2 also shows how the augmented diffusivity decreases with distance from the “entrance” and with increasing NRe. Because increasing a causes P to decrease, one sees that the gradually decreasing shear rate near the vessel wall as the flow develops causes to decrease and P to increase.

Figure 2: Polarization and Augmented Diffusion Coefficient In Entrance-Like Flow in a Channel.
The augmented diffusivity is up to an order of magnitude larger than the binary diffusivity. Thus higher shear rate reduces wall polarization and helps to limit any plaque development in these high shear zones. Higher Reynolds Numbers also reduce wall polarization.
Case 3: Stagnation Flow On to Permeable Wedges
This flow geometry represents the general case of stagnation flow on the inner walls of a branch. The wide range of branch angles can be represented by the parameters of the wedge Figures 3a and 3b. The general case of a rounded geometry and the inner wall downstream of the stagnation point is handled by splicing together a series of solutions for a range of geometric parameters similar to the approach used in airfoil design. The methodology for the flow in Case 3 relies again on the Pohlhausen integral method [6]. In addition, the symmetry of the external flow allows for a similar solutions technique employing the shape factor, which in this case is independent of x.

Figure 3a: Stagnation Flow Onto a wedge.

Figure 3b: Wall Polarization By Symmetric Wedge Flows Including Augmented Diffusion.
Equations (12-20) were used to derive velocity profiles in the neighborhood of the stagnation point on a semi-permeable wedge (refer to Figure 1, Zone B) whose angle β π is allowed to vary from 0 to 1. Note that for m=1, the flow is pure plane stagnation flow on a flat plate which approximates flow onto a blunt surface at a branch. This analysis requires an external velocity U of the form
 (26)
(26)
where m is related to β by
 (27)
(27)
and the wall shear rate is given by
 (28)
(28)
where Λ is now only a function of m. Substituting these definitions for U, δ and Λ into (25), we obtain.
 (29)
(29)
and
 (30)
(30)
Λ(m)/m remains finite as m approaches 0 and δ becomes zero at the origin (x=0) for all m except m=1 which is simply a flat plate for which δ is constant for all x.
The range of positive wedge angles βπ from 0 to 1 gives rise to a wide range of wall polarization values. A right angle (β=½) divides flows having an entrance-like flow character (β<½) discussed previously from those having a stagnation flow character (β>½).
For m=0 the values of P are very close to those predicted for flow over a flat plate at zero incidence and for developing flow in a 2-D channel discussed previously. For m=1, flow becomes pure stagnation flow as mentioned previously.
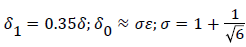
The actual velocity distribution in the stagnation zones of the arterial branch (Zone B, Figure 1) and those along the inner arterial walls downstream of the stagnation point are approximated by assigning a series of values of m or β and corresponding values of U0 to each of a series of small sections of the arterial wall. The value m=1 is assigned to the region near the stagnation point (flat plate) while m=1/3 (β=½) is assigned to the zone downstream where a fully developed velocity profile is achieved.
Values of m between 1 and 1/3 are assigned to small sections between these two points. The wall polarization profile is formed by calculating and joining the profiles in each section.
Figures 3-5 show P profiles for various values of the parameters, which make up NPe. Although the P curves for 0<m<1/3 are not really applicable to stagnation flows, for reasons discussed earlier, they are included here to illustrate the variations in P values as the flow changes from entrance-like to stagnation-like flow. Figures 3 shows that P values are small for wedge angles of interest and for typical values of U0 and Vw both with and without augmented diffusion. In general, only the shape of the curves is affected by the augmented diffusion. A piecewise match of P profiles along the wall for decreasing values of β shows that P decreases steadily with x from about 5.5% at x=0 to nearly zero when the diffusivity is augmented and to about 3% when no augmentation takes place. Figure 4 illustrates an extreme case in which U0 and Vw are large (50 cm/sec) and Vw (-3.4 × 10⁻⁵ cm/s). Here P is about 20% at x=0 and increases steadily to about 60% at 1.45 cm.

Figure 4: Wall Polarization in Symmetric Wedge Flows without Augmented Diffusion.

Figure 5: Wall Polarization in Symmetric Wedge Flows at Higher NRe without Augmented Diffusion.
Figure 5 shows that at higher inlet velocities and Reynolds numbers, wall polarization values are much higher without augmented diffusion. Polarization increases away from the origin. The general absence of atheromas in these types of flows indicates that augmented diffusion strongly influences the location of the atheromas.
These results agree very closely with those of Gill and Zeh for an exact solution for pure stagnation flow on a porous flat plate which is analogous to the stagnation zone at the branch and is analogous to the wedge with m=1 (see following figure curve analytical 3.4) . Details of this derivation can be found in (1 p. 2.22-2.25).
Results are shown in Figure 6 for ranges of U0 and Vw based on the above equation for C. These show polarizations in the absence of augmented diffusion [7]. Curve 1a is determined from the Pohlhausen approximation for the velocity distribution and wall polarization based on the concentration boundary layer presented earlier for symmetric wedge flows with m=1. This shows that there is very good agreement between the boundary layer approach and the “exact” solution for all values of U0. It also shows that a symmetric wedge flow does represent a realistic case even when the wedge is an idealized sharp angle and not a well-rounded shape, which one would expect in living systems.

Figure 6: Wall Polarization by Symmetric Stagnation Flow on a Flat Plate without Augmented Diffusion.
Figure 6 shows the influence of wall permeation rate on P for symmetric flow onto a flat plate at the surface for all x. The results show as expected that if the wall is impermeable (Vw=0) and by [8], no polarization occurs, which is also true of all the previous and subsequent cases. The X-axis in this case is U0, the external mean velocity. This shows that polarization decreases in general with increasing NRe for pure stagnation flow and increases as velocity approaches 0.
Generally, these results agree with clinical observation that the inner walls of the arterial branch are relatively free of plaque deposition under normal circumstances. These results are very consistent with recent work by Deng et al. [4].
These results also show that the relatively small values of δc characteristic of these flows, which are inversely proportional to the mass transfer rates, indicate that mass transfer will be relatively high in these zones. Therefore, these zones should be relatively more susceptible to fatty streak development should blood lipid levels become abnormally elevated as in experimentally induced hyperlipidemia.
Case 4: Polarization in the Region of Recirculating Flow in an Arterial Branch
This procedure accurately predicts the flow at and downstream of the stagnation zone at the branch as well as developing flow in a channel and we extend this method to the separation point into the downstream branch.
Beyond the point of streamline separation, we employ a different method which puts together a vorticity model and the separated boundary layer to generate a recirculating flow wake.
Perktold et al. [8] show very convincingly that recirculation zones do occur in one or both branches of a carotid sinus bifurcation with greater extend as the branch angle increases and as the average inlet velocity increases. Recirculation in both systole and diastole are extensive with the recirculation wake extending to as much as half of the branch diameter. The axial extent of the wake zones was as much as twice the branch diameter. Thus, the zone of low WSS was extensive and occurred in both downstream branches.
The flow distributions and polarizations discussed in this section are calculated in the region bounded by AGCB in Figure 7 and in particular the polarizations are along the wall defined by (AIB), inlet velocity, U0, branching angle, α, channel widths, h, h1, h2 and in some cases the exit velocities U1 and U2.

Figure 7: Geometry of Wake Flow and Boundary Layer Downstream of a Bifurcation.
U0, U1 and U2 and the channel widths are related by an overall mass balance on the branch.
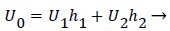 (31)
(31)
A boundary layer analysis described below is first applied to the expanding flow along the curved, permeable wall (AIB) to determine the location of xsep and the flow characteristics upstream of Xsep. P is determined upstream of xsep by (10-13) and (3).
For sufficiently small wall curvatures, low inlet velocity and small expansions, no separation is predicted by these methods. However, for large wall curvatures, high inlet velocities and larger flow expansions, boundary layer separation and wake formation are predicted and the “intensity” and length of the wake increase as these variables increase.
The following equations are used to predict Xsep. For internal flows the momentum equation becomes
 (32)
(32)
where δ, δ1,U and are defined as before.
The geometry of flow in the transition between the main and the branch channel is given by (33). Where R, the flow width, is the streamline separating the fluid that enters the minor branch from the main flow.
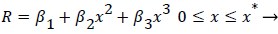 (33)
(33)
Where ≤ x ≤ x* defines the length of the curved section on AIB and R is subject to the boundary conditions,
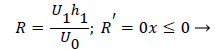 (34)
(34)
 (35)
(35)
(28-30) describe the geometry upstream of separation. R describes the location of the stagnation stream line which ends at the downstream stagnation point H.
Flow in the neighborhood of arterial branches is especially prone to the development of eddy zones within the branches due to the abrupt increase in flow area. The velocity profile upstream of these branches is usually not fully developed and the boundary layer is usually rather thin due to the high velocity in the proximal zones near the heart. When the flow encounters a branch where the flow area increases abruptly, the fluid lateral pressure suddenly increases as the flow decelerates. Boundary layer analysis shows that when the bulk fluid decelerates, the boundary layer separates from the vessel wall, moves out into the fluid (Figure 7) and is displaced from below by a region of reversed flow near the wall. The reverse and forward flows combine to form an eddy, which receives the energy necessary to rotate from the external fluid kinetic energy. The viscous forward boundary layer is displaced by a thin viscous backflow region, which is driven by the forward flow momentum. The concentration boundary layer also separates and recirculates within the recirculating flow zone.
The following method is developed to describe the fluid flow and lipid polarization in the eddy zone downstream of separation. Coordinates x, y are defined by a coordinate transformation as follows,
 (36)
(36)
 (37)
(37)
The wake region is assumed to be a viscous boundary layer flowing over a reverse flow layer near the wall with the external flow displaced by the thickness of the reverse flow and the separated boundary layer. The boundary layer is assumed to continue developing by viscous diffusion. The boundary between the reverse flow and forward flow is essentially the no-slip boundary of zero flow displaced from the wall by the reverse flow layer.
An analysis of the momentum and continuity equations within the reverse flow layer employing vorticity w, we find that the inertial terms tend to cancel out in the recirculating wake, leaving only the viscous terms. Upon integrating the equation for vorticity in the wake, we obtain
 (38)
(38)
That is, the vorticity is a linear function of y. Vorticity is defined as
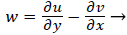 (39)
(39)
Substituting w into the above definition and employing the continuity relation between u and v,
we obtain (subscripts indicate partial differentiation).
 (40)
(40)
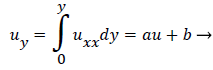
Again neglecting Uxx as small in the reverse flow region, we obtain a quadratic form for u in the wake flow region.
The boundary conditions for the reverse flow region are
 (41)
(41)
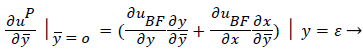 (42)
(42)
where uP is the fourth-order Pohlhausen polynomial applicable to the separated boundary layer.
The result of matching the eddy and external velocities and the application of continuity gives the back flow velocity, uBF
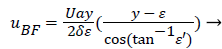 (43)
(43)
Where a (x) is a function of the shape factor defined previously
 (44)
(44)
 (45)
(45)
A mass balance over the eddy is used to relate the external velocity U to the eddy thickness δ0.
 (46)
(46)
δ0 is defined by the location of the so-called zero streamline defined by
 (47)
(47)
 (48)
(48)

The separated boundary layer is assumed to spread by viscous shear according to the following analogy to diffusional processes,
 (49)
(49)
An additional compatibility condition on the backflow region is the matching of the curvature of UBF with UP at y=. Here primes indicate differentiation on.
 (50)
(50)
Expressing UBF in terms and differentiating twice with respect to and cancelling U from both sides, we obtain
 (51)
(51)
Employing the identity where, expressing Λ in terms of δ and U’, substituting for a and solving for U’,
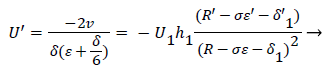 (52)
(52)
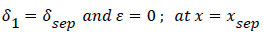
At separation and reattachment ε=0.
Differentiating U in (41) and substituting the expressions for U’ in terms of ε and δ into (50), we obtain an equation for ε’.
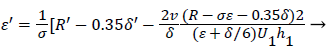 (53)
(53)
The system of equations describing the wake flow are (53) and prior equations, subject to the conditions
are then solved via finite difference step-wise methods
The wall polarization is determined by a different model involving integro-differential balance of lipid over the eddy. The lipid transport model is illustrated in Figures 8.

Figure 8: Concentration Boundary Layer Structure in the Recirculation Zone.
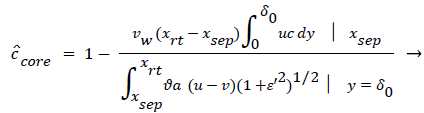
The derivation of the modified wall polarization function is shown in [1]. Note that the form is the same as previously shown with the addition of the core concentration given by (53).
The velocity distribution determined from (42-448 and 38) is then used to calculate ĉcore from (52) which is then used to calculate P from (8-12) where Ccore is substituted for cbulk. Re-expressing (8) in terms of normalized concentration ĉ, we obtain
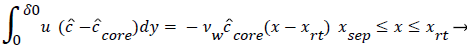 (54)
(54)
 (55)
(55)
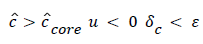
(54) says that a new inner concentration boundary layer builds up inside the separated region and grows in the direction of flow from Xrt to Xsep. The value of Ccore is particularly influenced by the wall shear rate through . The calculation is restricted to those situations where u- v>0, i.e. the normal velocity must not exceed the parallel velocity within the separated layer.
Axial Diffusion
The large axial gradients in P indicated that the assumption of negligible axial diffusion used in this analysis may not always be justified. When axial diffusion is taken into account, equation (53) becomes
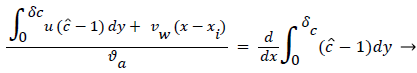 (56)
(56)
Where the flow eddy is assumed to be thin (i.e. δccore=1 and a depends only on x. When (54) was used to calculate P profiles were reduced up to 20% at xsep and Xrt and the peaks were broadened accordingly. However, the basic behavior of P in the eddy region was not altered. The highest value of P in the branch occurred in the eddy region.
Transient Response
The transient equation was not solved for P in this work but it is generally believed [4] that the time-averaged wall shear rate and the bulk flow rate are the primary factors affecting the mass transfer rates at the vessel surface [9].
The degree of polarization occurring in the wake region is reduced as NRe in the inlet (i.e. U0) is increased. This effect may account in part for the effect of physical exercise in lessening the incidence of cardiovascular disease.
Sensitivity Study
For details of the sensitivity study refer to Reference 1.
The model of flow and mass transport was run for a wide variety of inlet velocity, branch velocity, branch angles, and differences such as a fully developed parabolic velocity or flat profile at the entrance to the upstream channel. In many cases boundary layer separation is not found to occur. When it does, the wall polarization is substantial and much larger than in any other region of the flow network. Polarization increases as average inlet velocity decreases and for a fully developed inlet profile [10]. P varies throughout the recirculation zone with peaks at the downstream portions inside the branch. Concentration boundary layer thickness increases dramatically at the separation and near the reattachment points of the viscous boundary layer. Diffusivity drops and stays lower in the recirculation zone and then rises outside.
When U1 is fixed and U0 decreases, Pxsep and Pxrt decreases as expected but Pmax first increases and then decreases. Presumably the initial increase is due to a thickening of δc caused by a thicker wake (δ). The decline for larger U0 results from the over-riding effect of increasing wall shear rate in the wake caused by the high external velocity.
When U0 is held fixed, P decreases at all points in the wake as U1 is increased. This results form a decreasing δc resulting from a small wake length and higher wall shear inside the eddy.
Description of the viscous eddy [1].
For a flat inlet upstream velocity profile , the extent of the backflow region is generally 30% of the branch diameter and the axial extent of the backflow is comparable to the branch radius. The maximum extent of the wake region corresponding to the maximum of the backflow region occurs at above 10% of the branch diameter in the axial direction downstream of the inlet of the branch. The backflow region once reaching the maximum extent decreases gradually and then falls off rapidly in about 10% of the branch diameter at the reattachment point (Figure 9).

Figure 9: Wall Polarization along the Vessel Wall in the Wake Region Downstream of a Branch with Boundary Layer Separation and a Flat Inlet Profile Showing Substantial Increase at the Reattachment Point.
For a fully developed upstream profile the wake is smaller, the extent of backflow is less than 20% of the branch diameter and the wake is more symmetrical and shorter typically extending to only 20% of the branch diameter. Thus the extent of the higher wall polarizations appears to be smaller when the upstream flow is fully developed (Figure 10).

Figure 10: Wall Polarization along the Vessel Wall in the Wake Region Downstream of a Branch with Boundary Layer Separation and a Fully Developed Inlet Profile Showing Substantial Increase at the Reattachment Point.
These results are comparable to those of Perktold et al. [8] who concluded that the location of a plaque correlated with the extent and location of a recirculation zone and subsequent low WSS (wall shear stress) occurring during part of pressure pulse (Figure 11).

Figure 11: Showing P and concentration boundary layer thickness through the length of the viscous wake for the conditions indicated.
Effects of Wall Permeability and Permeation Rate
Because wall polarization increases uniformly as wall permeation rate increases, one might expect still higher polarizations in zones such as branches where wall stresses might be expected to stretch the endothelial cells layer and increase permeation rate. This occurs generally with smoking [9]. Permeation rates increase generally with higher blood pressure. Thus variations in the polarization at the branch are expected to be even larger with increased hydrostatic pressure as well as with increased wall permeability.
Other possible implications of this study are the potential benefits of increased exercise, the reduction in bulk blood lipid levels or the adoption of life styles which wall permeation rates such as nonsmoking and reduced blood pressure.
Significant evidence is put forth for the strong linkage of hypertension and the occurrence and severity of atherosclerotic plaques [3]. As they point out, if the hydraulic flow is a significant factor in macromolecular transport, solute uptake and accumulation should increase with the applied pressure. Thus a strong correlation exists between hypertension and the incidence of atherosclerosis. Referenced papers [11-12] also show the relation between hypertension, increased permeation rate and atherosclerotic incidence.
Summary and Conclusion
The results of this study show that large variations in wall lipid polarization generally exist in the branches of the arterial system. The results shown here are consistent with other work [13-15,16]. Wall concentrations apparently exceed bulk levels to a greater extent in recirculating zones within branches than in developing flow regions upstream or in stagnation flow regions. Stagnation flow zones which have characteristically higher wall mass transfer rates than recirculating zones appear to be more susceptible to develop plaques when bulk blood lipid levels are suddenly increased as in experimentally induced conditions. All three factors, eddy diffusion, wall permeation and expanding arterial flow at branches contribute to the focal accumulations resulting in atherosclerotic plaques. Conditions which influence these three factors such as blood pressure accentuate the effects.
Wall polarization within recirculating zones increases as branch and upstream flow Reynolds Number decrease, as branch angle and wall curvature at the branch increase and when upstream velocity exceeds branch velocity [17]. Although the length of the wake region is generally less than half the vessel diameter, the area affected is likely to shift as blood velocity and wall physical characteristics change.
Augmented diffusion inhibits wall polarization in developing flow and other zones with high wall shear rates while polarization increases sharply in zones where the augmented diffusivity is greatly reduced [18]. These results also explain why plaques form preferentially at the downstream stagnation zone under high doses of cholesterol but don’t form under normal clinical conditions.
References
- Jones GL (1972) A Filtration Theory of Atherogenesis. University of Minnesota, USA.
- Deng X, Wang G (2003) Concentration Polarization of atherogenic lipids in the arterial system. Sci China C Life Sci 46: 153-64.
- Friedlander SK, Walser M (1965) Some aspects of flow and diffusion in the proximal tubule of the kidney. J Theoret Bio 8: 87-96 .
- Gill W N ,Chi T, Zeh D W(1964) Continuous reverse osmosis systems in desalination. I&EC Fund 3 :210.
- Perktold K, Peter RO, Resch M, Langs G (1991)Pulsatile non-newtonian blood flow in three-dimensional carotid bifurcation models: a numerical study of flow phenomena under different bifurcation angles. J Biomed Eng 13: 507-515 .
- Allen DR, Browse NL (1990) Effect of cigarette smoke, nicotine and carbon monoxide on arterial wall permeability and arterial wall uptake of 125 I fibrinogen. Adv Exp Med Biol 95-106.
- Hüttner I, More RH, Rona G (1970) Fine Structural Evidence of Specific Mechanism for Increased Endothelial Permeability in Experimental Hypertension. Am J Path 61: 395-412.
- Wolinsky H (1972) Long Term Effects of Hypertension on the Rat Aorta and Their Relation to Concurrent Aging Changes. Circ Res 30: 301-309.
- Hollander W (1973) Hypertension, Antihypertensive Drugs and Atherosclerosis. Circ Res 48 :1112.
- Buchanan JR, Kleinstreuer C, Truskey GA, Lei M(1999) Relation between non-uniform hemodynamics and sites of altered permeability and lesion growth at the rabbit aorta-celiac junction. Atherosclerosis 143: 27-40.
- Ding Z, Fan Y, Deng X (2009) Effect of concentration polarization on the uptake of LDL by human endothelial cells and smooth muscle cells co- cultured. Acta Biochim Biophys Sin (Shanghai) 41: 146-53.
- Ethier CR (2002) Computational modeling of mass transfer and links to atherosclerosis. Ann Biomed Eng 30: 61-71.
- Ku DN, Giddens DP, Zarins CK, Glagov S (1985) Pulsatile flow and atherosclerosis in the human carotid bifurcation. Positive correlation between plaque location and low oscillating shear stress. Atherosclerosis 5: 293-302.
- Keller KH (1971) Effect of fluid shear on mass transport in flowing blood. Fed Proc 30: 1591-1599.
- Keller KH (1971) Filtration mechanism for atherosclerotic plaque initiation, Mass Transfer Phenomenon in Biological Systems. 112-118.
Citation: Jones GL (2017) Causative Factors for the Initiation of Atherosclerotic Plaques. Atheroscler Open Access 2: 118.
Copyright: ©2017 Jones GL. This is an open-access article distributed under the terms of the Creative Commons Attribution License, which permits unrestricted use, distribution, and reproduction in any medium, provided the original author and source are credited.
Select your language of interest to view the total content in your interested language
Share This Article
Open Access Journals
Article Usage
- Total views: 5591
- [From(publication date): 0-2017 - Oct 15, 2025]
- Breakdown by view type
- HTML page views: 4576
- PDF downloads: 1015