Research Article Open Access
Choosing Instruments for Research: an Evaluation of Two Activity Monitors in Healthy Women
| Constance Visovsky*, Kevin E Kip, Janique Lashae Rice, Marian Hardwick and Patricia Hall | |
| Department of Physical therapy, University of South Florida, USA | |
| Corresponding Author : | Constance Visovsky Department of Physical therapy, University of South Florida 12901 Bruce B. Downs Blvd. MDC 22, Tampa, Florida 33612-4766, USA Tel: 813-974-3831 Fax: 813-974-5418 E-mail: cvisovsk@health.usf.edu |
| Received June 06, 2013; Accepted July 17, 2013; Published July 20, 2013 | |
| Citation: Visovsky C, Kip KE, Rice JL, Hardwick M, Hall P (2013) Choosing Instruments for Research: an Evaluation of Two Activity Monitors in Healthy Women. J Nov Physiother 3:171. doi:10.4172/2165-7025.1000171 | |
| Copyright: © 2013 Visovsky C, et al. This is an open-access article distributed under the terms of the Creative Commons Attribution License, which permits unrestricted use, distribution, and reproduction in any medium, provided the original author and source are credited. | |
Visit for more related articles at Journal of Novel Physiotherapies
Abstract
Introduction/purpose: Activity-based monitors offer researchers a feasible, quantitative means for the assessing physical activity and sleep quality on a consistent and uniform basis. The purpose of this comparative study was to evaluate the reliability and feasibility of the Fitbit 4.10 activity based monitoring system to the standard actigraph Gtx3+ in 42 data points in healthy women.
Methods: A head-to-head comparison of two activity monitoring systems was conducted using data generated from participants who each wore the two monitors simultaneously for 20-22 hours per day for 14 consecutive days. Outcome variables of interest included both physical activity and sleep quality measurements. Data analysis consisted of descriptive statistics for the sample demographics, one measure of association (Pearson r) and three measures of agreement (intraclass correlation, concordance correlation, and Bland Altman plots) to evaluate the reliability of the two activity monitors.
Results: Compared to the actigraph Gtx3+ as the standard, the Fitbit appears to be of limited value in terms of calorie quantification expended per day, times awake per night, and sleep efficiency percentage. While the Fitbit is of practical use and was considered to be more acceptable for use by the participants it has limited utility for reliably capturing research data on energy expenditure, the number of night time awakenings, and sleep efficiency percentage.
Conclusion: The Fit bit shows the potential for reliable use in research studies whose outcome is based on physical activity measurements such as number of steps walked. Studies with a primary outcome of sleep quality may find limitations in this device.
| Keywords |
| Physical activity; Sleep; Activity monitors; Reliability; Aerobic evaluation |
| Introduction |
| Nutrition and physical activity provide the foundation for maintenance of good health and are considered a cornerstone treatment of chronic disease. A present day snapshot of the general population shows a trend of a higher prevalence of obesity, diabetes and cardiovascular disease [1]. This widespread reflection of modern day society indicates a change in lifestyle centered on sedentary activities, including watching television, internet indulgences and gaming. It is in this same vein that researchers, clinicians and policy makers have developed recommendations for the general public regarding proper diet and physical activity to promote overall health, disease prevention and reduce confounding factors associated with the rise in chronic disease reflected in today’s society. According to the U.S. Department of Health and Human Services (DHHS) the Physical Activity Guidelines for Americans, 2 hours and 30 minutes of weekly moderate-intensity physical activity, or 1 hour and 15 minutes weekly vigorous-intensity physical activity can reduce the risk of heart disease, stroke, diabetes, high blood pressure, and common cancers such as colon and breast cancer [2]. Other benefits that can be gained from engaging in regular physical activity include better mental health, improved self-esteem or body image, and healthier relationships. |
| In order for scientific advances to translate into accurate and effective health recommendations for the general population, research conducted on physical activity must be logical, scientifically sound, consistent, and reproducible across the research spectrum [3]. To reliably access, record and analyze physical activity in community and clinic populations, a uniform standard must be followed [4]. Traditional methods for capturing physical activity data including exercise logs, calorimetry, surveys, behavioural observation, and dietary measures have limitations including a lack of validity and reliability. Exercise diaries are subjective and often times either under or overestimate physical activity by participants. Also, diaries used for research purposes pose analytic challenges related to missing data [5]. Laboratory settings used to conduct physical activity assessments fail to provide an environment simulating real life applications [6]. Pedometers and other activity-based monitors pose difficulties in research due to low participant compliance related to feasibility, ease of use and acceptability limitations [7]. |
| The technology driven development of accelerometers has provided an objective method with increased accuracy and validity to record, review and compare exercise data across multiple protocols [8]. Additionally, such monitors are considered more acceptable for use in population-based or clinical research [9]. Having a uniform accurate measure for the purposes of research with considerations for feasible and acceptable use among healthy and clinical populations is an essential next step to increasing the use of such monitors for promoting self-efficacy in health and disease management. |
| While polysomnography is the laboratory standard for assessing sleep, the actigraph is the standard instrument for the measurement of sleep in the natural environment, as the use of polysomnography is expensive and its ecological validity is questionable [10]. Studies show the use of actigraphy for the assessment of sleep quality provides moderate positive correlations to approximated measurements of polysomnography except in the area of sleep latency [11]. The use of actigraphy has continued to expand as a standard device for the accurate documentation of sleep data in both clinical and research settings due to its convenience, feasibility and cost effectiveness [12]. Studies show activity based monitor systems such as actigraph are reliable and valid in the measurement of both intermittent and continuous physical activity levels [13]. An extensive review of published literature showed a lack of information regarding the performance of the Fitbit device in a research setting. The mechanism of the Fitbit, ease of use, positive feedback and cost efficiency coupled with the absence of application in a research setting contributed to the selection of this device for the comparative evaluation conducted. |
| Methods |
| Design |
| A comparative device evaluation was used to assess both activity and sleep levels measured by an activity monitor (GT3X+ accelerometer) and the Fitbit tracker in a pilot sample of three healthy community dwelling women enrolled in a doctoral student research seminar practicum. This is an Institutional Review Board approved comparative analysis. Informed consent was obtained from all participants. |
| Sample and setting |
| Participants were selected for participation through enrolment in a nursing doctoral seminar. A total of three healthy female participants (ages 26, 28, and 56) completed the entire two week trial period. Each participant used the activity monitor in their native environment with no changes or interventions regarding activity or sleep patterns. A fourth participant wore the Fitbit device, but not the GT3X+ accelerometer, and therefore provided qualitative information only on the Fitbit device. |
| Procedures |
| The University of South Florida Institutional Review Board/Ethics Committee approved this comparative device evaluation study which followed all guidelines set forth by the ethics committee for human subject protection. A description of study procedures including research purpose, potential for risk and provisions, lack of guarantee of benefit from participation, confidentiality of responses, voluntary nature of the study, and freedom to withdraw from the study or refuse to participate were included in consent documentation provided to all participants. Written informed consent was obtained from all participants. To protect participants’ confidentiality informed consent documents were kept separate from the data. All data was stored on a password protected computer in the locked office of the investigator. The data was analyzed as a whole set of 42 data points with no reference or link to the contributory participant of any data point. |
| Each participant attended a brief orientation covering each instrument proper functions and recording of required entries for each device to be worn by the participants during the 2-week period. The Fitbit and GT3X+ accelerometer devices were provided to all participants and instructions as their placement was given. Participants were also provided a docking station that allows for syncing of Fitbit activity/sleep data with the online profile database, while simultaneously charging the device. The Fitbit was worn on the upper chest area attached to the bra. A soft wrist band was used at night for recording of sleep parameters. The actigraph Gtx3+ device was worn by one woman on the left hip, one on the left wrist, and the other on the right wrist and a Velcro wrist band for wearing the monitor during the night for recording of sleep data. Each activity monitoring system’s specific data download equipment was also reviewed. The Fitbit requires a participant profile, demographics, and preference for data display on the devise’s internet dashboard. Once the Fitbit is activated, it is synced with the online profile for the Fitbit software, and recording of activity and sleep data can begin. |
| The Fitbit automatically collects data for the number of steps walked, total distance walked and number of flights of stairs climbed. Participants also manually recorded other physical activities on the internet dashboard site such as biking and yoga. Energy expenditure, total steps walked, actual sleep time, total times awaken and sleep efficiency data were all recorded and retrieved from each participant’s dashboard at the conclusion of the two week period. The actigraph Gtx3+ device automatically captures physical activity, energy expenditure and sleep data when the device is worn. However, sleep start and end times were manually recorded to be matched with the device’s capture of horizontal placement of the body. A sleep log was provided to each participant to record both the time they went to bed and the time they got out of bed each of the 14 days of the trial. All sleep logs were manually entered into the actigraph software. The actigraph Gtx3+ was collected from each participant every 7 days for data download and device charging (30 minutes) by the research coordinator. The actigraph software was queried for each participants energy expenditure, total steps walked, actual sleep time, total times awaken and sleep efficiency score. At the conclusion of device comparison, a focus group session was held to access each participant’s experience with the activity monitors for ease of use, and feasibility when wearing the device for the comparison period. This provided similar data elements for the comparison of each activity monitoring system, with 3 participants providing 14 days of data with 42 data points. Each day of the 14 days trial period provided a unit of 42 paired observations. |
| Instruments |
| The GT3X+ accelerometer uses a 3-axis accelerometer and digital filtering algorithms to measure the amount and frequency of human movement. The GT3X+ accelerometer, in conjunction with the Actigraph software application, delivers physical activity and sleep measurements including energy expenditure, steps taken, physical activity intensity and amount of sleep. The compact monitor is 4.6 cm×3.3 cm×1.5 cm, weighs 19grams and can be worn on the waist, wrist, ankle or thigh but for the purposes of this placement of the monitor was restricted to the waist or wrist of each participant. |
| The Fitbit Tracker uses a micro electro-mechanical system (MEMS) 3-axis accelerometer that measures ones’ motion patterns to provide calories burned, steps taken, distance travelled, and sleep quality. The tracker is 5.5 cm×0.5 mm×14 mm and weigh’s 11.34 grams. The tracker utilizes single-button control to the display one of four modes including steps, distance, calories burned and overall activity level on the “1×0.25” blue organic light-emitting diode (OLED) screen. The Fitbit Tracker syncs wirelessly to the base station (included in package) using an ultra-low power 2.4 GHz ANT radio transceiver. Syncing occurs automatically, anytime the tracker is within 15 feet of any base station and relatively motionless. The base station plugs into a Mac or PC USB port. |
| Demographic Data |
| The three women testing the devices were healthy, communitydwelling women. The characteristics of the women were as follows: age (26, 28, 56 years); race (1 Caucasian, 2 African American); body mass index (21.9, 23.6, 29.5). |
| Variables |
| Physical activity variables consisted of energy expenditure in calories and total steps walked. Sleep quality measurements included actual sleep time (total time in bed-time to fall asleep) recordings in minutes, total times awaken during each period of sleep, a sleep efficiency score given by a percentage and total time in bed recording in minutes. For the focus group portion of the comparative assessment, ease of use and feasibility were the variables of interest. |
| Data Analysis |
| The primary intent of the analysis was to evaluate the strength of association and extent of agreement for multiple measures of physical activity and sleep quality between the Fitbit device (test device) and the GT3X+ accelerometer (standard). Each participant contributed 14 matched sets of device data (i.e. daily measurement for 2 weeks) for 6 measures of interest: steps walked per day; calories expended per day; sleep time in minutes, bed time (evening) in minutes; times awake per evening; and sleep efficiency percentage. To assess the strength of association between the 2 devices, Pearson correlation coefficients were calculated. To assess the extent of agreement, the intraclass correlation coefficient (ICC) and concordance correlation were calculated, and Bland-Altman plots were generated. The ICC measures agreement among measurements that are continuous and assumed to be approximately normally distributed, with the coefficient of agreement (devices in our case) adjusted for the effects of the scale of measurements. The concordance correlation coefficient (CCC) is similar to the ICC, yet evaluates the extent of agreement between two readings (device measurements) by measuring the variation from the 45 degrees line through the origin [14]. The Bland-Altman plot (difference plot) graphically compares two measurements techniques by plotting the differences between scores from the two techniques (devices) against the averages of the two techniques [15]. For this pilot evaluation, 95% confidence intervals for the ICC and CCC were calculated without correction for multiple outcome measurements (across 14 days) per participant. |
| Results |
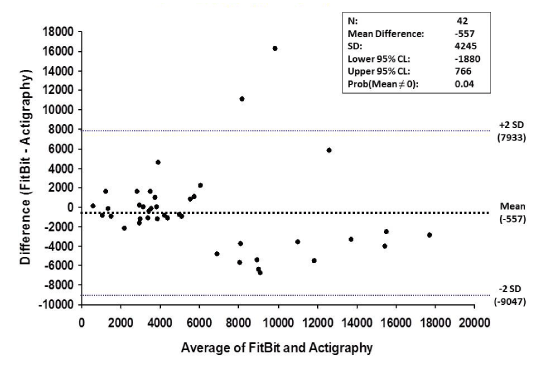
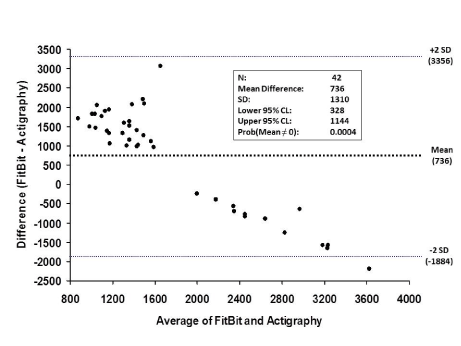
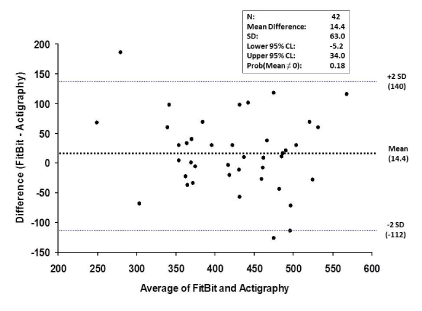
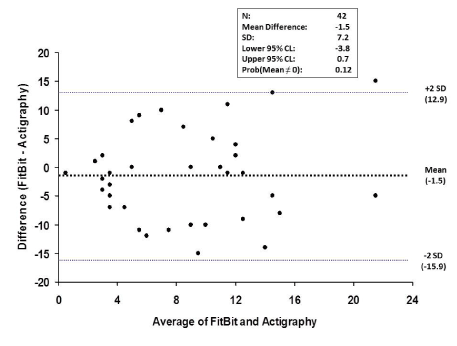
| Results are summarized in Table 1 and Figures 1-6 |
| Measures of Physical Activity |
| For number of steps walked per day, the Pearson, ICC, and concordance correlation coefficients between the actigraph Gtx3+ (standard) and Fitbit (test device) were 0.62, 0.54, and 0.61, respectively (Table 1). This suggested a modest degree of agreement between the 2 devices, and was observed in two of the three participants (A and B in Table 1). In judging how the measurement of steps walked per day differed between the 2 devices, it was clear that at low amounts of physical activity, the differences were small (Figure 1), yet at an average of 6,000 steps per day or more, there was considerable disagreement between the 2 activity monitoring systems. On average, the Fitbit device underestimated the number of steps walked per day with a mean per day difference of -557, and a large 95% confidence interval ranging from -1880 to 766. |
| For calories expended per day, the linear relationship was weak (r=0.30), and there was no evidence of agreement between the 2 devices based on the ICC (r=0.0) and concordance (r=0.10) correlation coefficients (Table 1). The pattern of differences in calories expended as measured by the 2 devices was clearly evident (Figure 2). At an estimated 1,600 calories per day or less, as determined by the actigraph Gtx3, the Fitbit consistently over-estimated caloric expenditure. However, at approximately 2,000 calories expended per day, the reverse pattern was seen whereby the Fitbit device consistently underestimated caloric expenditure. |
| To obtain data related to the ease of use and feasibility of wearing each device, a one hour focus group was held with the women performing the device comparison testing. Women were asked to discuss the experiences wearing each device in terms of ease of use, ability to wear the device consistently throughout the comparison period, and what they liked or disliked about each activity monitor. |
| Measures of Sleep and Sleep Quality |
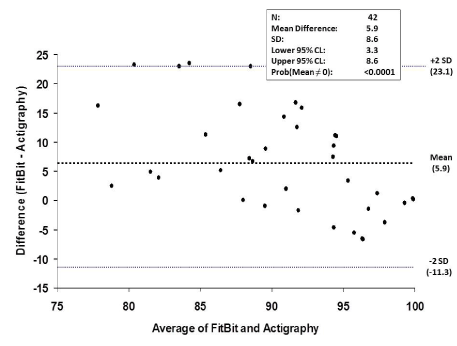
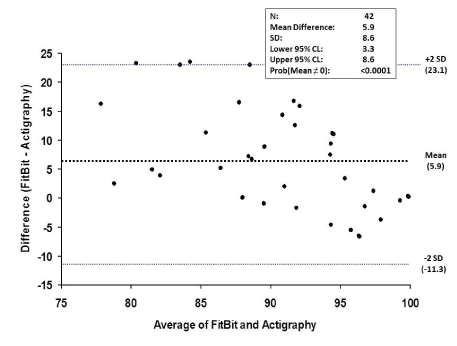
| For sleep time in minutes per evening, the Pearson, ICC, and concordance correlation coefficients between the 2 devices were 0.68, 0.70, and 0.66, respectively (Table 1). This suggested a modest degree of agreement between the 2 devices, and was observed principally in two of the three participants (A and B in table 1). In evaluating differences between the 2 devices there was no discernable pattern (Figure 3). On average, the Fitbit device estimated 14 additional minutes of sleep time per evening (95% confidence interval: -5.2 to 34), and differences between the 2 devices appeared unrelated to the absolute amount of sleep per evening. For the estimated bed time in minutes per evening, Participant B showed a strong degree of agreement between the 2 devices (r=0.94 for all 3 correlation coefficients), whereas the remaining 2 participants showed low to modest agreement (Table 1). On average, the Fitbit device underestimated daily bed time by a mean difference of 3.3 minutes (95% confidence interval: -23.4 to 16.7 minutes), with no apparent pattern related to the absolute amount of time spent in bed. Whereas one participant appeared to show a relatively high level of agreement from the device measurements in the number of times awake per evening (r=~0.69 for all 3 correlation coefficients), the remaining 2 participants showed little to no agreement (Table 1). On average, the Fitbit device underestimated the number of times awake per night by a mean of 1.5 times (95% confidence interval: -3.8 to 0.7) (Figure 4). Finally, there was little to no agreement in the assessment of sleep efficiency between the 2 devices (Table 1). On average, the Fitbit device overestimated sleep efficiency percentage (mean difference=5.9%, 95% confidence interval: 3.3% to 8.6%) particularly when the actigraph Gtx3 recorded a sleep efficiency percentage of 90% or below (Figure 5). |
| Device Feasibility |
| All participants felt that both activity monitors were easy to use and wear consistently throughout the day. However, there were concerns about functionality of the GT3X+ accelerometer related to the wrist band. Women reported that at times the wrist band seemed to slip around on the wrist, loosening the placement of the device. The Fitbit can be attached to the waist band or bra, providing more discreet wear ability as compared to the GT3X+. The Fitbit attached firmly to the area applied, and thus, slippage of the device was not experienced. Additionally, the Fitbit Dashboard permitted women to log food and water consumption, other activities that are not captured in steps (i.e. yoga, bicycling), and provided graphic feedback in terms of activity performed, energy expenditure, and sleep. The Fitbit device itself has an interface that reveals encouraging messages, the user’s name, and the ability to visually track steps taken and distance walked, and stairs climbed throughout the day that serves to encourage physical activity. While these features were not the focus of this comparison, the lack of an interface of the GT3X+ accelerometer was seen as a distinct disadvantage to the women comparing the two devices. The Fitbit and actigraph devices showed a modest degree of agreement with regards to physical activity measures of steps resulting in less than 6,000 steps per day. |
| Discussion |
| The choice of an activity monitoring system for the purpose of research is an important consideration. The researcher must consider reliability and validity of the instrument, as well as feasibility and acceptability to participants. An extensive search of published literature found only one study comparing the Fitbit with actigraphy and polysomnography for evaluation of sleep time and sleep efficiency in 24 healthy adults [16-18], but this study was conducted under controlled conditions, which may not reflect participant’s natural environment. No studies could be found that compared the Fitbit with the actigraph on measures of physical activity. However, there is a great deal of published research examining the actigraph for measuring physical activity [19-27]. A recent multicenter study compared three prominent tri-axial activity monitors for validity (The Dynaport MiniMod, Actigraph GT3X+ and Sense Wear Armband) found the actigraph GT3X+ monitor to be among the most valid for evaluation of standardized physical activities [28]. |
| Our comparative assessment found the Fitbit device to be of limited value for quantifying calories expended per day, times awakened at night, and sleep efficiency. In the evaluation of activity monitor feasibility and ease of use, the participants preferred the Fitbit. The Fitbit was found to be more feasible and acceptable due to its secure fit, and internet-based dashboard featuring visual tracking for overall performance, goals, and communication tools. |
| Measures of the sleep variables from this study found little to no agreement in the assessment of sleep efficiency between the 2 devices (Table 1). This agrees with the only published study of comparing the Fitbit and actigraph GT3X+ [29] which determined that the Fitbit and actigraph lacked congruence concerning total sleep time and sleep efficiency. Similar studies have shown that actigraphy systematically overestimates sleep latency, total sleep time, and sleep efficiency, while it underestimated intermittent awakenings when compared with other laboratory based methods of sleep measurement such as polysomnography [30,31]. Compared with the standard actigraph, this comparative assessment found that the Fitbit device was of considerable value (agreement) for estimating sleep time in minutes and bed time in minutes. Comparison studies on the validity and reliability of the Fitbit device in measures of sleep could not be found in a search of the literature at the time of this evaluation. While it would appear from this comparative evaluation that the Fitbit is preferable to the actigraph GT3X+ for its acceptability and feasibility among community-dwelling healthy women, it lacks the reliability and validity to recommend it for research purposes. The Fitbit’s most promising purpose is most likely to assist individuals in attaining personal physical activity goals through providing feedback and community support via the internetbased dashboard. However, for the purposes of research, it appears that the actigraph GT3X+ remains the standard for measuring physical activity and sleep parameters. |
| Acknowledgement |
| The authors have no funding or conflicts of interest to disclose. |
References |
|
Tables and Figures at a glance
| Table 1 |
Figures at a glance
 |
 |
 |
| Figure 1 | Figure 2 | Figure 3 |
 |
 |
 |
| Figure 4 | Figure 5 | Figure 6 |
Relevant Topics
- Electrical stimulation
- High Intensity Exercise
- Muscle Movements
- Musculoskeletal Physical Therapy
- Musculoskeletal Physiotherapy
- Neurophysiotherapy
- Neuroplasticity
- Neuropsychiatric drugs
- Physical Activity
- Physical Fitness
- Physical Medicine
- Physical Therapy
- Precision Rehabilitation
- Scapular Mobilization
- Sleep Disorders
- Sports and Physical Activity
- Sports Physical Therapy
Recommended Journals
Article Tools
Article Usage
- Total views: 14332
- [From(publication date):
October-2013 - Aug 07, 2025] - Breakdown by view type
- HTML page views : 9621
- PDF downloads : 4711
