Climatology of Atmospheric Flow and Land Surface Fields of Indian Monsoon Captured in High Resolution Global and Regional Climate Model
Received: 02-Apr-2014 / Accepted Date: 27-May-2014 / Published Date: 30-May-2014 DOI: 10.4172/2157-7617.S11-007
Abstract
The high resolution global climate model LMDZ 4 and 5 and regional climate model RegCM4 has been applied over the South Asia domain to hind-cast the Indian summer monsoon (ISM) circulation. For this study, three-land surface parameterization schemes, the Schématisation d’Echanges Hydrique a l’Interface Biosphère et Atmosphère (SECHIBA) coupled with global climate model LMDZ5, the Biosphere Atmosphere Transfer scheme (BATS) and the Community Land Model (CLM) coupled with regional climate model RegCM4 is used for the study. The regional model RegCM4.0 (BATS and CLM coupled) is driven at the lateral and lower boundaries by NCEP/NCAR reanalysis (NNRP2) data for years of excess (1999) and deficit (1987) rainfall, whereas the global model LMDZ5 (SECHIBA coupled) is driven by initial boundary conditions from European reanalysis datasets and AMIP (Atmospheric model Intercomparison project) and NCEP (National Center for Environmental Prediction) SST, Sea-ice boundary conditions, from 19th Oct 1994 to 19th Oct 1996. The results successfully reproduce the observations due to a realistic reproduction of topographic features. The BATS-RegCM4 simulated precipitation shows better capability to produce ISM features. Also, the LMDZ5-SECHIBA model shows better capability to capture ISM features.
Keywords: BATS; CLM; SECHIBA; RegCM4 LMDZ5; Planetary boundary layer height; Precipitation; Moisture flux
10789Introduction
Weather of a place may vary day-to-day depending upon meteorological conditions of the place. Climate represents the weather over a long period of time (generally 30 year average) and is defined by the same meteorological variables, such as temperature, precipitation. In this study we are attempting to study the climatological atmospheric flow and land surface fields in hindcasting mode over Indian Summer Monsoon (ISM) domain using RegCM4 and LMDZ4 and 5 climate models. IPCC has also acknowledged the efforts of the climate researchers in this regard in its recently released AR5 working group report (www.ipcc.ch/report/ar5/wg1). “Downscaled” global climate models with finer resolution produce regional climate scenarios and predictions. The climatological features of ISM for more impacts, adaptation and vulnerability studies at the sub-regional, national and local levels using different climate models are needed to be addressed. New climate studies to study the climatological mean monsoon features all over the world, particularly the ISM are undertaken.
The idea that Limited Area Models (LAMs) could be used for regional studies was originally proposed by Dickinson [1] and Giorgi [2]. This idea was based on the concept of one-way nesting, in which large scale meteorological fields from General Circulation Model (GCM) runs provide initial and time dependent meteorological Lateral Boundary Conditions (LBCs) for high resolution Regional Climate Model (RCM) simulations, with no feedback from the RCM to the driving GCM.
Setting up of the meridional land-sea thermal contrast between the elevated Tibetan Plateau and the tropical Indian Ocean during the boreal summer is the cause of Indian Monsoon (ISM) circulation. Once set up, the ISM circulation is maintained primarily through feedbacks between the large-scale monsoonal flow and the release of latent heat of condensation by moist convective processes Sabin [3]. The accuracy of the ISM rainfall simulations depends heavily on the ability of climate models to realistically capture the interactions among these different scales. The Meteorological Research Institute model from Japan with 20 km horizontal resolution is one of the very high resolution global climate models which has been fairly successful in resolving the ISM orographic precipitation maxima along narrow mountains of the Western Ghats and Myanmar [3,4]. However, studies have reported that conducting ensembles of long climate simulations using such high-resolution AGCMs remains a major challenge because of the huge computational power requirements. While high-resolution Regional Climate Models (RCMs) are computationally less expensive and have the ability to resolve finer scale orographic precipitation, they require specification of lateral boundary conditions thus inhibiting them from providing self-consistent interactions between the global and regional scales of motion.
Hence, in our study we are trying to capture climatology of atmospheric and land surface fields from model runs RegCM4 and LMDZ 4 and 5. Hence, we are also comparing the performance of these models over ISM domain. The present study is organized as follows. Keywords is about the brief description about the models used in this study. Introduction deals with the experimental design. Model Description deals with the results and validation of ISM using LMDZ 4, 5 and RegCM4.0 model. In this study we are trying to validate three popular landsurface parameterization schemes (SECHIBA, BATS and CLM) coupled along with the parent atmospheric models and study the climatological mean monsoon features of ISM. It is also worth to mention here that lateral boundary conditions in RegCM4.0 model is done using exponential relaxation scheme, whereas zoomed LMDZ model uses telescopic zooming facility to facilitate regional climate modelling.
Model Description
LMDZ4 and 5 have been used for this study. They are different versions of a climate model LMDZ developed at Laboratoire de Me’te’orologie Dynamique, France. LMDZ4 is detailed by Hourdin [5]. In these model versions the dynamical equations are discretized on the earth spherical surface in a staggered and stretchable longitude-latitude Arakawa C-grid [6]. The horizontal grid is stretchable (the Z of LMDZ standing for Zoom capability) so that the model can be used for climate studies at regional zooming. The discretization ensures numerical conservation of both enstrophy (square of the wind rotational) for barotropic flows and angular momentum for the axis-symmetric component. The finite-difference formulation thus correctly represents the enstrophy transfer from large to small scales of motions, down to grid-scale cut-off. The model is driven by prescribed Sea Surface Temperature (SST) for oceanic boundary conditions. Being a global model, there is no need for specifying the lateral boundary conditions in LMDZ 4 and 5 [3].
LMDZ5 has a better physics package “New Physics” (NP) as described in Hourdin [7] and involves Orchidee (ORganizing Carbon and Hydrology in Dynamic Ecosystems): a module for carbon, hydrology and vegetation. The time integration is done using a leapfrog scheme, with a periodic predictor/corrector time-step. On the vertical, the model uses a classical hybrid σ−p coordinate levels. The land surface scheme SECHIBA (Schématisation d’Echanges Hydrique a l’Interface Biosphère et Atmosphère) of Ducoudre [8] typifies the vegetal feedback. SECHIBA is one of the three modules of ORCHIDEE and it computes fluxes of momentum, heat, water, surface energy budget and soil water budget (www6.inra.fr/agadapt/regional-planning/Model/ ORCHIDEE). The scheme introduces the concept of surface resistance for transpiration and represents interception loss and storage of the foliage. It accounts for major general classes of vegetation, namely, Bare soil, Tundra, Grassland, Grass and Shrubs, Grass and Trees, Deciduous Forests, Evergreen Forests and Rain Forests etc prepared from Matthews vegetation map [8,9] with their fractional share of a surface grid box.
On the other hand, RegCM4.0 used in this study is well described in Giorgi [10]. However, in brief it is a hydrostatic, compressible, sigmap vertical coordinate model run on an Arakawa B-grid in which wind and thermo dynamical field variables (e.g., zonal (u), meridional (v), vertical (ω) wind velocities, Temperature (T), relative humidity (q) for upper air, surface pressure (P), mean sea-level pressure) are horizontally staggered. The models fastest gravity modes are separated through time-splitting explicit integration scheme.
Experimental Design
We compare two versions 4 and 5 of the LMDZ model, both based on global grids of 360 points in longitude, 180 points in latitude, and 19 hybrid layers in the vertical. In ‘‘no-zoom’’ configuration, the grid points are regularly spread in both longitude and latitude. For the ‘‘zoom’’ configuration, the grids are refined over India and around (0- 40N, 40E-110E) with zooming centered at 15N, 80E. The grid-size in the zoom region is less than 50 km. The resolution becomes gradually coarser away from the zoom centre and thereafter grids size remains uniform of about 110 km over non-zoomed region. For both the zoom and non-zoom model configurations, runs are performed with the LMDZ 4 and 5 model. In both cases, we have used the monthly climatological mean of AMIP (Atmospheric Model Intercomparison Project) and weekly NCEP (National Center for Environmental Prediction) SST as boundary forcing. The convective parameterization scheme used in LMDZ4, 5 simulations is the Kerry Emanuel scheme. The model simulations are validated against observed precipitation datasets of India Meteorological Department [11] which is available at 1o by 1o latitude-longitude grid over India for the period (1951–2007).
In the RegCM4.0 model, the physical parameterizations employed in the simulations include the radiative transfer package of the NCAR Community Climate Model version 3 [12], the boundary layer scheme and the cumulus cloud scheme [13,14] closure, subex moisture flux scheme by Pal [15], and Ocean flux scheme by Zeng [16]. The model is run using this combination of parameterization schemes for extreme years of 1987 for drought and 1999 for flood over India. The chosen configuration results in the most realistic representation of Indian summer monsoon climate [17]. RegCM4.0 was run at approximately 50-km horizontal resolution (100x152 points in x-y direction) on Normal Mercator map projection with 18 vertical sigma levels in the atmosphere and model domain is the South Asia domain from 42°E-110°E, 0-40°N, to include all the significant geographical features of the South-Asian Monsoon region. The central latitude and longitude of the model is 20oN and 76oE. The time step of model integration is 60 seconds. Solar radiation is calculated at 30 minutes time interval; absorption-emission is calculated at 18 hours interval. The time interval at which BATS (Biosphere-Atmosphere Transfer Scheme) land surface scheme is called is 600 seconds. The lateral, lower boundary conditions involve ground temperature (Tg), surface pressure (ps), sea surface temperature (SST) and are provided from NCEP-DOE AMIPII Reanalysis (R-2) 6-hourly data and Reynolds weekly sea surface temperature (SST) [18]. The lateral boundary conditions were updated every 6 hours.
We also evaluate the impact of CLM (Common land Model version 3.5) that describes land-atmosphere interactions using biogeophysical based parameterizations and divides the cell area into sub-grid hierarchy representing types of landuse classes, vegetative land units [9].
Results
Validation of Lmdz4 and 5 models
Over the years, the use of variable resolution AGCMs has proven to be efficient for regional climate downscaling and analyses of mesoscale and finer features. Variable resolution AGCMs does not require any lateral boundary conditions/forcing, avoiding the associated undesirable computational problems. The precipitation rate, wind field pattern and planetary boundary layer height over India during the summer are analyzed using preliminary simulations using the Laboratoire de Me´te´orologie Dynamique Zoom (LMDZ), general circulation model. The analysis based on the evolution of the precipitation rate and the pattern of the sea level pressure. The analysis is for two different continuous years (1995 and 1996) of control run i.e. for 730 days.
Impact of initial and boundary condition in LMDZ4
To study the effects of initial and boundary conditions in LMDZ4, four experiments each with different oceanic boundary forcing, were performed using 1987, 1997 AMIP and NCEP SST and SEA ICE starting from April 1 and May 1 separately. Hereinafter, AMIP and NCEP SST and SEA ICE are identified as ASST and NSST respectively.
The Figure 1 shows the JJAS mean wind (850 hPa) with initial condition of 1 April and 1 May 1987 of NSST, which are compared with the ASST boundary condition of model simulation (AMIP project started in 1990 by World climate research programme). The ASST driven model simulates Somali jet stronger than its NSST counterpart and is closer to observations (~20 m/sec). The maximum value of south westerly low level jet over the Arabian Sea at 850 hpa for year 1987 is 20 m/s from the ASST simulation, while from the NSST simulation; it is 13-15 m/s. For the year 1997 the strength of cross-equatorial flow around the Somali region is around 22 m/sec (Figure 2). Also, cyclonic flow at 850 hPa is seen over north of Bay of Bengal in both the years of ASST simulation. From this analysis it’s concluded that for the climatological ASST simulations the JJAS wind patterns are same for both the 1 April and 1 May initial condition with difference in values. In Figures 3 and 4, the JJAS mean wind at 200 hPa is shown for year 1987 and 1997 respectively. Only the ASST simulations are able to represent the anti-cyclonic wind formation at 200 hPa over Tibetan plateau, not visible clearly in the NSST simulations.
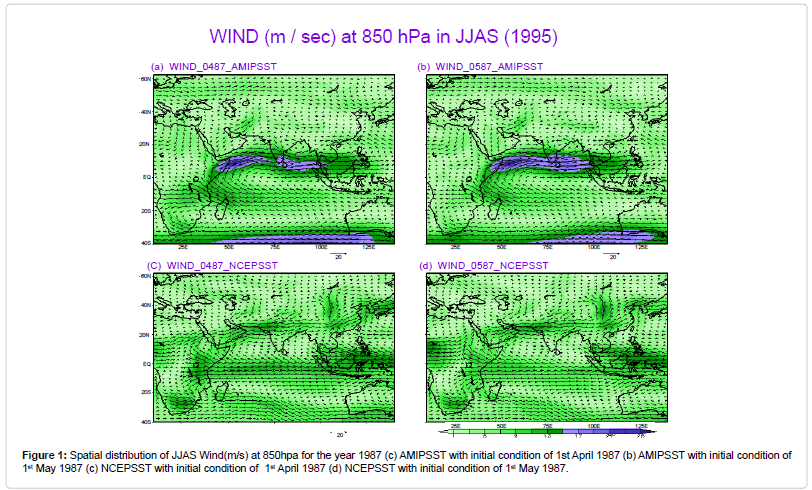
Figure 1: Spatial distribution of JJAS Wind(m/s) at 850hpa for the year 1987 (c) AMIPSST with initial condition of 1st April 1987 (b) AMIPSST with initial condition of 1st May 1987 (c) NCEPSST with initial condition of 1st April 1987 (d) NCEPSST with initial condition of 1st May 1987.
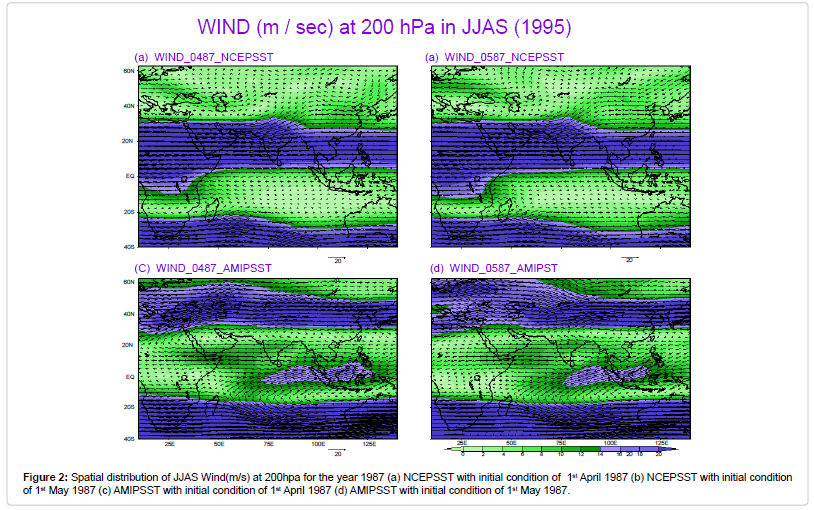
Figure 2: Spatial distribution of JJAS Wind(m/s) at 200hpa for the year 1987 (a) NCEPSST with initial condition of 1st April 1987 (b) NCEPSST with initial condition of 1st May 1987 (c) AMIPSST with initial condition of 1st April 1987 (d) AMIPSST with initial condition of 1st May 1987.
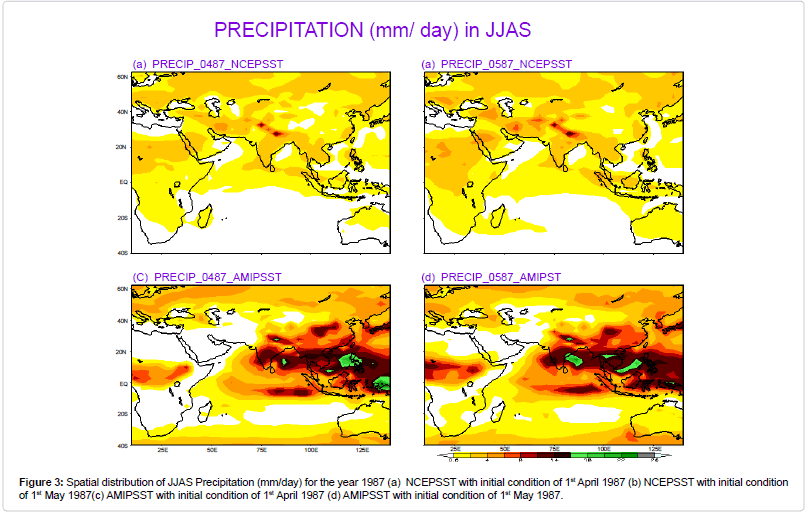
Figure 3: Spatial distribution of JJAS Precipitation (mm/day) for the year 1987 (a) NCEPSST with initial condition of 1st April 1987 (b) NCEPSST with initial condition of 1st May 1987(c) AMIPSST with initial condition of 1st April 1987 (d) AMIPSST with initial condition of 1st May 1987.
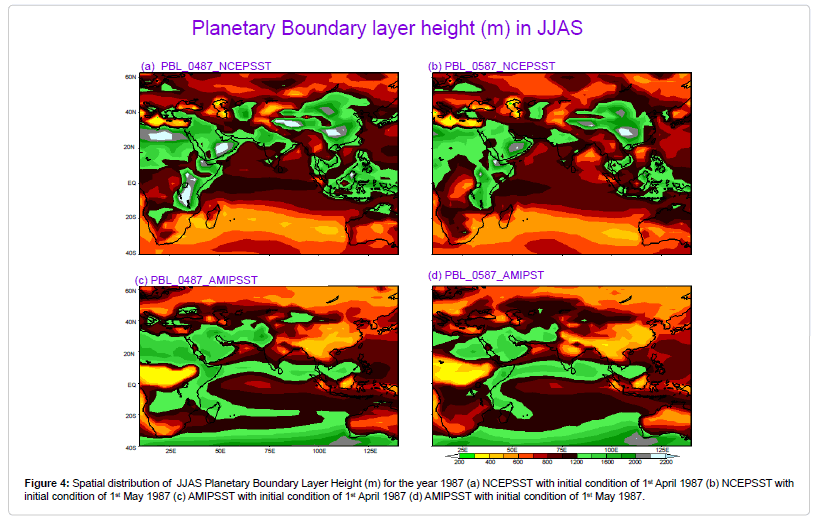
Figure 4: Spatial distribution of JJAS Planetary Boundary Layer Height (m) for the year 1987 (a) NCEPSST with initial condition of 1st April 1987 (b) NCEPSST with initial condition of 1st May 1987 (c) AMIPSST with initial condition of 1st April 1987 (d) AMIPSST with initial condition of 1st May 1987.
The Figures 5 and 6 shows the spatial distribution of JJAS precipitation with initial condition of 1st April and 1st May 1987, 1997 respectively, of NSST, which are compared with the ASST model simulation. Precipitation captured by the ASST model simulation is more than the NSST simulations. It is seen from the Figures that the maximum value of precipitation is around 24 mm/day from the LMDZ4 model simulation while from the NSST simulations are around 10 mm/day. For both the years of simulation i.e. 1987, 1999 the maxima in precipitation are captured over the Western Ghats, north-eastern hills and central India. More precipitation is captured by the ASST simulations in southern India and Bay of Bengal.
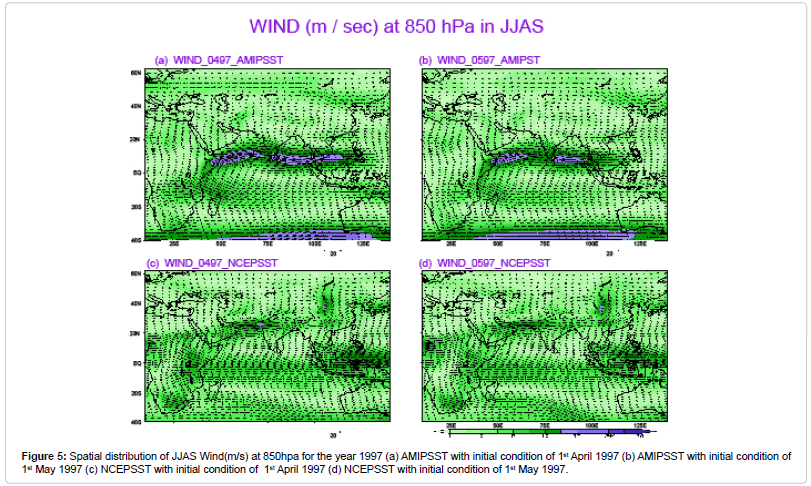
Figure 5: Spatial distribution of JJAS Wind(m/s) at 850hpa for the year 1997 (a) AMIPSST with initial condition of 1st April 1997 (b) AMIPSST with initial condition of 1st May 1997 (c) NCEPSST with initial condition of 1st April 1997 (d) NCEPSST with initial condition of 1st May 1997.
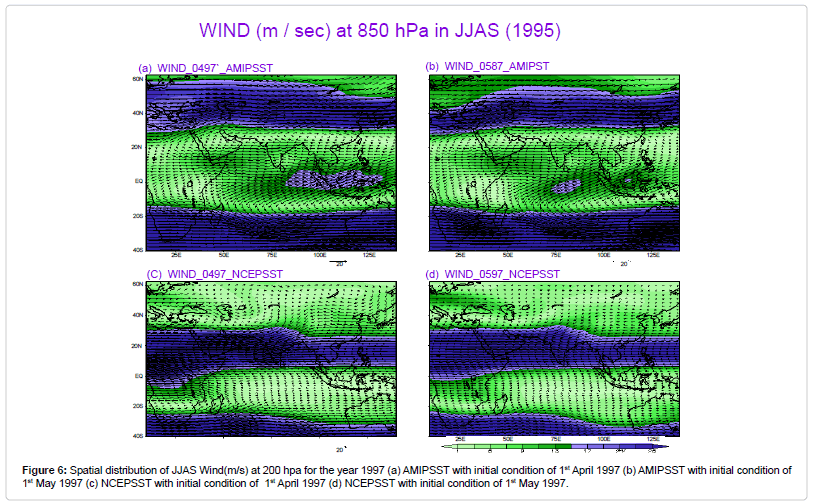
Figure 6: Spatial distribution of JJAS Wind(m/s) at 200 hpa for the year 1997 (a) AMIPSST with initial condition of 1st April 1997 (b) AMIPSST with initial condition of 1st May 1997 (c) NCEPSST with initial condition of 1st April 1997 (d) NCEPSST with initial condition of 1st May 1997.
The Figures 7 and 8 shows the spatial distribution of JJAS Planetary Boundary Layer (PBL) height for year 1987 and 1997 respectively. The plots of PBL for ASST simulation for both 1st April and 1st May are similar to the 850 hPa wind patterns, with high values of PBL height captured over the Somali region. Also, cyclonic structure in PBL height patterns is similar to the 850 hPa wind patterns for both the years of ASST simulation. The ASST simulations are able to interestingly capture the correct representation of PBL in the atmospheric models, one the most important objectives in the AMIP project. Also, regions of high velocity gradients produce layers of high PBL turbulence, is clearly observed from plots of ASST simulations.
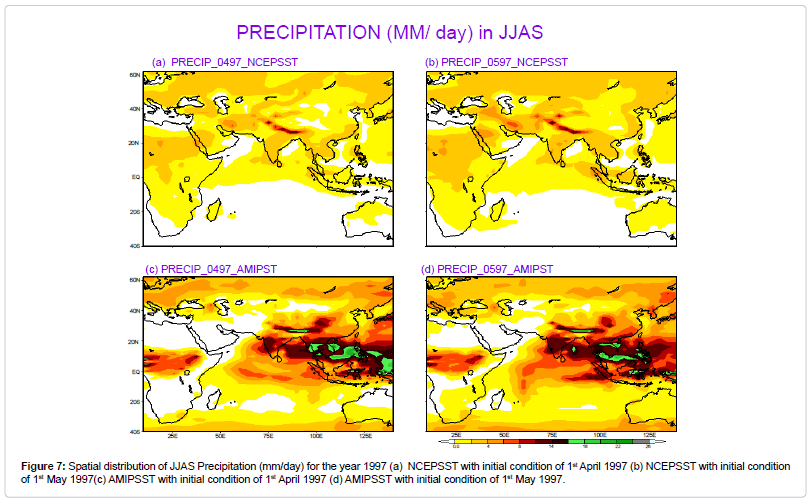
Figure 7: Spatial distribution of JJAS Precipitation (mm/day) for the year 1997 (a) NCEPSST with initial condition of 1st April 1997 (b) NCEPSST with initial condition of 1st May 1997(c) AMIPSST with initial condition of 1st April 1997 (d) AMIPSST with initial condition of 1st May 1997.
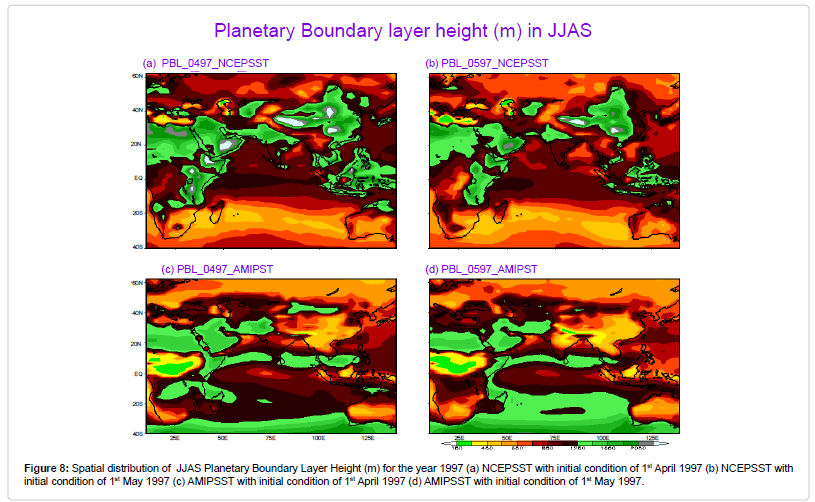
Figure 8: Spatial distribution of JJAS Planetary Boundary Layer Height (m) for the year 1997 (a) NCEPSST with initial condition of 1st April 1997 (b) NCEPSST with initial condition of 1st May 1997 (c) AMIPSST with initial condition of 1st April 1997 (d) AMIPSST with initial condition of 1st May 1997.
To study the sensitivity of LMDZ5 model to landuse, zoom enabled SECHIBA coupled LMDZ5 model was run with initial condition of 19th Oct 1994. The duration of the run was from 19th Oct 1994 to 19th Oct 1996. The Figures 9 and 10 shows the JJAS precipitation for the years 1995 and 1996 with initial condition of 19th Oct 1994.The model remains stable with ASST boundary conditions for 730 days of model run. The precipitation captured by with zoom and with vegetation is more than other simulations and near to the observed values (visually verified). It is seen from the Figures that the maximum value of precipitation is around 25mm/day from the model simulation with ASST boundary conditions and with zoom and vegetation enabled.
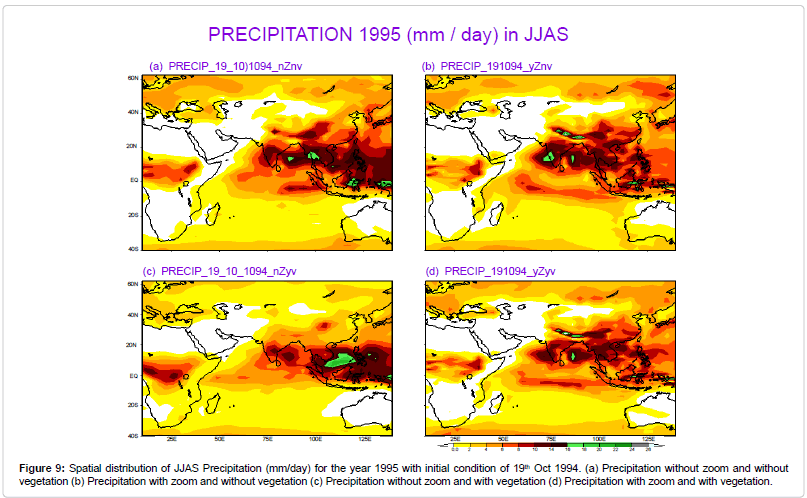
Figure 9: Spatial distribution of JJAS Precipitation (mm/day) for the year 1995 with initial condition of 19th Oct 1994. (a) Precipitation without zoom and without vegetation (b) Precipitation with zoom and without vegetation (c) Precipitation without zoom and with vegetation (d) Precipitation with zoom and with vegetation.
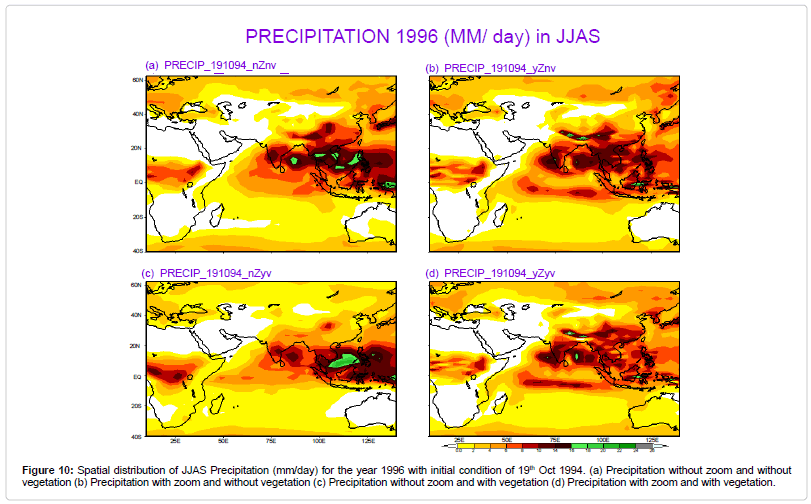
Figure 10: Spatial distribution of JJAS Precipitation (mm/day) for the year 1996 with initial condition of 19th Oct 1994. (a) Precipitation without zoom and without vegetation (b) Precipitation with zoom and without vegetation (c) Precipitation without zoom and with vegetation (d) Precipitation with zoom and with vegetation.
The Figures 11 and 12, shows the JJAS mean wind at 850 hPa level for the year 1995-96 with initial condition of 19th Oct 1994 of ASST model simulation. The value of cross equatorial Somali jet formed in the ASST model simulation with zoom and with vegetation is closer to observations and its value is about 24 m/s. The cyclonic south westerly low level winds are formed over the Arabian Sea and peninsular India. From this analysis, it concluded that the wind patterns captured by LMDZ5 simulations with zoom and vegetation are closer to observations. From this analysis it’s concluded that high resolution vegetation is significantly required as in LMDZ5 for improving the skill of a model.
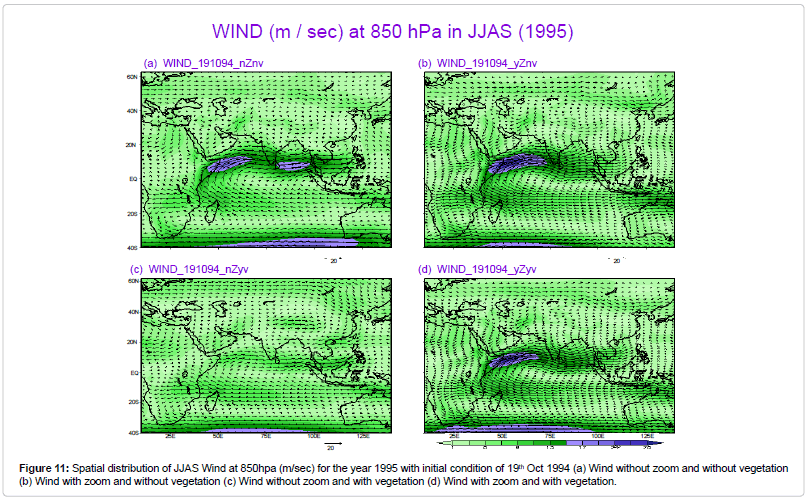
Figure 11: Spatial distribution of JJAS Wind at 850hpa (m/sec) for the year 1995 with initial condition of 19th Oct 1994 (a) Wind without zoom and without vegetation (b) Wind with zoom and without vegetation (c) Wind without zoom and with vegetation (d) Wind with zoom and with vegetation.
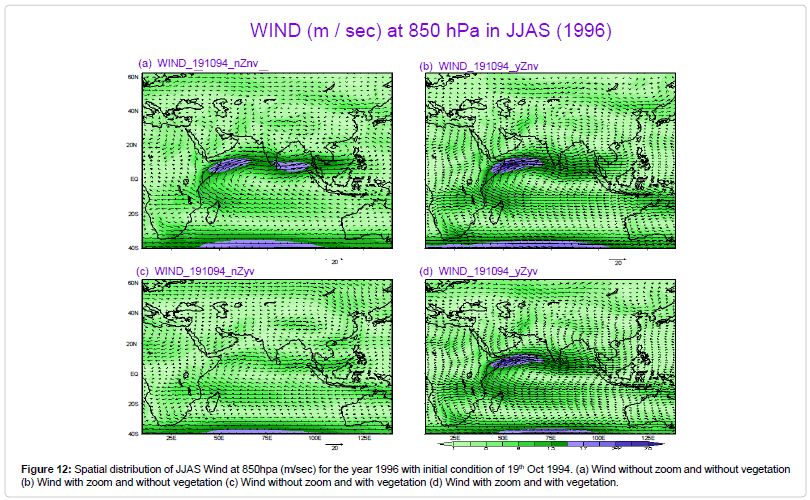
Figure 12: Spatial distribution of JJAS Wind at 850hpa (m/sec) for the year 1996 with initial condition of 19th Oct 1994. (a) Wind without zoom and without vegetation (b) Wind with zoom and without vegetation (c) Wind without zoom and with vegetation (d) Wind with zoom and with vegetation.
For the JJAS season, the difference in precipitation using SECHIBA coupled LMDZ5 (no zoom and with vegetation) and IMD is shown in Figures 13 and 14. There is minor precipitation bias of -1 to -3 mm/ day over the northern half of India. For southern half of India the opposite positive bias up to +4 mm/day is witnessed. The difference in precipitation using LMDZ5 (no zoom and no vegetation) and that of IMD is shown in Figure 14. There is strengthened and broadened positive bias over the southern half of India and over Himachal Pradesh region of north India except that there is negative bias. This justifies the positive role of vegetation in model skill.
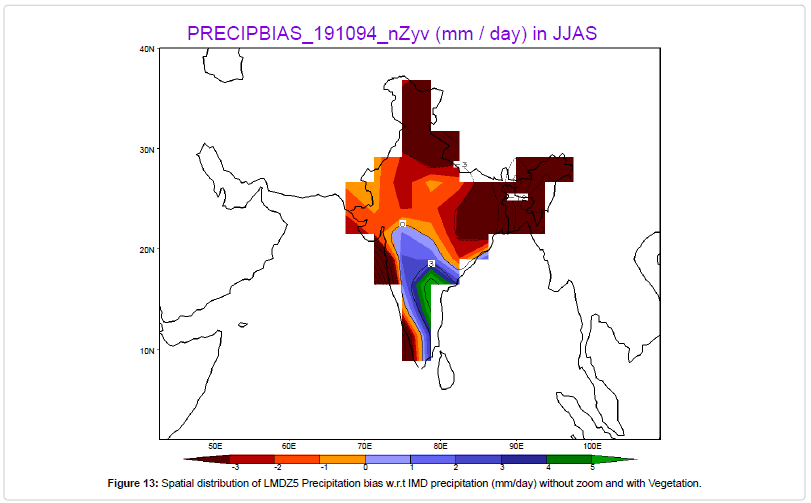
Figure 13: Spatial distribution of LMDZ5 Precipitation bias w.r.t IMD precipitation (mm/day) without zoom and with Vegetation.
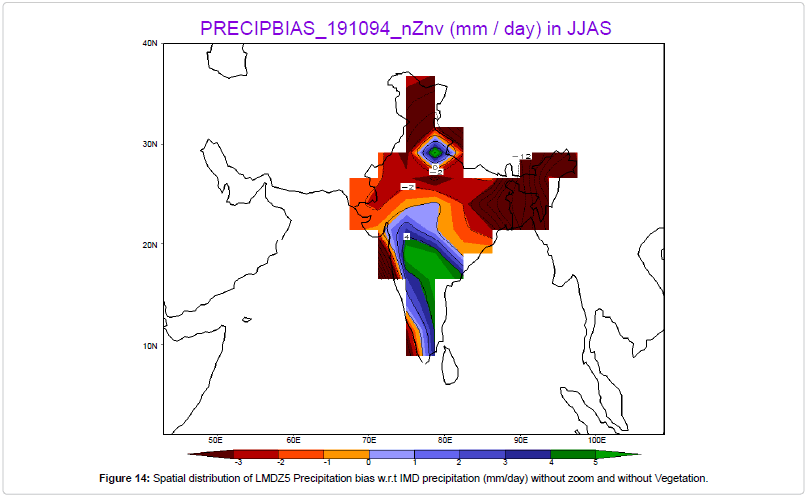
Figure 14: Spatial distribution of LMDZ5 Precipitation bias w.r.t IMD precipitation (mm/day) without zoom and without Vegetation.
Validation Of regcm4.0 model
The Regional Climate model RegCM4.0 is integrated over South– Asia domain for the period of 1st January to 31st December for excess year 1999 and deficit year 1987, rainfall. For our landsurface processes studies, two land surface parameterization schemes, the Bio-sphere Atmosphere Transfer scheme (BATS) and the Community Land Model (CLM) were coupled separately to the model RegCM4.0.
At 850 hPa there is cyclonic formation of winds in the Arabian sea region for both BATS and CLM model for the extreme years 1987, 1999 but the strength of Somali jet in the BATS scheme is varying between 16-18 m/sec for year 1987 and between 18-22 m/sec for the year 1999, whereas in CLM scheme it is between 12-14 m/sec for year 1987 and 10-14 m/sec for the year 1999 (Figure 15). From the BATS simulation, the strength of the Somali jet is stronger for wet year 1999 than dry 1987. Simultaneously, stronger northerly winds are also captured over the foothills of Himalaya for the year 1999.
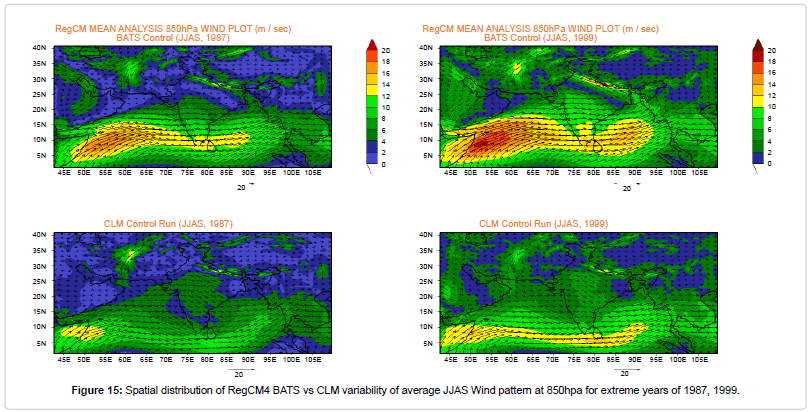
Figure 15: Spatial distribution of RegCM4 BATS vs CLM variability of average JJAS Wind pattern at 850hpa for extreme years of 1987, 1999.
The BATS-RegCM4 captures intensified precipitation maximum over Western Ghats and North-East India for the year 1999 than CLM-RegCM4 (Figure 16). Over the Indo-Gangetic foothills of the Himalayan region, 1987 and 1999 rainfall are captured by the BATSRegCM4. The 1987 precipitation maxima is however not captured over Western ghats by both BATS and CLM RegCM4 (Figure 16). In BATSRegCM4, the JJAS mean moisture flux greater than 80% is noticed over western ghats and north-east India (Figure 17). Also, over PI and CI the moisture flux convergence is less in the CLM-RegCM4(~50%) than BATS-RegCM4(~ 80%). Thereby, it leads to more precipitation over land regions in the BATS than CLM induced RegCM4.
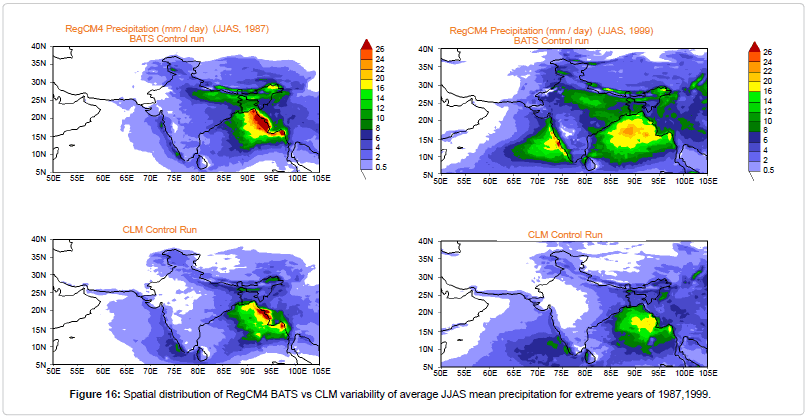
Figure 16: Spatial distribution of RegCM4 BATS vs CLM variability of average JJAS mean precipitation for extreme years of 1987,1999.
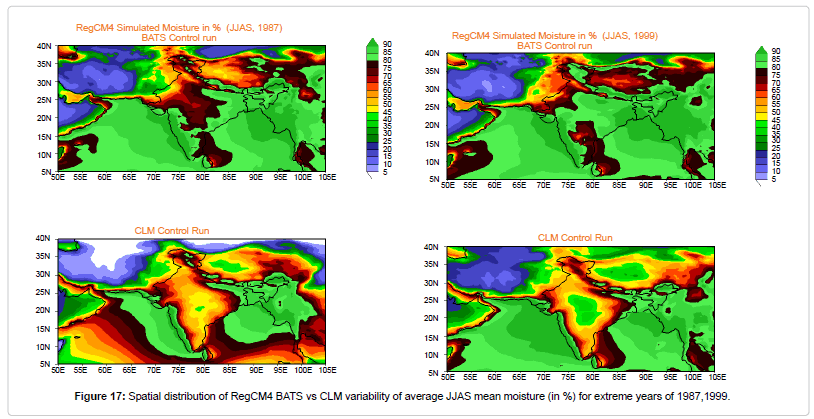
Figure 17: Spatial distribution of RegCM4 BATS vs CLM variability of average JJAS mean moisture (in %) for extreme years of 1987,1999.
The spatial distribution of PBL height in the BATS-RegCM4 model for the year 1999 follws similar pattern to 850 hPa wind pattern (Figure 18). The oceanic region near Somali where high wind speeds at 850 hPa are captured, are also the regions of higher PBL height. The CLMRegCM4 model is not able to capture the same picture and is capturing higher PBL height over central (CI) and peninsular (PI) India. It is also capturing PBL height greater than 1500 m over CI and PI during the year 1999. Theoretically Navier-Stokes equation suggest that the planetary boundary layer turbulence is produced in the layer with the largest velocity gradients that is at the surface proximity. Hence, it can be concluded that BATS-RegCM4 is able to capture the correct patterns of wind and PBL height during the JJAS season.
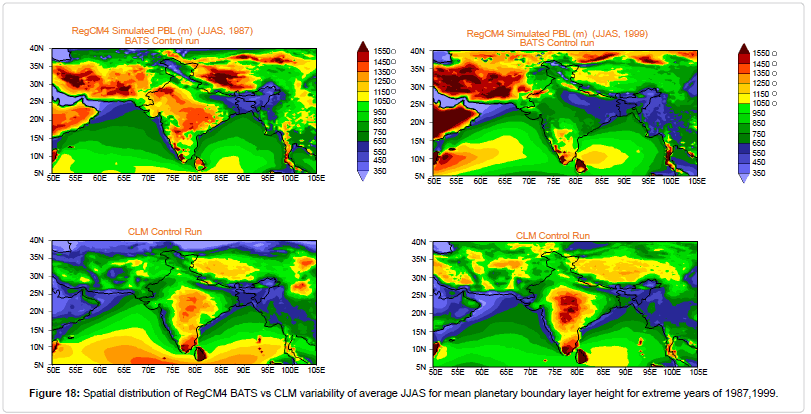
Figure 18: Spatial distribution of RegCM4 BATS vs CLM variability of average JJAS for mean planetary boundary layer height for extreme years of 1987,1999.
The bias in the CLM coupled RegCM4 model is negative over whole of India except north regions of Jammu and kashmir, both for year 1987 and 1999. Over CI the bias goes upto -10 mm/day (Figures 19 and 20). Hence, CLM coupled RegCM4.0 model is not able to capture correct JJAS precipitation over the CI region.There is also bias of around -2 to -4 mm/day in the BATS coupled RegCM4.0 model over Western Ghats, CI and eastern regions of India for the drought year of 1987 (Figure 21). For the year 1999 there is positive bias of around +3 mm/day over PI, north and northwestern regions of India (Figure 22).
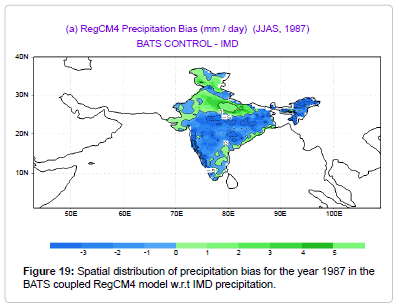
Figure 19: Spatial distribution of precipitation bias for the year 1987 in the BATS coupled RegCM4 model w.r.t IMD precipitation.
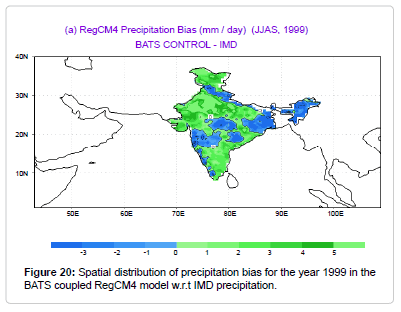
Figure 20: Spatial distribution of precipitation bias for the year 1999 in the BATS coupled RegCM4 model w.r.t IMD precipitation.
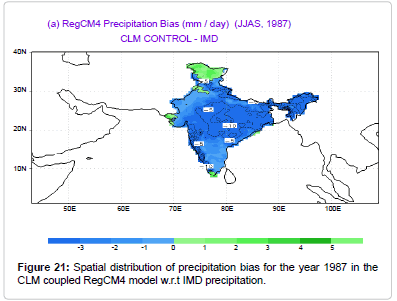
Figure 21: Spatial distribution of precipitation bias for the year 1987 in the CLM coupled RegCM4 model w.r.t IMD precipitation.
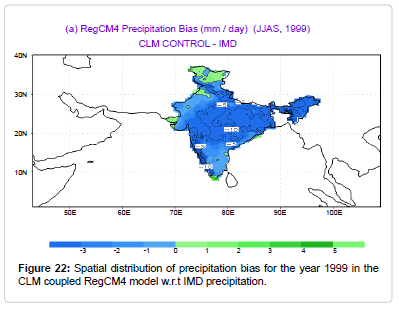
Figure 22: Spatial distribution of precipitation bias for the year 1999 in the CLM coupled RegCM4 model w.r.t IMD precipitation.
Conclusion
Through our preliminary studies we are attempting to capture the climatology of atmospheric flow and land surface fields using global (LMDZ 4 and 5) and Regional Climate (RegCM4) models. This global model study addresses the impacts of vegetal feedback on the simulated monsoon circulation thereby, yielding monsoon precipitation satisfactorily close to realistic climate. Differential mean circulation among sensitivity integrations, however point to the significant role vegetation could play in underlining model land-surface feedback to atmospheric circulation especially in the predictability of ISM. The northward propagation of model precipitation events is found to follow the real climatic manifestation of intraseasonal behavior of ISM, the internal mode of monsoon dynamics. The biosphere-atmosphere interaction attributes as significant forcing exhibit the following: (a) the defining role of land surface physiographic characteristics in spatial structures of ISM regimes in conjunction with internal dynamics. (b), the evolutionary role in propagation of ISM through its influence on precipitation events.
In regional climate model study an attempt is made to simulate the excess, deficit precipitation years over South Asia. Precipitation and circulation features associate with the excess and deficit year are well simulated by the model. Verification measures used for forecast evaluation indicate that high-resolution regional climate model could simulate circulation and precipitation during JJAS months with reasonable accuracy (Figure 15). The impact of replacing the current land surface parameterization (BATS) in a regional climate model with the newly developed Common land Model (CLM) version 3.5 allows a preliminary evaluation of the performance CLM versus the previous land surface parameterization (BATS) in a RegCM. With RegCM4, BATS captures the trend of the ISM features better than CLM. Also, the LMDZ - ASST and the BATS-RegCM4 are able to simulate the correct representation of atmospheric field variables such as PBL, precipitation, wind fields, moisture flux. A realistic ISM is resolved through zooming of a LMDZ5-GCM with remarkable improvements in representing the associated precipitation and circulation features. Overall the results show that high and variable resolution regional climate modelling using LMDZ5 or regional climate modelling with lateral boundary conditions using relaxation, exponential technique realistically captures the monsoon large-scale dynamics.
Acknowledgement
We are thankful to Abdus Salam International Centre for Theoretical Physics, Trieste, Italy for making available the model codes of RegCM4.0 for this study. We also thank the LMDZ group in France for the LMDZ model codes and basic installation script. The first author acknowledges Prof. O. P. Sharma at IIT Delhi for providing necessary academic encouragement to do LMDZ4 general circulation modelling, Dr. Frederic Hourdin for LMDZ5 tutorials and Dr. Hashmi Fatima for her programming related help. We also thank India Meteorological Department (IMD) for providing precipitation datasets and National Center for Environmental Prediction/National Center for Atmospheric Research (NCEP/NCAR) for providing high-resolution meteorological datasets. The first author also thanks the central cloud - computing facilities available at Computer Services Centre, IIT Delhi and Centre for Atmospheric Sciences for the climate model simulations. The websites www.ccr.aos.wisc.edu and http://www.jamstec.go.jp/frsgc/research/iprc/nona/ grads.html is acknowledged for easy tools. The anonymous reviewer for his/her useful comments to improve the manuscript is acknowledged.
References
- Dickinson RE, Errico RM, Giorgi F, Bates GT (1989) A regional climate model for the western United States. Clim Change 15: 383-422.
- Giorgi F (1990) Simulation of regional climate using a limited area model nested in a general circulation model. J Clim 3: 941-963.
- Sabin TP, Krishnan R, Ghattas J, Denvil S, Jean-Louis D, et al. (2013) High resolution simulation of the South Asian monsoon using a variable resolution global climate model. ClimDyn 41: 173-194.
- Krishnan R, Sabin TP, Ayantika DC, Kitoh A, Sugi M, et al. (2012) Will the South Asian monsoon overturning circulation stabilize any further? ClimDyn 40: 187-211.
- Hourdin F, Muscal I, Bony S, Braconnot P, Codron F, et al. (2006) The LMDZ4 general circulation model: climate performance and sensitivity to parameterized physics with emphasis on tropical convection. ClimDyn 27: 787-813.
- Sadourny R, Laval K (1984) January and July performance of the LMD general circulation model. In: New perspectives in climate modelling. Elseveir Science Publishers, Amsterdam.
- Hourdin F, Grandpeix JY, Rio C, Bony S, Jam A, et al. (2013) LMDZ5B: the atmospheric component of the IPSL climate model with revisited parameterizations for clouds and convection. ClimDyn 40: 2193-2222.
- Ducoudré N, Laval K, Perrier A (1993) SECHIBA, a new set of parameterizations of the hydrologic exchanges at the land-atmosphere interface e within the LMD atmospheric general circulation model. J Clim 6: 248-273.
- Matthews E (1983) Global vegetation and land use: new high-resolution data bases for climate studies. J Clim App Meteorol 22: 474-487.
- Giorgi F, Coppola E, Solmon F, Mariotti L, Sylla MB, et al. (2012) RegCM4: model description and preliminary test over multi CORDEX domains. Clim Res 52: 7-29.
- Rajeevan M, Bhate J, Kale JD, Lal B (2006) High resolution daily gridded rainfall data for the Indian region: analysis of break and active monsoon spells. Curr Sci 91:296-306.
- Kiehl JT, Hack JJ, Bonan GB, Boville BA, Breigleb BP, et al. (1996) Description of the NCAR community climate model (ccm3), Tech. Rep. NCAR/TN-420+STR. National Center for Atmospheric Research, USA.
- Grell G (1993) Prognostic evaluation of assumptions used by cumulus parameterizations. Monthly Weather Rev121: 764-787.
- Fritsch JM, Chappell CF (1980)Â Â Numerical prediction of convectively driven mesoscale pressure systems. Part 1: Convective parameterization. J Atmos Sci37: 1722-1733.
- Pal JS, Small EE, Eltahir EA (2000) Simulation of regional-scale water and energy budgets: Representation of sub grid cloud and precipitation processes within RegCM, J. Geophys. Res Atmos105: 29579–29594.
- Zeng X, Zhao M, Dickinson RE (1998) Intercomparison of bulk aerodynamic algorithms for the computation of sea surface fluxes using toga coare and tao data. J Clim11: 2628-2644.
- Lodh A, Jha S, Raghava R (2011) Impact of El Niño and La Niña on soil moisture - precipitation feedback of Indian monsoon over Central India. Int. Arch. Photogramm. Remote Sens. Spatial Inf. Sci., XXXVIII-8/W20, Bhopal, India.
- Reynolds RW, Rayner NA, Smith TM, Stokes DC, Wang W (2002) An improved in situ and satellite SST analysis for climate. J Clim 15: 1609-1625.
Citation: Lodh A, Raghava R, Singh K, Kumar S (2014) Climatology of Atmospheric Flow and Land Surface Fields of Indian Monsoon Captured in High Resolution Global and Regional Climate Model. J Earth Sci Climat Change S11: 007. DOI: 10.4172/2157-7617.S11-007
Copyright: © 2014 Lodh A, et al. This is an open-access article distributed under the terms of the Creative Commons Attribution License, which permits unrestricted use, distribution, and reproduction in any medium, provided the original author and source are credited.
Select your language of interest to view the total content in your interested language
Share This Article
Recommended Journals
Open Access Journals
Article Tools
Article Usage
- Total views: 15561
- [From(publication date): 0-2014 - Aug 08, 2025]
- Breakdown by view type
- HTML page views: 10861
- PDF downloads: 4700