Comparison between Dynamic Contrast-Enhanced Magnetic Resonance (DCE-MR) and Dynamic Contrast-Enhanced Ultrasound (DCE-US) in the Imaging of Pediatric Extra-Cranial Tumor
Received: 08-Jun-2020 / Accepted Date: 03-Jul-2020 / Published Date: 10-Jul-2020 DOI: 10.4172/2167-7964.1000321
Abstract
Background: Dynamic contrast-enhanced magnetic resonance imaging (DCE-MR) is becoming a widely accepted complementary method for diagnosing cancers. This technique is useful to predict and monitor the tumor response to the therapy, but it takes a longer scanning time and may not be readily available in some places. The use of dynamic contrast-enhanced ultrasound (DCE-US) is a new functional technique enabling a quantitative assessment of solid tumor perfusion in adults. Its usefulness in pediatric patients had not been determined.
Objective: To compare DCE-US curve parameters with different curve patterns of DCE-MR and assess if it can achieve the same purpose as in DCE-MR; and to explore the potential role and benefits of DCE-US in the diagnosis and treatment monitoring of pediatric extra-cranial tumors.
Methods: Children with suspected extra-cranial solid tumors, including newly diagnosed or follow-up cases of confirmed tumors, were recruited. DCE-MR was performed, and enhancement curves were plotted and categorized into type 1, 2 and 3 curves. DCE-US was then performed afterwards. Their enhancement curves and parameters were compared. The change in DCE-MR curve patterns, tumor size, predicted tumor activities and DCE-US parameters were correlated with histologic sections of the resected specimens or PET-CT in follow-up cases.
Results: There were total 26 studies, involving 17 patients (M=9, F=8) with average age 4.8 years old (range: 1-19 years old). Average scanning time was 15 minutes in DCE-US and 30-45 minutes in DCE-MR. DCE-US curve parameters correlated significantly with cases with type 3 DCE-MR curve, which had a larger slope of increase and peak intensity. For follow-up cases (n=6), DCE-MR curves changed from type 3 curve to type 1 or 2 curves in 4 cases, and there was no change in curve pattern in 2 cases. All tumors decreased in size after treatment. The slope of increase and peak intensity for DCE-US curves showed strong positive correlation with tumor size (R= 0.52 and R = 0.56). Time to peak for DCE-US curves showed strong negative correlation with tumor size (R=-0.73). DCE-MR predicted tumor activities were correlated closely with pathology or PET-CT findings (accuracy = 83.3%). DCE-US showed an increase in half-time (100%), wash-in time (83.3%) and time to peak (83.3%) in post-treatment cases, which were correlated closely with pathology or PET-CT findings.
Conclusion: US contrast is safe and easy to use in children. DCE-US curve parameters showed statistically significant correlation with type 3 DCE-MR curve, suggesting that they might have comparable utility in aggressive malignant tumors. Serial DCE-US, which has a shorter scanning time and easily available, may have a role in the monitoring of treatment response of pediatric extra-cranial tumor, resulting in more potential benefits for pediatric patients.
Keywords: Dynamic contrast; Dynamic contrast ultrasound; Extracranial tumor; Children; Pediatric
Introduction
Dynamic contrast-enhanced magnetic resonance imaging (DCEMR) is becoming a widely accepted complementary method for diagnosing cancers in adults [1]. This technique is also useful to predict tumor response to anticancer therapy and monitor the tumor response to the therapy [2-4]. Previous studies using DCE-MR demonstrated that malignant tumors usually showed faster and higher levels of enhancement than normal tissue [5]. This enhancement characteristic indicated that malignant tumors increased vascularity and endothelial permeability to the contrast molecules than that of normal or less aggressive malignant tissues. Weidner et al. [6] demonstrated that in many tumors, the measurements of microvascular density made on histopathological samples correlated closely with different clinical stages.
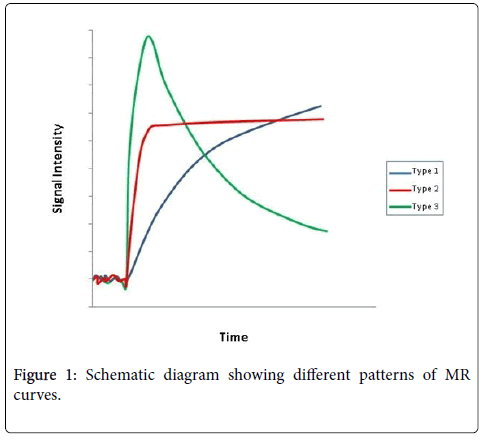
The relationship could be due to the rapid tumor growth which could only be supported by highly active angiogenesis. The more aggressive tumors were therefore associated with higher angiogenesisrelated microvasculature abnormalities. Based on this histopathological evidence it had been suggested that DCE-MR might be able to provide additional independent indices of angiogenic activity and could therefore act as a prognostic indicator in a broad range of tumor types. DCE-MR time intensity curve (TIC) patterns are categorized into three types: type 1, persistently enhancing (progressive), which suggests less angiogenic; type 2, plateau type, which has an intermediate probability for malignancy; and type 3, washout type, which is indicative of malignancy with a lot of angiogenesis [7,8].
Our previous study [9] on the application of DCE-MR in a broad range of pediatric extra-cranial tumors showed similar results as in adults. Type 1 curve with maximal enhancement intensity (SImax) less than 350 may be an additional indicator for benign or inactive tumors. The extent of tumor necrosis was correlated closely with pathology findings in follow-up cases. The lack of irradiation has an advantage over CT or PET in pediatric applications.
Use of ultrasound contrast in children is a new development. Offlabel use is generally widespread especially in pediatric, as many drugs have not been tested separately in children. The use of dynamic contrast-enhanced US (DCE-US) is a new functional technique enabling a quantitative assessment of solid tumor perfusion using raw linear data in adults [10]. Comparison between DCE-US with dynamic contrast-enhanced computed tomography (DCE-CT) had been performed in the evaluation of hepatocellular carcinoma in adult [11]. Egger et al. showed no statistical difference between DCE-US and DCE-CT in the quantitative assessment of contrast enhancement. In a study comparing DCE-US with DCE-MR and DCE-CT for the assessment of vascular response to Sunitinib in renal cell carcinoma in adult [12], Bjarnason et al. found that DCE-US might help select optimal scheduling for novel anti-angiogenic drugs.
DCE-US is a useful instrument for early prediction of tumor therapy responses. Hoyt et al. [13] evaluated whether DCR-US could predict the response of breast tumors to bevacizumab therapy using a murine model. The breast cancer response to a single dose of bevacizumab in the murine model was immediate and transient, and revealed that the tumor perfusion data within 3 days of bevacizumab dosing were sufficient to minimize the prediction error to 10%; whereas measurements of physical tumor size alone did not appear adequate to assess the therapeutic response. Merz et al. [14] found that DCE-US could predict antiangiogenic treatment responses using Sunitinib within 2 days in 20 rats with experimental breast cancer bone metastases. So far there was no literature comparing DCE-US with DCE-MR in children. The usefulness of DCE-US in pediatric patients had not been determined.
The aim of this study was to compare DCE-US curve parameters with different curve patterns of DCE-MR and to assess if it can achieve the same purpose as in DCE-MR. As US examination is without irradiation and more accessible than MR, we want to explore the possible role and benefits of DCE-US in the diagnosis and treatment monitoring of pediatric extra-cranial tumors.
Materials and Methods
Subjects
This was a prospective cohort study. From 2014 to 2016, all children and young adults younger than 19 years old attending the oncology clinic with suspected extra-cranial tumors were recruited. All examinations were done in the Department of Radiology in our local institution involving patients with newly diagnosed or follow-up cases of malignant tumors. within 3 years from the onset of disease. This study was approved by the Institutional Review Board in our hospital. Informed consent was obtained from children’s parents or young adult themselves.Newly diagnosed cases with no diagnostic biopsy and follow-up cases with no post-treatment operation or PETCT were excluded. Cases with only DCE-MR or DCE-US performed were excluded, and those tumors (such as bone tumors) that could not be imaged by US were also excluded.
MR Imaging
All MR imaging was performed using a 1.5 T superconducting whole-body imager (GE Signa Horizon Echospeed, Milwaukee). Conventional MR examinations including T1W and T2W images were performed and dynamic axial scan was then conducted using threedimensional FSPGR sequences (TR: 200-300 ms, TE: 2 ms, flip angle: 70 degrees, slice thickness: 5-10 mm depending on the size of tumors, imaging matrix: 256×128-160, No. of excitation: 1) after intravenous injection of 0.1 mmol/kg Gadolinium contrast.
The size of the needle was 22 Gauge with an injection rate of about 2 ml/second via a syringe driver. For ridiculously small children, we used manual injection. The image acquisition time of each phase was 15 s-30 s depending on the number of slices. Images were taken immediately after the injection and continued up to 5 minutes thereafter.
MRI quantitative analysis
Post injection data analysis was conducted using Functool software. A region of interest (ROI) was placed in the lumen of the nearest large artery to evaluate the arterial input function. Consecutively, perfusion and tissue-blood ratio were calculated and colour mapping was generated. ROIs were drawn around its highest vascularized area and different parts of the tumor or mass according to the different distribution pattern on the colour map.
Signal intensity (SI) values were measured in operator-defined ROIs. The SI values derived from the ROIs were plotted against time as time intensity curve (TIC). TIC was plotted and the enhancement patterns were divided into type 1, 2 and 3 curves. Type 1 curve showed a gradual continual persistent rise after the arrival of the arterial bolus (progressive). Type 2 curve showed relatively rapid increase after the arrival of the arterial bolus and then became plateau or static. Under Type 3 curve, TIC demonstrated a sharp rise of contrast enhancement in the tumor after the arrival of the arterial bolus and then followed by a steeper wash-out (Figure 1).
Type 1 curve (blue) has a gradual but continual persistent rise (progressive). Type 2 curve (red) showed relatively rapid increase and then static plateau pattern. Type 3 curve (green) showed a sharp rise followed by a steeper wash-out.
For follow-up cases of tumors after neoadjuvant chemo or radiotherapy, their latest DCE-MR performed shortly before the operation or PET-CT were analyzed. Tumor inactive area was defined by the area of lack of signal changes on the color map and showing type 1 curve. The post-treatment tumor activities were compared with findings on histologic sections of the resected specimens or PET-CT findings.
Ultrasound imaging
Routine examination was performed to locate the tumor. DCE-US was performed in transverse plane, to compare with axial images on DCE-MR. SonoVue (Bracco, Milan, Italy) is based on stabilized Sulphur hexafluoride microbubbles surrounded by a phospholipid shell with a mean size of 2.5 μm. After mixing with saline, a manual process took less than one minute to constitute a suspension with SonoVue microbubbles in a concentration of 1 to 5×10⁻⁸ per ml. This suspension was injected intravenously in a straight access through a three-way stopcock as a bolus (1 ml) followed by 5 ml saline injection. Perfusion color mapping was generated after injection of contrast. ROI was drawn at the highest vascularised area of the tumor. In our institution, we performed all our quantifications with Q-Station (Philips Healthcare Ultrasound, Bothell WA). The time intensity curve (TIC) was generated by plotting the image signal intensity of the ROI as a function of time, which was up to 2.5 minutes. TIC of DCE-US was then compared with their corresponding DCE-MR curves. DCEUS curve parameters were also correlated with findings on histologic sections of the resected specimens or PET-CT findings. Correlation between US curve parameters with the tumor size measured in MR image was also performed.
Statistical analysis
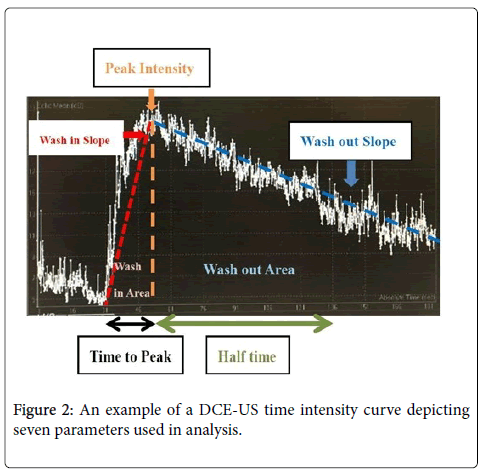
Statistical analysis was performed using SAS (version 9.4, SAS Institute Inc., Cary, NC, USA). Quantitative analyses of the TIC were performed to obtain seven functional parameters. Three parameters, namely peak intensity, wash-in area, and wash-out area were related to blood volume. Four parameters namely slope of increase, slope of decrease, time to peak intensity and half time, were related to blood flow. The slope of increase and slope of decrease were defined as the slope of ascending and descending curves. The wash-in and wash-out areas were defined as the area under curve when signal increased and decreased. Time to peak was defined as the time needed for signal to rise to the peak. Half-time was defined as time at the peak intensity to the time at its half value in the raw data (Figure 2). The data points were smoothed, and background noise was removed. Mann-Whitney U test was used to determine if there was a difference in DCE-US parameters with different types of DCE-MR curves. A 2-tailed Mann- Whitney U test with significance level set at P≤0.05 was conducted.
In follow-up cases, the latest post-treatment DCE-US parameters were compared with pre-treatment parameters and changes in the types of DCE-MR curve. Pearson correlation test was used to evaluate the correlation between US parameters and the tumor size measured in MR image. Pearson correlation coefficients R≥0.5 or ≤-0.5 indicated a strong association between two variables.
Results
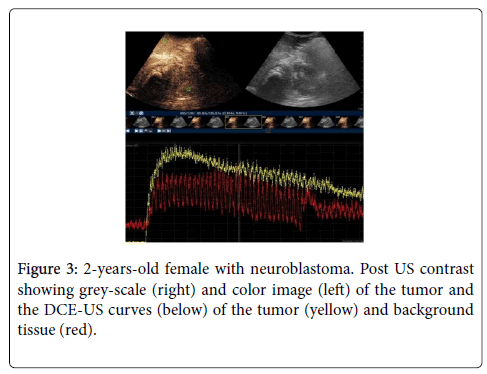
A total of 26 studies were performed, involving 17 patients (M=9, F=8) with average age 4.8 years old (range: 1-19 years old). There were 9 type 1 curves, 3 type 2 curves and 14 type 3 DCE-MR curves. No complication was observed after injection of US contrast in all patients. Average scanning time was around 15 mins for US scan and 30-45mins for MR scan (Table 1 and Figure 3).
| Type of Tumor | Sex | Age at Scan (Years) | Type of MR curve | Newly diagnosed |
|---|---|---|---|---|
| PNET | M | 5 | 3 | Yes |
| Germ Cell tumor | M | 1 | 3 | Yes |
| Yolk Sac Tumor | F | 1 | 3 | Yes |
| Germ cell tumor | M | 11 | 1 | Yes |
| Neuroblastoma | F | 9 | 3 | Yes |
| Neuroblastoma | M | 1 | 3 | Yes |
| Rhabomyosarcoma | M | 4 | 2 | Yes |
| Back lipoblastoma | M | 1 | 2 | Yes |
| Hepatoblastoma | M | 1 | 3 | Yes |
| Neuroblastoma | F | 3 | 3 | Yes |
| Neuroblastoma | F | 2 | 3 | Yes |
| Hepatoblastoma | F | 1 | 3 | Yes |
| Infantile Haemangiothelioma | M | 3 | 3 | Yes |
| Neuroblastoma | F | 2 | 3 | Yes |
| Eye retinal haematoma | F | 19 | 1 | Yes |
| Neuroblastoma | F | 1 | 3 | Yes |
| Cystic Wilms tumor | M | 5 | 1 | Yes |
| PNET | M | 6 | 2 | No |
| PNET | M | 7 | 1 | No |
| PNET | M | 8 | 1 | No |
| Yolk Sac Tumor | F | 2 | 1 | No |
| Germ cell tumor | M | 11 | 1 | No |
| Neuroblastoma | F | 9 | 3 | No |
| Neuroblastoma | F | 9 | 3 | No |
| Neuroblastoma | M | 1 | 1 | No |
| Germ cell tumor | M | 2 | 1 | No |
Table 1: Demography of all patients including newly diagnosed and follow-up cases.
Newly diagnosed cases
There were 17 newly diagnosed cases. Twelve cases showed type 3 DCE-MR curves including 1 para-spinal primitive neuroectodermal tumor (pPNET), 2 hepatoblastoma, 6 neuroblastoma, 1 pre-sacral germ cell tumor, 1 pelvic yolk sac tumor and 1 liver infantile hemangioendothelioma. There were 2 type 2 curves (retropharyngeal rhabdomyosarcoma n=1, back lipoblastoma n=1) and 3 type 1 curves (eye retinal hematoma n=1, anterior mediastinal germ cell tumor n=1, cystic Wilms tumor n=1).
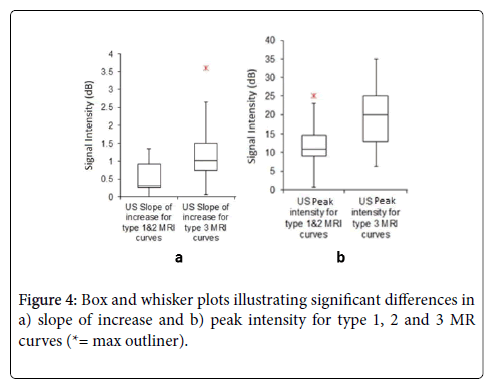
When comparing DCE-US parameters with individual DCE-MR type 1, 2 & 3 curves, no statistically significant correlation was noted in all parameters. These could be due to small sample size in cases with either type 1 or type 2 curves. Regrouping of cases with DCE-MR type 1 curve (low probability of malignancy) and type 2 curve (intermediate probability) together was done. Comparison between DCE-US parameters with type 1 & 2 MRI curves and type 3 MRI curve (high probability of malignancy) was performed. DCE-US curves for cases with type 3 DCE-MR curve showed a larger slope of increase (p=0.04) and peak intensity (p= 0.04) compared to cases with type 1 & 2 DCEMR curves (Figure 4).
Post-treatment cases
There were 6 post-treatment follow-up cases. All tumors decreased in size after treatment. DCE-MR curves changed from initial type 3 curve (highly angiogenetic active tumor) to type 1 curve (inactive) in 4 cases. There was no change in curve pattern in 2 cases (persistent type 3 curve n=1, persistent type 1 curve n=1).
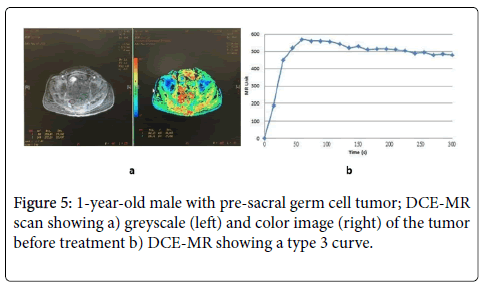
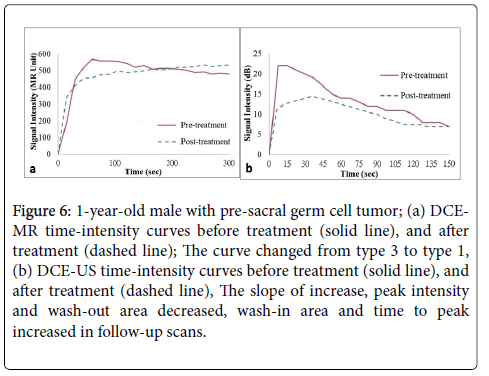
DCE-MR predicted tumor activities were correlated closely with pathology or PET-CT findings (n=5/6, 83.3%). DCE-US showed an increase in half-time (n=6/6, 100%), wash-in time (n=5/6, 83.3%) and time to peak (n=5/6, 83.3%) in post-treatment cases. These parameters were also correlated closely with pathology or PET-CT findings (Table 2, Figures 5 and 6). No definite correlation pattern was observed in other parameters.
| Tumor Type | pPNET | Germ Cell Tumor | Neuro-blastoma | Yolk Sac Tumor | Mediastinal Germ Cell Tumor | Neuro-blastoma |
|---|---|---|---|---|---|---|
| Pre-treatment MR Curve | 3 | 3 | 3 | 3 | 1 | 3 |
| Post-treatment MR curve | 1 | 1 | 1 | 1 | 1 | 3 |
| Post-treatment MR Predicted | Response+ | Response+ | Response+ | Response+ | No change+ | Partial Response+ |
| Response & Tumor Activities* | Inactive* | Inactive* | Inactive* | Inactive* | Inactive* | Active* |
| US slope of increase Pre-treatment | 0.73 | 2.93 | 1.42 | 0.83 | 0.248 | 0.35 |
| Post-treatment | 0.92 | 0.3 | 0.3 | 0.92 | 0.439 | 0.295 |
| (+26%) | (-90%) | (-79%) | (+10.8%) | (+77%) | (-15.7%) | |
| US Wash-in time* Pre-treatment |
109 | 165 | 294 | 82.2 | 296.25 | 602.25 |
| Post-treatment | 375 | 428 | 617.5 | 129.6 | 299.75 | 360 |
| (+244%)* | (+159%)* | (+110%)* | (+58%)* | (+1%)* | (-40.2%)* | |
| US Time to Peak* Pre-treatment |
15 | 7.5 | 16.5 | 12 | 37.5 | 38.5 |
| Post-treatment | 23 | 36 | 39 | 13 | 27.5 | 45 |
| (+53.3%)* | (+380%)* | (+136%)* | (+8.3%)* | (-27%)* | (+16.8%)* | |
| US Slope of decrease Pre-treatment |
-0.08 | -0.11 | -0.15 | -0.038 | -0.08 | -0.092 |
| Post-treatment | -0.092 | -0.07 | -0.09 | -0.064 | -0.114 | -0.039 |
| (+15%) | (-32%) | (-36%) | (+68%) | (+43%) | (-57.6%) | |
| US wash out time Pre-treatment |
694 | 1898 | 1689 | 426.3 | 581.25 | 1256.75 |
| Post-treatment | 1965 | 1148 | 1202.5 | 704.4 | 856.46 | 1158.75 |
| (+183%) | (-40%) | (-29%) | (+65%) | (+47%) | (-7.79%) | |
| US Half time+ Pre-treatment | 64 | 90 | 61 | 12 | 45 | 82.5 |
| Post-treatment | 105 | 93 | 106 | 57 | 60.5 | 112.5 |
| (+64%)+ | (+3.33%)+ | (+75%)+ | (+375%)+ | (+34%)+ | (+36.3%)+ | |
| US Peak Intensity Pre-treatment | 11 | 22 | 25 | 10 | 11 | 18 |
| Post-treatment | 22 | 15 | 15 | 11 | 14 | 13 |
| (+100%) | (-34%) | (-40%) | (+10%) | (+27%) | (-27.7%) | |
| Treatment Outcome | PET-CT no active tumor | PET-CT no active tumor | Resection, no active tumor | PET-CT no active tumor | PET-CT partially treated tumor | Resection, partially treated tumor |
* Correlation with treatment outcome (n=5/6) 83.3%
+ Correlation with treatment outcome (n=6/6) 100%<
Table 2: Pre- and post-treatment DCE-MRI & DCE-US parameters in 6 follow-up cases.
Figure 6: 1-year-old male with pre-sacral germ cell tumor; (a) DCEMR time-intensity curves before treatment (solid line), and after treatment (dashed line); The curve changed from type 3 to type 1, (b) DCE-US time-intensity curves before treatment (solid line), and after treatment (dashed line), The slope of increase, peak intensity and wash-out area decreased, wash-in area and time to peak increased in follow-up scans.
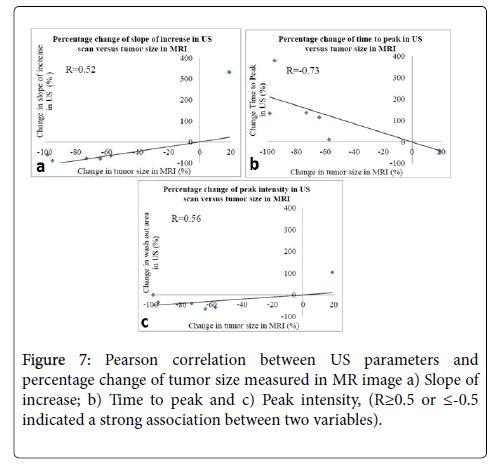
In the correlation of DCE-US parameters with tumor size, Pearson correlation test showed DCE-US slope of increase and peak intensity had strong positive correlation with tumor size (R= 0.52 and R = 0.56). DCE-US time to peak also showed strong negative correlation with tumor size (R=-0.73) (Figure 7).
Discussion
MR contrast is quite different from US contrast. Gadolinium contrast agents move to two-compartments including intravascular and extravascular spaces after administration [15]. The initial steep upslope of the curve correlates with tissue blood flow and its peak height reflects total blood flow and volume. The next portion of the curve is due to contrast leakage into the tissue interstitium and thus is a function of capillary area and permeability. Late portions of the curve reflect the total tissue extracellular space and plasma interstitial volume. For type 1 curve, persistently enhancing suggests less angiogenesis but large amount of tissue interstitial contrast accumulation, and thus is indicative of low probability of malignancy or inactive tumor. For type 2 curve (plateau type) which has moderate angiogenesis and accumulation of contrast in tissue extracellular space, and thus has an intermediate probability for malignancy or intermediate activities. For type 3 curve (washout type) suggests large amount of angiogenesis, which is indicative of malignancy or aggressive active tumor [7,8].
While US contrast is purely a blood pool agent [16], US contrast agents consist of microbubbles containing air or various gases within a shell. When a US contrast agent is administered into the vasculature, it enhances the backscatter of the ultrasound waves by resonance within sonic windows [17]. This results in a marked amplification of the signals from the blood flow and provides additional information about the microvasculature [18]. By using DCE-US, both vascularization and relative perfusion can be imaged [19].
In this study, we found that DCE-US curve for cases with type 3 DCE-MR (wash-out) pattern had a larger slope of increase and peak intensity compared to cases with type 1 & 2 DCE-MR curve. DCE-US slope of increase was related to blood flow and peak intensity is related to blood volume. They were comparable to DCE-MR initial upslope of the curve (tissue blood flow) and peak height (total blood flow and volume). In DCE-MR type 1 (progressive) and type 2 (plateau) curves, the continual rise of enhancement signal was related to continual contrast leakage into the tissue interstitium, which could not be reflected in DCE-US curves. On the contrary, because of the presence of large amount of angiogenesis in cases with DCE-MR type 3 curves, the amount of blood flow and volume correlated well with DCE-US.
Our result suggested that the behaviour of these two contrasts was similar in the intravascular angiogenetic environment. We thought that DCE-US curve and type 3 DCE-MR curve had similar reproducibility in tumor perfusion. Although their derived parameter values were not equivalent, they might have comparable utility in the assessment of a board range of pediatric extra-cranial aggressive malignant tumors. DCE-US might substitute DCE-MR and become an effective tool for noninvasive, quantitative, characterization of neovascularization of specific tumors in children.
DCE-US, DCE-MRI and fluorodeoxyglucose position emission tomography (FDG-PET) had been evaluated with respect to determining noninvasive neovascularization in tumors by Niermann et al. [19] in 17 mice with Lewis lung carcinoma implants before and after treatment. DCE-US showed that intra-tumoral perfusion, blood volume, and blood velocity were highest in the untreated control group and significantly lower in each of the treatment groups. DCE-US revealed longitudinal decreases in tumor perfusion, blood volume, and microvascular velocity over the 5-day course of chemo-radiotherapy. Conversely, these values rose significantly for the untreated control tumors. DCE-MRI showed a smaller and statistically insignificant average decrease in relative tumor perfusion for treated tumors. Dynamic FDG‐PET revealed delayed uptake of FDG in the tumors that underwent chemo-radiotherapy. Thus, it can be concluded that DCE-US can differentiate between benign and malignant tumors. Moreover, DCE-US was the most effective tool for noninvasive, quantitative, longitudinal characterization of neovascularization of specific tumors even when compared with DCE-MRI and FDG‐PET.
In the follow-up cases, despite small number, our findings were encouraging. We found DCE-US showing an increase in half-time (100%), wash-in time (83.3%) and time to peak (83.3%) in posttreatment cases. These parameters were all correlated closely with pathology or PET-CT findings. Its ability to predict tumor response to treatment was as good as or slightly better than DCE-MR (83.3%). In 4 cases, DCE-MR curves changed from initial type 3 curve to type 1 curve after treatment, suggesting inactive tumor and effective treatment. In a case of neuroblastoma, DCE-MR showed persistent type 3 curves despite treatment. This suggested that the tumor was still active despite decreasing in size after treatment, which demonstrated that measurement of tumor size alone did not appear adequate to assess the therapeutic response. In a case of mediastinal germ cell tumor, the initial DCE-MR curve was type 1. Despite treatment, its curve pattern remained unchanged. This showed that DCE-MR was less sensitive than DCE-US in the serial monitoring of treatment response in cases with initial type 1 curve pattern. Our study also showed that the slope of increase and peak intensity for DCE-US curve had a strong positive correlation with tumor size; and time to peak had strong negative correlation with tumor size. These additional parameters may also be useful in the serial monitoring of tumor response.
One limitation of this study was the heterogeneity of our tumor cases. Our sample size and number of serial follow-up cases were small. However, irrespective of small sample size, our analysis still showed statistical significance. It meant the correlation might be strong. We did not include the morphologic features of the lesions in this analysis; instead, our aim was to compare the TICs. Another study with larger scale and more homogenous group of tumors may be more useful to further confirm our findings.
Conclusion
We demonstrated that the use of DCE-US in the assessment and monitoring of pediatric extra-cranial tumor was safe and feasible. DCE-US curve parameters such as slope of increase and peak intensity showed statistically significant correlation with type 3 DCE-MR curve. This finding suggested that they might have similar reproducibility in tumor perfusion and comparable utility in the assessment of a board range of pediatric extra-cranial aggressive malignant tumors.
We thought that serial DCE-US scans might have a role in the monitoring of treatment response of tumor by evaluating tumor vascular changes. Our findings showed that pediatric application of DCE-US was comparable to those studies in adults. DCE-US curve parameters such as half-time, wash-in time, time to peak, slope of increase and peak intensity are useful parameters in the assessment of post-treatment response.
DEC-US examination only takes about 15 minutes while MR and DCE-MR examinations take more than 30 minutes. US machine is easily available and more accessible than MR. We had encountered no complications from the injection of US contrast. US contrast was safe and easy to use in children. It will be more acceptable for the patients and patients’ parents to have serial follow-ups by DEC-US than MR or DCE-MR. Based on our preliminary findings, with further studies to confirm, we postulate that DCE-US may have the possibility to substitute MR or DCE-MR in certain instances of the serial monitoring of treatment response of tumor in the future. With shorter scanning time and more easily accessible than MR, as well as lack of irradiation compared to PET-CT or CT, DCE-US may have potentially significant benefits for pediatric oncology patients. However, the true effectiveness of DCE-US has yet to be determined by studies with larger scale.
References
- Kuhl CK, Mielcareck P, Klaschik S, Leutner C, Wardelmann E et al. (1999) Dynamic breast MR imaging: are signal intensity time course data useful for differential diagnosis of enhancing lesions? Radiology 211: 101-110.
- Raymond A, Chawla SP, Carrasco C, Fanning CV, Grice B, et al. (1987) Osteosarcoma chemotherapy effect: a prognostic factor. Semin Diagn Pathol 4: 212-236.
- Glasser DB, Lane J, Huvos AG, Marcove RC, Rosen G (1982) Survival, prognosis, and therapeutic response in osteogenic sarcoma. Cancer 69: 698-708.
- Verma S, Turkbey B, Muradyan N, Rajesh A, Cornud F, et al. (2012) Overview of Dynamic Contrast-Enhanced MRI in Prostate Cancer Diagnosis and Management. AJR 198: 1277-1288.
- Padhani AR (1999) Dynamic contrast-enhanced MRI studies in human tumors. Br J Radio 72: 427-431.
- Weidner N (1996) Intratumoural vascularity as a prognostic factor in cancers of the urogenital tract. Eur J Cancer 32A: 2506-2512.
- Bhujwalla ZM, Artemov D, Glockner J (1999) Tumor angiogenesis, vascularization, and contrast-enhanced magnetic resonance imaging. Top Magn Reson Imaging 10: 92-103.
- Lam WWM, Cheuk D, Chan GCF (2020) Pediatric Application of Dynamic contrast-enhanced MR Imaging (DCE-MR) in the Management of Extra-cranial Tumor: Experience in Routine Clinical Practice. Open Journal of Radiology 10: 57-68.
- Lassau N, Chebil M, Chami L, Bidault S (2010) Dynamic contrast-enhanced ultrasonography (DCE-US): a new tool for the early evaluation of antiangiogenic treatment. Target Oncol Mar 5: 53-58.
- Egger C, Goertz RS, Strobel D, Lell M, Neurath MF, et al. (2012) Dynamic contrast-enhanced ultrasound (DCE-US) for easy and rapid evaluation of hepatocellular carcinoma compared to dynamic contrast-enhanced computed tomography (DCE-CT)--a pilot study. Ultraschall Med Dec 33: 587-592.
- Bjarnason GA, Williams R, Hudson JM, Bailey C, Lee CR, et al. (2011) Microbubble ultrasound (DCE-US) compared to DCE-MRI and DCE-CT for the assessment of vascular response to sunitinib in renal cell carcinoma (RCC). Journal of Clinical Oncology 29 no. 15 suppl: 4627-4627.
- Hoyt K, Sorace A, Saini R (2012) Quantitative mapping of tumor vascularity using volumetric contrast-enhanced ultrasound. Invest Radiol 47: 167-174.
- Merz M, Komljenovic D, Semmler W, Bauerle T (2012) Quantitative contrast-enhanced ultrasound for imaging antiangiogenic treatment response in experimental osteolytic breast cancer bone metastases. Invest Radiol 47: 422-429.
- Gordon Y, Partovi S, Müller-Eschner M, Amarteifio E, Bauerle T, et al. (2014) Dynamic contrast-enhanced magnetic resonance imaging: fundamentals and application to the evaluation of the peripheral perfusion. Cardiovasc Diagn Ther Apr 4: 147-164.
- Chung YE, Kim KW (2015) Contrast-enhanced ultrasonography: advance and status in abdominal imaging. Ultrasonography Jan 34: 3-18.
- Sontum PC (2008) Physicochemical characteristics of Sonazoid, a new contrast agent for ultrasound imaging. Ultrasound Med Biol 34: 824-833.
- Greis C (2004) Technology overview: SonoVue (Bracco, Milan) Eur Radiol 214 Suppl 8:11-15.
- Fröhlich E, Muller R, Cui XW, Schreiber-Dietrich D, Dietrich CF (2015) Dynamic Contrast-Enhanced Ultrasound for Quantification of Tissue Perfusion. Journal of US in Med 34: 179-196.
- Niermann KJ, Fleischer AC, Huamani J (2007) Measuring tumor perfusion in control and treated murine tumors: correlation of microbubble contrast-enhanced sonography to dynamic contrast-enhanced magnetic resonance imaging and fluorodeoxyglucose positron emission tomography. J Ultrasound Med 26: 749-756.
Citation: Lam WWM, Ip JJK, Mui CYC, Cheuk D, Chan GCF (2020) Comparison between Dynamic Contrast-enhanced Magnetic Resonance (DCE-MR) and Dynamic Contrast-Enhanced Ultrasound (DCE-US) in the Imaging of Pediatric Extra-Cranial Tumor. OMICS J Radiol 9: 1000321. DOI: 10.4172/2167-7964.1000321
Copyright: © 2020 Lam WWW, et al. This is an open-access article distributed under the terms of the Creative Commons Attribution License, which permits unrestricted use, distribution, and reproduction in any medium, provided the original author and source are credited.
Select your language of interest to view the total content in your interested language
Share This Article
Open Access Journals
Article Tools
Article Usage
- Total views: 3711
- [From(publication date): 0-2020 - Dec 14, 2025]
- Breakdown by view type
- HTML page views: 2858
- PDF downloads: 853
