Continuous Monitoring of Breath Acetone, Blood Glucose and Blood Ketone in 20 Type 1 Diabetic Outpatients Over 30 Days
Received: 24-Oct-2017 / Accepted Date: 29-Oct-2017 / Published Date: 31-Oct-2017 DOI: 10.4172/2155-9872.1000386
Abstract
Although breath acetone (BA) has been identified as a breath biomarker for some abnormal metabolic status, such as diabetic ketoacidosis, diabetes under insulin treatments, on a ketogenic diet, heart congestion failure, and post intense exercises, many intra-individual biological parameters also influence the breath acetone concentration. Therefore, it would be insightful to study longitudinal variations of breath acetone concentration in given individuals that have no baseline effect resulting from individual physiological heterogeneity. We carried out a daily-based continuous monitoring of BA, blood glucose (BG), and blood ketone (BK) in 20 type 1 diabetic (T1D) outpatients and 5 healthy volunteers over a period of 30 days. 600 breath samples from the T1D outpatients and the healthy subjects were collected and tested. BA was measured using a cavity ringdown BA analyzer. Simultaneous BG and BK levels were also measured using a standard BG/ketone meter. Our findings include: (1) The T1D subjects have elevated mean BA concentrations as compared to the controls. (2) There exists a positive correlation (R=0.57, P<0.05) between the individual mean BA concentration and the individual mean BK in the 20 T1D outpatients. (3) Some adverse or abnormal physiological conditions such as diabetic ketoacidosis, low body mass index or a special daily activity (e.g., exercises) can be identified via an abnormal BA concentration. This study suggests that continuous monitoring BA is useful in monitoring some abnormal physiological status such as T1D outpatients with very high BG or ketone bodies.
Keywords: Breath acetone; Blood glucose; Blood ketone; Type 1 diabetic patients; Continuous measurement; Cavity-ringdown breath analyzer; Diabetic management
Introduction
Breath analysis has received continuously increasing attention because of its potential as a non-invasive method for disease diagnosis and metabolic status monitoring. Among thousands of breath volatile organic compounds (VOCs), acetone is the second to the highest abundant species in normal human breath gases, which has been extensively studied as a breath biomarker of diabetes or as a high abundant breath VOC in various physiological cases since 1950s [1,2]. To date there are more than 50 independent studies of breath acetone (BA) using various techniques and methods in a laboratory or in a clinic [3-5]; more than 3211 human subjects including 626 diabetic patients have participated in these studies. However, one issue in breath acetone measurements, which is often neglected, is that many intra-individual biological parameters (age, gender, body mass index (BMI), etc.) influence the BA concentration [6-9]. Therefore, it would be insightful to study longitudinal variations of BA in given individuals that have no baseline effect resulting from individual physiological heterogeneity. Diskin et al. monitored five metabolites including acetone in the breath of five healthy volunteers over a 30-day period (excluding weekend days) [10]. The results show that the distribution patterns for these various metabolites for a given individual are apparently like a crude fingerprint, which could act as a baseline for the future to reveal the onset of adverse clinical conditions once it established. Subsequently, Turner et al. determined concentrations of three common breath metabolites: ammonia, acetone, and propanol in the exhaled breath of 30 healthy volunteers over a 6-month period (collection of samples at weekly intervals) [11]. The results show that there is a wide range of concentrations of the three breath metabolites and that abnormally high concentration of these metabolites can be indicative of a particular state of a disease. The two results mentioned above shows the promising of breath acetone used for the management of adverse clinical conditions for a given individual. For given individuals, diurnal variations including fasting, exercise, and diet were also reported to correlate to BA concentration [12-20]. Therefore, a systematic study of the longitudinal variation of BA for given individuals under a control condition is a rationally sound methodology to illustrate a more accurate picture of breath acetone and its possible relations to other clinical parameters such as blood glucose (BG) and blood ketone (BK).
High sensitivity laser spectroscopy has attractive applications in trace gas quantification including breath gas measurement. Laser spectroscopy used for breath analysis has the advantages of high sensitivity, high selectivity, fast response, low instrumental cost, and relatively small instrument geometry as compared with the gas chromatography mass spectrometry (GC-MS) method which is an established method primarily used for lab-based trace gas analysis. Recently, several groups have developed novel optical approaches attempting to focus on a compact and practical solution for single analyte detection [20-25]. Notably, a recent paper reports on a portable and compact device for BA monitoring based upon laser cavity enhanced absorption spectroscopy [20]. Data are presented on elevated breath acetone from two individuals following an overnight fast and exercise, and from a third individual during several days of routine behavior [20]. In our lab, we have developed a cavity ringdown spectroscopy (CRDS)-based breath acetone analyzer, which has been used for BA analysis under various situations (human subjects, animals, in a lab or a clinic) [26-28]. Recently, a fully-integrated, standalone, portable acetone breath analyzer, LaserBreath-001, was built in our lab for nearreal time, on-line BA measurement with high data throughput, which was validated by using the GC-MS method [24,25].
In the present study, we take advantage of the high data throughput capability of the BA analyzer and use it to monitor BA on a day-today base in 20 Type 1 diabetic (T1D) outpatients and 5 non-diabetic healthy subjects under fasting over a period of 30 days. Concurrent BG and BK levels in the T1D patients and non-diabetic subjects were also measured using a standard BG/BK meter. Different from the Diskin and Turner’s studies, which established the distribution patterns and the concentration range of breath acetone for given healthy individuals over a longer time period, the present work for the first time systematically measures the simultaneous BA, BG, and BK in clearly defined T1D diabetes over 30 days. We report our findings in individual mean BA (IMBA) and relationships among IMBA, individual mean BG (IMBG), and individual mean BK (IMBK).
Experimental
Ringdown breath acetone analyzer
LaserBreath-001 is an automated, portable BA analyzer based on the CRDS technique, as shown in Figure 1. The instrument has dimensions of 638 mm × 237 mm × 143 mm, with a weight of 19.4 kg. It is able to complete a single acetone measurement within 2 min, with a detection limit of 0.05 ppm (parts per million by volume). A standard breath gas collection bag is plugged into the gas inlet of the analyzer for sample introduction and only about 100 mL breath sample is needed each time. LaserBreath-001 is equipped with a liquid crystal display (LCD) touch screen as an input/output interface. The instrument’s prototype (design, parts, and configuration), its validation using a certified GCMS facility, and the CRDS measuring principle have been described in detail in previous publications [24,29]. The instrument operation procedures include: (1) one minutes laser warm up, (2) atmospheric background measurement, (3) breath gas sample introduction, (4) BA measurement, and (5) nitrogen purge of the cavity. All are done by using the touch screen. Test results and the gas cell temperature and pressure are displayed on the same screen. For future software update and instrument troubleshooting, the LaserBreath-001’s rear panel has one VGA and two USB ports.

Figure 1: LaserBreath-001, the ringdown breath acetone analyzer.
Breath test volunteers and sampling
20 T1D outpatients and 5 healthy volunteers were recruited to participate in this study. All subjects signed an informed consent form prior to the study. A research protocol was approved by the Institutional Review Board (IRB approval number: IRB 2013-053- 01) of human subject research in Tianjin. Each subject was asked to provide information on gender, age, BMI, and time since diagnosis of diabetes. After an overnight fasting of at least 8 hours (h), BG and BK levels of a subject were measured using a standard diabetes monitoring meter (Abbott Diabetes Care Ltd., UK, FreeStyle Optium), which can measure both BG and blood β-hydroxybutyrate (BHB) that is the most important one of the three blood ketone bodies circulating in the bloodstream. The BG and the blood BHB have a mean range of 1.1-27.8 mmol/L with a coefficient of variation (CV, a standard deviation over a mean value) of 2.7-4.0% and 0.0-8.0 mmol/L with CV of 3.1-3.8%, respectively. Within 5 min, the subject took a deep breath up to the total lung capacity and blew a single exhalation into a breath bag (Hao Chen Tian Cheng, China, 1L) through a disposable mouthpiece. The breath bag was stored in a temperature controlled container and sent to the laboratory for acetone concentration measurement using the LaserBreath-001 within 6 hours.
Measuring method for breath acetone
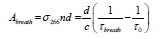
The acetone concentration in the exhaled breath sample was measured using the ringdown BA analyzer. A background subtraction method was applied to reduce the interference caused by the other components in the breath gas as described in our previous work [27]. Briefly, the mean effective absorbance of the atmosphere is used as a baseline to be subtracted from the breath absorbance; therefore, an upper limit of breath acetone concentration was obtained. The effective absorbance of the atmosphere is determined by:
 (1)
(1)
where σ266 is the absorption cross-section of the acetone transition line at 266 nm, n is the sample concentration, d is the cavity length, c is the speed of light, τ0 and τatm are the ringdown times when the gas cell is under vacuum and filled with ambient atmosphere to 1 atm, respectively. The absorbance of breath sample is obtained by:
 (2)
(2)
where τbreath is the ringdown time when the gas cell is filled with breath sample. The acetone concentration (upper limit) n in the breath gas is obtained by:
 (3)
(3)
where ΔA is the absorbance difference. The absorption crosssection of acetone at 266 nm, σ266, is 4.5 × 10⁻²⁰ cm2/molecule at room temperature and atmospheric pressure [30].
Results And Discussion
IMBA, IMBG and IMBK over 30 days
In this study, 20 T1D outpatients (numbered as T1D 1-20 below) and 5 healthy subjects (numbered as Healthy 1-5 below) participated in the tests. Table 1 lists the subject number, gender, year on diabetes, BMI (kg/m2), IMBA (ppm), IMBG (mg/dL), and IMBK (mmol/L). Here the individual mean is defined as a mean value over the 30 days period for each individual. In total, there are 4 healthy female subjects (age of 28- 39), 1 healthy male subject (age of 25), 15 T1D female subjects (ages of 7-65), and 5 T1D male subjects (ages of 17-46) included in this study.
| Subject | Gender | Age (years) | BMI (kg/m2) | Acetone (ppm) | Blood glucose (mg/dL) | Blood ketone (mmol/L) |
|---|---|---|---|---|---|---|
| Healthy 1 | M | 39 | 26.67 | 2.2 ± 1.2 (0.5-6.2) | 93.7 ± 8.5 (66.6-104.4) | 0.2 ± 0.1 (0.1-0.4) |
| Healthy 2 | M | 29 | 24.21 | 2.0 ± 0.7 (1.0-3.5) | 100.7 ± 7.0 (82.8-120.6) | 0.2 ± 0.1 (0.0-0.2) |
| Healthy 3 | M | 28 | 17.75 | 3.2 ± 1.2 (1.2-6.0) | 94.8 ± 7.5 (72.0-106.2) | 0.2 ± 0.1 (0.0-0.5) |
| Healthy 4 | F | 25 | 22.48 | 1.4 ± 0.4 (0.8-2.3) | 115.4 ± 5.7 (100.8-124.2) | 0.1 ± 0.1 (0.0-0.2) |
| Healthy 5 | M | 28 | 25.66 | 1.1 ± 0.5 (0.2-2.6) | 92.3 ± 8.4 (66.6-108.0) | 0.2 ± 0.0 (0.1-0.3) |
| T1D 1 | F | 7 | 14.08 | 2.0 ± 0.7 (0.6-3.8) | 165.9 ± 65.3 (59.4-309.6) | 0.3 ± 0.2 (0.1-0.7) |
| T1D 2 | F | 15 | 19.63 | 1.8 ± 0.6 (0.8-3.2) | 143.5 ± 44.2 (75.6-244.8) | 0.2 ± 0.1 (0.1-0.3) |
| T1D 3 | M | 28 | 25.93 | 3.8 ± 1.8 (1.3-10.4) | 329.7 ± 72.9 (136.8-430.2) | 0.5 ± 0.3 (0.1-1.2) |
| T1D 4 | F | 24 | 18.73 | 2.0 ± 0.6 (0.9-3.1) | 147.7 ± 67.0 (66.6-300.6) | 0.2 ± 0.1 (0.1-0.4) |
| T1D 5 | F | 32 | 19.95 | 2.9 ± 1.4 (1.4-7.1) | 233.2 ± 112.3 (61.3-453.6) | 0.3 ± 0.3 (0.1-1.2) |
| T1D 6 | M | 17 | 20.43 | 2.0 ± 0.6 (0.8-3.0) | 127.7 ± 28.4 (73.8-189.0) | 0.2 ± 0.1 (0.1-0.4) |
| T1D 7 | F | 24 | 20.07 | 7.3 ± 8.7 (1.8-49.5) | 191.7 ± 58.6 (77.4-336.6) | 0.3 ± 0.7 (0.0-4.3) |
| T1D 8 | F | 28 | 26.57 | 2.6 ± 2.0 (0.8-12.1) | 145.8 ± 72.9 (59.4-370.8) | 0.2 ± 0.3 (0.1-1.6) |
| T1D 9 | M | 15 | 19.35 | 1.9 ± 0.6 (0.5-2.8) | 153.8 ± 59.8 (75.6-311.4) | 0.2 ± 0.1 (0.1-0.3) |
| T1D 10 | F | 36 | 20.55 | 3.8 ± 1.1 (1.3-6.2) | 129.4 ± 39.5 (55.8-192.6) | 0.6 ± 0.2 (0.2-1.0) |
| T1D 11 | F | 29 | 19.81 | 3.7 ± 2.8 (1.7-17.4) | 166.3 ± 61.3 (84.6-322.2) | 0.2 ± 0.4 (0.0-2.1) |
| T1D 12 | F | 65 | 26.57 | 1.9 ± 0.6 (0.7-3.5) | 177.8 ± 60.0 (72.0-291.6) | 0.1 ± 0.0 (0.1-0.2) |
| T1D 13 | M | 39 | 22.72 | 5.4 ± 1.6 (2.5-8.5) | 101.8 ± 32.1 (64.8-180.0) | 0.3 ± 0.1 (0.2-0.4) |
| T1D 14 | M | 46 | 21.45 | 4.4 ± 1.0 (2.5-6.2) | 117.9 ± 59.4 (52.2-300.6) | 0.3 ± 0.1 (0.2-0.4) |
| T1D 15 | F | 31 | 19.1 | 3.0 ± 1.0 (1.4-6.6) | 119.9 ± 47.3 (52.2-219.6) | 0.2 ± 0.1 (0.1-0.3) |
| T1D 16 | F | 35 | 24.77 | 2.6 ± 0.6 (1.6-4.1) | 159.7 ± 42.8 (91.8-277.2) | 0.2 ± 0.1 (0.2-0.4) |
| T1D 17 | F | 55 | 19.05 | 3.2 ± 1.0 (1.5-5.5) | 148.3 ± 60.9 (46.8-329.4) | 0.2 ± 0.1 (0.1-0.3) |
| T1D 18 | F | 10 | 17.31 | 3.1 ± 1.6 (1.2-10.3) | 128.6 ± 60.0 (52.2-295.2) | 0.2 ± 0.2 (0.1-1.0) |
| T1D 19 | F | 38 | 18.82 | 2.1 ± 0.7 (0.7-3.2) | 124.6 ± 41.9 (59.4-221.4) | 0.1 ± 0.0 (0.0-0.2) |
| T1D 20 | F | 43 | 21.23 | 2.3 ± 0.6 (1.2-3.3) | 96.4 ± 28.3 (57.6-165.6) | 0.1 ± 0.0 (0.1-0.2) |
Table 1: Thirty five evaluated legume lectin sequences and their species of origin.
As can be seen in the table, the overall range of BA concentration in the 5 healthy subjects was 0.2-6.2 ppm. A global mean of the healthy subjects was determined to be 1.9 ppm with a standard deviation (SD) of 1.1 ppm. Here the global mean is defined as the mean value averaged over all data collected from all 5 healthy subjects over the 30- day period. Meanwhile, the overall range of BA concentration in the 20 T1D subjects was 0.5-49.5 ppm, with a global mean of 3.1 ppm and a SD of 2.7 ppm. Likewise, BG ranges 66.6-124.2 mg/dL for the healthy subjects and 46.8-453.6 mg/dL for the T1D subjects with a global mean of 99.4 mg/dL and 155.7 mg/dL respectively. BK ranges 0-0.5 mmol/L and 0-4.3 mmol/L in the healthy and T1D subjects respectively, with corresponding global means of 0.16 and 0.25 (mmol/L). The results indicate that the T1D subjects have a higher mean BA concentration than the healthy controls, which is consistent with the published data in the literatures [3,26,30-32].
Turner et al. monitored BA in 8 T1D patients during the induced hypoglycemia in steps, the results supported that the mean BA concentration in T1D was higher than that in the healthy subjects [31]. An elevated mean BA in T1D patients was also observed in Wang et al. work, in which BA in 34 T1D patients and 15 healthy individuals was measured using a CRDS-based breath acetone analyzer [26]. In a recent work by Blaikie et al. BA in 113 young T1D patients (age of 7-18) in a clinic at the Oxford Children’s Hospital was measured using a softionization mass spectrometer [32]. Their results show that the average value (0.51 ppm) is higher than that found for a healthy cohort of the same age group reported by Spanel et al. [9]. We conducted 1-tailed nonparametric Mann-Whitney U tests to evaluate the significant difference in IMBA distributions between the T1D outpatients and the healthy controls. The test result gave P
Daily variations in breath acetone, blood glucose, and blood ketone over 30 days
Figures 2 and 3 show the day-to-day variations in BA, BG, and BK in the 5 healthy subjects and selected 6 T1D outpatients respectively. For the healthy subjects, the mean intra-individual coefficient of variation (CV) (the variation among breath acetone concentrations of an individual volunteer) is 40.4%, which is smaller than the mean inter-individual CV (the variation among the individual means), 56.9% [33]. Similarly, for the 20 T1D outpatients, the mean intra-individual CV is also smaller than the mean inter-individual CV (41.9% versus. 87.5%). Among the 5 healthy subjects (Figure 2), the subject Healthy 1 had the highest mean intra-individual CV of 53.6%. This high CV was attributed to the unscheduled exercises of the subject, which were identified in the recorded data form. Schwoebel et al. conducted a realtime analysis of four breath VOCs including acetone in seven healthy subjects in-exercise using PTR-MS and the results show that breath acetone from the subjects in-exercise had relatively high scattering signals and had a higher concentration [19]. Our observations in the subject Healthy 1 show the similar trends. The subject Healthy 3 had the highest mean breath acetone concentration (3.2 ppm) among the five healthy subjects (Table 1). Interestingly, this subject was under weight, whose BMI was only 17.75 kg/m2. Indeed, according to the work by Kinoyama et al. in which concentrations of acetone and isoprene in the exhaled breath in 451 students were measured using a Biogas Acetone Analyzer (BAS-2000) to evaluate their lifestyles in the annual medical checkup at the university [34], the measured breath acetone concentrations were correlated inversely with BMI. The students with BMI under 25 kg/m2 had significantly higher breath acetone concentrations than the obese students with BMI over 25 kg/ m2. Also, it should be noted that the BK levels in the healthy subjects were relatively low and stable, the BK variance was hardly observable when its concentration was below 0.2 mmol/L, like the healthy subject 5 in Figure 2. However, using the LaserBreath-001, BA level variance was observed due to its high sensitivity.

Figure 2: Day-to-day variations of simultaneous breath acetone, blood glucose and blood ketone levels measured in the five healthy subjects over 30 days.
Among the 20 T1D outpatients, the measured BA, BG and BK of T1D 1, 2, 3, 4, 5, 6, 10, and 18 had a consistent trend over the period of 30 days. However, no similar trend for simultaneous BA, BG, and BK was found in the other subjects. The day-to-day variations in BA, BG, and BK in the selected 6 T1D outpatients were shown in Figure 3. The measured BA, BG, and BK in the subject T1D 1 were highly correlated as shown in Figure 3. This subject was a 7 years old girl with a history of 6 years on diabetes and she had no complications recorded in the data form. As seen in Figure 3 and Table 1, the subject T1D 7 has the highest intra-individual CV (119.8%), whose mean breath acetone concentration (7.3 ppm) is also the highest among the 20 T1D outpatients. On the day 13, the subject had abnormal values of BA, BG, and BK (49.46 ppm, 262.8 mg/dL, and 4.3 mmol/L, respectively), which is a life-threatening condition for human being. The record showed that the subject T1D 7 felt so sick that she was sent to a hospital on that day. On the day 14, the subject T1D 7 had a normal BG (106.2 mg/ dL), but her breath acetone concentration (20.42 ppm) was still very high, and her physical condition was still quite unstable. Similarly, the subject T1D 11 had abnormal values of BA, BG, and BK (17.4 ppm, 322.2 mg/dL, and 2.1 mmol/L, respectively) on the day 9, which are far higher than most diabetic patients could tolerate. Diabetic ketoacidosis (DKA) was recorded in the data form of the subjects T1D 7 and 11. Except for being DKA, for those (T1D 5 and T1D 8) who had not been in DKA, when their values of both BG and BK were extremely abnormal such as the numbers in subject T1D 5 on the day 8 (453.6 mg/dL and 1.2 mmol/L) and day 15 (439.2 mg/dL and 1.2 mmol/dL) and in subject T1D 8 on the day 12 (370.8 mg/dL and 1.6 mmol/L), correspondingly, their BA were found also very high (7.1, 7.0, and 12.1 ppm, respectively), they might be at risk of developing DKA and needed to contact healthcare professional immediately. The IMBG in the subject T1D 3 was 329.7 ± 72.9 (136.8-430.2) mg/dL, which was the highest IMBG among the 20 T1D subjects and far higher than the range of normal value though the record showed that the subject T1D 3 was treated by novolin R with doses of 18, 16, and 16 units in the morning, noon, and afternoon respectively, and by novolin N with a dose of 14 units in the night. Correspondingly the IMBA in the subject T1D 3 was 3.8 ± 1.8 ppm, which was higher than the globe means of BA in 20 T1D subjects, 3.1 ± 2.7 ppm. For these various cases, although further in-depth studies are needed, breath acetone measurement has shown some promising clinical application in managements of T1D outpatients.

Figure 3: Day-to-day variations of simultaneous breath acetone, blood glucose and blood ketone levels measured in the selected 6 T1D outpatients over 30 days.
Correlation of breath acetone to blood glucose
Studies of the correlation of BA to BG have reported diverse results to date: positive, negative or no correlation has been reported, depending on each individual case and experimental conditions. Wang et al. conducted breath tests in 34 T1D patients under non-fasting condition using a prototype ringdown breath acetone analyzer, their observations showed that a linear correlation between the mean group acetone and the mean group BG level existed when all the T1D subjects tested were grouped by different BG levels, 40-100, 101-150, and 151-200, and 201-419 mg/dL [26]. Turner et al. reported a positive correlation between BA and BG in 8 T1D patients during the induced hypoglycaemia in steps [31]. However, in some cases a reverse correlation was also observed. Rydosz found a negative correlation between BG and exhaled BA in 5 T1D patients measured using a commercial acetone gas sensor (TGS 822, 823 Figaro, Arlington Heights, IL, USA Inc) with micro preconcentrator in low temperature cofired ceramics [35]. Sun et al. measured BA in 20 lab-developed T1D rats, which had minimal to no baseline effect resulting from individual physiological heterogeneity, using a cavity ringdown spectroscopy based breath analyzer, a significant negative relationship between BA and BG was found when the BG level is far higher than the one that most diabetic patients would be able to tolerate [28]. Furthermore, the relationship between BA and BG shifts from negative to weakly positive when T1D rats were treated by insulin. In other published works, no correlation between BA and BG in T1D patients was found. For instance, more recently, Blaikie et al. measured BA from 113 young T1D patients aged 7-18 years in a clinic at the Oxford Children’s Hospital using a soft-ionization mass spectrometer, no correlation between BA and BG was found [32]. In the present study, the IMBA concentrations measured in the 20 T1D outpatients over 30 days show no obvious correlation to the IMBG levels, as shown in Figure 4 (R=0.17, P=0.43). Figure 5 shows the BA concentration versus the BG level in the 20 T1D outpatients when their BG levels were grouped into four groups: 40-100 mg/dL (low BG, group 1), 101-150 mg/dL (borderline, group 2), 151-200 mg/dL (high BG, group 3), and 201-419 mg/dL (very high BG, group 4). No strong correlation was observed, as reported in previous works [9,32].

Figure 4: The individual mean breath acetone (IMBA) concentration versus the individual mean blood glucose (IMBG) level measured in the 20 T1D outpatients.

Figure 5: The group mean breath acetone concentrations in the 20 T1D outpatients that were grouped based on the four simultaneous BG levels.
Correlation of breath acetone to blood ketone
Data in Figure 6 shows a plot of the IMBA concentration versus the IMBK in the 20 T1D outpatients. The linear fitting to a weak positive correlation gives R=0.57 and P1.0 mmol/L (group 6), as shown in Figure 7a [36]. Also, there is a statistical difference among the six different BK groups (P<0.05). The group 6 has the highest group mean breath acetone concentration. The outstanding BA values came out when the BK was above 1.0 mmol/L. A normal blood ketone is expected to be lower than 0.6 mmol/L. When BK is between 0.6 and 1.5 mmol/L and blood glucose is 300 mg/dL or higher, a problem requiring medical assistance might occur. When the BK value remains, high or becomes higher than 1.5 mmol/L, the subject may be at risk of developing DKA. When the BK was below 1.0 mmol/L, the fitting results for the measured group mean BA concentrations versus the group mean BK levels are y=2.04+3.51x (R=0.998, P<0.05, Figure 7b). The results indicate that the group mean BA concentration increases with increase in the group mean BK level. It is apparent that: (1) the BA can be a good indicator of the BK and (2) the BA elevates significantly when T1D has ketone bodies. This result, which was obtained from a longitudinal study of 20 T1D patients over 30 days, further confirms the recent reports on a significant positive relationship between the two parameters in the cross-sectional studies of young T1D patients and lab-developed T1D rats respectively [28,32]. Blaikie et al. studied BA in 113 young T1D patients using a soft-ionization mass spectrometer, they reported a significant positive correlation of BA with BK measured with capillary at low levels of 0-0.4 mmol/L [32]. Sun et al. found a significantly positive relationship between BA and BK when 20 labdeveloped T1D rats were used as subjects to reduce the baseline effect resulting from individual physiological heterogeneity [28]. Besides T1D human and rats as subjects, the similar positive correlation between the two parameters were also found in human subjects with intractable seizures treated by a ketogenic diet in the works done by Cunnane et al. [14,37].

Figure 6: A weak correlation between the IMBA and the IMBK measured in the 20 T1D outpatients.

Figure 7a: A box plot of the group mean breath acetone concentrations grouped based on different BK levels.

Figure 7b: A strong correlation between the group mean BA and the group mean BK (0 mmol/L (group 1), 0.1 mmol/L (group 2), 0.2 mmol/L (group 3), 0.3-0.6 mmol/L (group 4), and 0.7-1.0 mmol/L (group 5)). The error bar shows one standard deviation.
Conclusions
The simultaneous BA, BG, and BK in 20 T1D outpatients and 5 healthy subjects under the fasting condition were day-to-day continuously measured for a period of 30 days. 600 breath samples from the T1D outpatients and healthy subjects were collected and tested. For the 20 T1D outpatients, the range of breath acetone concentrations was 0.5-49.5 ppm with a global mean of 3.1 ppm, whereas breath acetone in the healthy subjects ranged from 0.2 to 6.2 ppm, with a global mean of 1.9 ppm. Using the statistical analyses and the method of grouping, we found:
(1) The global mean BA in the 20 T1D outpatients over the 30 days period was higher than the global mean BA from the controls.
(2) No correlation was observed between the IMBA concentration and the IMBG level; however, the T1D subjects had an elevated group mean BA concentration when the subjects fell into the group with very high BG (201-419 mg/dL).
(3) There was a weak positive correlation (R=0.57, P<0.05) between the IMBA concentration and the IMBK level in the 20 T1D outpatients over the 30 days period.
(4) There was a strong linear relationship between the group mean BA and the group mean BK when the BK levels of the 20 T1D outpatients were grouped as: 0 mmol/L (group 1), 0.1 mmol/L (group 2), 0.2 mmol/L (group 3), 0.3-0.6 mmol/L (group 4), 0.7-1.0 mmol/L (group 5), and >1.0 mmol/L (group 6).
(5) BA is a good indicator of the T1D with ketone bodies (BK >1.5 mmol/L).
Many physiological conditions or factors influence breath acetone concentration or its variations. However, continuous monitoring of breath acetone over a long period of time, which mitigates the baseline effect, can help screen and monitor adverse clinical conditions and abnormal physiological status such as T1D with DKA, lower BMI or post intense exercise. The data of the day-to-day variations in the simultaneous BA, BG, and BK for each individual over the 30 days period show a promise that the breath acetone measurement when is conducted under a clearly defined measuring condition and using a relatively large number of subjects is insightful into addressing how the breath acetone helps metabolic status monitoring.
Acknowledgements
This work was supported by the National Science Foundation of China (Grant No. 81471701). The authors thank the participation of numerous volunteers who provided breath gas samples. 1
References
- Yamada K, Ohishi K, Gilbert A, Akasaka M, Yoshida N, et al. (2016) Measurement of natural carbon isotopic composition of acetone in human urine. Anal Bioanal Chem 408: 1597-1607.
- Henderson MJ, Karger BA, Wrenshall GA (1952) Acetone in the breath: a study of acetone exhalation in diabetic and nondiabetic human subjects. Diabetes 1: 188-193.
- Wang Z, Wang C (2013) Is breath acetone a biomarker of diabetes? a historical review on breath acetone measurement. J Breath Res 7: 037109.
- Smith D, Span?l P, Fryer AA, Hanna F, Ferns GA (2011) Can volatile compounds in exhaled breath be used to monitor control in diabetes mellitus? J Breath Res 5: 022001.
- Hancock G, Langley CE, Peverall R, Ritchie GAD, Taylor D (2014) Laser-based method and sample handling protocol for measuring breath acetone. Anal Chem 86: 5838.
- Schwarz K, Pizzini A, Arendacká B, Zerlauth K, Filipiak W (2009) Breath acetone-aspects of normal physiology related to age and gender as determined in a PTR-MS study. J Breath Res 3: 027003.
- Span?l P, Dryahina K, Smith D (2007) Acetone, ammonia and hydrogen cyanide in exhaled of several volunteers aged 4-83 years. J Breath Res 1: 011001.
- Span?l P, Dryahina K, Smith D (2007) The concentration distribution of some metabolities in the exhaled breath of young adults. J Breath Res 1: 026001.
- Nelson N, Lagesson V, Nosratabadi AR, Ludvigsson J, Tagesson C (1998) Exhaled isoprene and acetone in newborn infants and in children with diabetes mellitus. Pediatr Res 44: 363-393.
- Diskin AM, Span?l P, Smith D (2003) Time variation of ammonia, acetone, isoprene and ethanol in breath: a quantitative SIFT-MS study over 30 days. Physiol Meas 24: 107-119.
- Turner C, Span?l P, Smith D (2006) A longitudinal study of ammonia, acetone and propanol in the exhaled breath of 30 subjects using selected ion flow tube mass spectrometry, SIFT-MS. Physiol Meas 27: 321-337.
- Smith D, Span?l P, Davies S (1999) Trace gases in breath of healthy volunteers when fasting and after a protein-calorie meal: a preliminary study. J Appl Physiol 87: 1584-1588.
- Bloor RN, Span?l P, Smith D (2006) Quantification of breath carbon disulphide and acetone follwing a single dose of disulfriam (Antabuse) using selected ion flow tube mass spectrometry (SIFT-MS). Addict Biol 11: 163-169.
- Musa-Veloso K, Likhodii SS, Cunnane SC (2002) Breath acetone is a reliable indicator of ketosis in adults comsuming ketogenic meals. Am J Clin Nutr 76: 65-70.
- Musa-Veloso K, Rarama E, Comeau F, Curtis R, Cunnane S (2002) Epilepsy and ketogenic diet: assessment of ketosis in children using breath acetone. Pediatr Res 52: 443-448.
- Musa-Veloso K, Likhodii SS, Rarama E, Benoit S, Liu YC, et al. (2006) Breath acetone predicts plasma ketone bodies in children with epilepsy on a ketogenic diet. Nutrition 22: 1-8.
- Lawson LD, Wang ZJ (2005) Allicin and allicin-derived garlic compounds increase breath acetone through allylmethyl sulfide: use in measuring allicin bioavailability. J Agric Food Chem 53: 1974-1983.
- Senthilmohan ST, Milligan DB, McEwan MJ, Freeman CG, Wilson PF (2000) Quantitative analysis of trace gases of breath during exercise using the new SIFT-MS technique. Redox Rep 5: 151-153.
- Schwoebel H, Schubert R, Sklorz M, Kischkel S, Zimmermann R, et al. (2011) Phase-resolved real-time breath analysis during exercise by means of smart processing of PTR-MS data. Anal Bioanal Chem 401: 2079-2091.
- Blaikie TPJ, Couper J, Hancock G, Hurst PL, Peverall R, et al. (2016) Portable device for measuring breath acetone based on sample preconcentration and cavity enhanced spectroscopy. Anal Chem 88: 11016.
- Ciaffoni L, Hancock G, Harrison JJ, Van Helden J-PH, Langley CE, et al. (2013) Demonstration of a mid-infrared cavity enhanced absorption spectrometer for breath acetone detection. Anal Chem 85: 846-850.
- Lewicki R, Wysocki G, Kosterev AA, Tittel FK (2007) QEPAS based detection of broadband absorbing molecules using a widely tunable, cw quantum cascade laser at 8.4 μm. Opt Express 15: 7357-7366.
- McCurdy MR, Bakhirkin Y, Wysocki G, Lewicki R, Tittel FK (2007) Recent advances of laser-spectroscopy-based techniques for applications in breath analysis. J Breath Res 1: 014001.
- Sun M, Jiang C, Gong Z, Zhao X, Chen Z, et al. (2015) A fully integrated standlone portable cavity ringdown breath acetone analyzer. Rev Sci Instrum 86: 095003.
- Jiang C, Sun M, Wang Z, Chen Z, Zhao X, et al. (2016) A portable real-time ringdown breath acetone analyzer: toward diabetic screening and management. Sensors 16: 1199.
- Wang C, Mbi A, Shepherd M (2010) A study on breath acetone in diabetic patients using a cavity ringdown breath analyzer: Exploring correlations of breath acetone with blood glucose and glycohemoglobin A1C. IEEE Sens J 10: 54.
- Sun M, Chen Z, Gong Z, Zhao X, Jiang C, et al. (2015) Determination of breath acetone in 149 type 2 diabetic patients using a ringdown breath-acetone analyzer. Anal Bioanal Chem 407: 1641.
- Sun M, Zhao X, Yin H, Wang Z, Jiang C, et al. (2015) Study of breath acetone and its correlations with blood glucose and blood beta-hydroxybutyrate using an animal model with lab-developed type 1 diabetic rat. RSC Adv 5: 71002.
- Gong Z, Sun M, Jiang C, Wang Z, Kang M, et al. (2014) A ringdown breath acetone analyzer: performance and validation using gas chromatography-mass spectrometry. J Anal Bioanal Tech. S7: 013.
- Turner C, Walton C, Hoashi S, Evans M (2009) Breath acetone concentration decrease with blood glucose concentration in type 1 diabetes mellitus patients during hypoglycaemic clamps. J Breath Res 3: 046004.
- Blaikie TP, Edge JA, Hancock G, Lunn D, Megson C, et al. (2014) Comparison of breath gases, including acetone, with blood glucose and blood ketones in children and adolescents with type 1 diabetes. J Breath Res 8: 046010.
- Kinoyama M, Nitta H, Watanabe A, Ueda H (2008) Acetone and isoprene concentrations in exhaled breath in healthy subjects. J health sci 54: 471-477.
- Rydosz A (2015) A negative correlation between blood glucose and acetone measured in healthy and type 1 diabetes mellitus patients breath. J Diabetes Sci Technol 9: 881.
- Li W, Liu Y, Lu X, Huang Y, Liu Y, et al. (2015) A cross-sectional study of breath acetone based on diabetic metabolic disorders. Journal of breath research. J Breath Res 9: 016005.
- Musa-Veloso K, Likhodii SS, Rarama E, Benoit S, Liu YC, et al. (2006) Breath acetone predicts plasma ketone bodies in children with epilepsy on a ketogenie diet. Nutrition 22: 1-8.
Citation: Sun M, Wang Z, Yuan Y, Chen Z, Zhao X, et al. (2017) Continuous Monitoring of Breath Acetone, Blood Glucose and Blood Ketone in 20 Type 1 Diabetic Outpatients Over 30 Days. J Anal Bioanal Tech 8:386. DOI: 10.4172/2155-9872.1000386
Copyright: © 2017 Sun M, et al. This is an open-access article distributed under the terms of the Creative Commons Attribution License, which permits unrestricted use, distribution, and reproduction in any medium, provided the original author and source are credited.
Select your language of interest to view the total content in your interested language
Share This Article
Open Access Journals
Article Tools
Article Usage
- Total views: 12666
- [From(publication date): 0-2017 - Nov 28, 2025]
- Breakdown by view type
- HTML page views: 11475
- PDF downloads: 1191