Correlation and Path Coefficient Analysis for Root Yield and Related Characters of Cassava (Manihot esculenta Crantz) Accessions in Southwest Ethiopia
Received: 18-Mar-2022 / Manuscript No. ACST-22-47226 / Editor assigned: 21-Mar-2022 / PreQC No. ACST-22-47226 (PQ) / Reviewed: 04-Apr-2022 / QC No. ACST-22-47226 / Revised: 18-May-2022 / Manuscript No. ACST-22-47226 (R) / Published Date: 01-Jun-2022 DOI: 10.4172/2329-8863.1000518
Abstract
An experiment was conducted to study the interrelationship of yield related characters and extent of their contribution to cassava fresh storage root yield using correlation and path coefficient analysis in the Southwest Ethiopia during the 2019–2021 cropping season. The design of the experiment was a simple lattice with two replications using sixty four cassava accessions. Genotypic correlation analysis showed that fresh storage root yield (t ha-1) observed significant and highly significant positive correlation with root diameter (r=0.65**), root length (r=0.31*), stem diameter (r=0.63**), root number per plant (r=0.54**), petiole length (r=0.47**), plant height (r=0.34**), weight fresh aboveground biomass per plot (r=0.56**) and harvest index (r=0.57**). Only magnitude difference Similarly result were found phenotypic correlation these character with fresh storage root yield (t ha-1), Hence, improvement in fresh storage root yield per hectare is possible by considering these characters as criteria in selection scheme. Path coefficient analysis revealed that weight fresh above ground biomass per plot (0.770) the highest and positive direct effect was exerted on fresh storage root yield per hectare, followed by harvest index per plot (0.763), root diameter (0.121) and petiole length (0.120). These character that exerted positive direct effect and strong positive correlation coefficient with fresh storage root yield were known to influences cassava fresh storage root yield in the favorable direction and needs much attention during the process of selection cases in point are weight of above ground biomass per plot, harvest index per plot, root diameter and petiole length.
Keywords: Cassava, Correlation, Direct Effect, Path analysis, yield Components, Root Yield
Introduction
Cassava is a significant food security and industrial crop, contributing as food, feed and industrial biomass in Africa, Asia and South America. The study stated that crop improvement efforts have focused to the development of cassava cultivars having desirable characters such as increased root, flour, and starch yield, reduced toxicity, reduced pest/disease susceptibility and improved nutrient contents. In sub-Saharan Africa cassava is the second to maize utmost staple food being the major source of food energy contribution up to 285 calories per person per day and it could be a track to food security and resilient to climate change. Nevertheless, in the East African region, cassava yield is on average 10 t/ha (10 t/ha in Ethiopia, 9.8 t/ha in Tanzania, 10.6 t/ha in Kenya and 12 t/ha in Uganda). These yields are about half compared to yields in some South Asian countries: China (16.7 t/ha), Thailand (22.26 t/ha), Indonesia (23.36 t/ha) and India (35.6 t/ha). In Ethiopia, cassava has been found to have an excellent adaptation and growth performance in different agro ecologies with productivity variation. Since the economic importance of cassava and the low average productivity in Ethiopia, there is tremendous scope to increase the yield per unit area and there by the total production. The main goal in any crop improvement program is to enhance yield. It is well recognized that economic yield is the final product and many characters contribute to its performance [1]. Meanwhile yield is a complex character and is dependent on a number of its component characters; yield cannot be improved to a greater extent on its own. Hence, selection of plants based directly on yield would not be very reliable and the information on the nature of association between yield and its components helps in simultaneous selection for many characters associated with yield improvements. The efficiency of breeding programme depends mainly on the direction and magnitude of association between yield and its components and also the relative importance of each factor involved in contributing to yield. Understanding the relative contribution of each character to yield may be accomplished using correlation studies. The estimates of correlation co-efficient analysis are more useful in the estimation of inter-relationship among the yield contributing component but simple correlation does not provide adequate information about the contribution of each factor towards yield. So, it becomes becomes necessary to study path coefficient analysis, which takes in to account the casual relationship in addition to degree of relationship. Furthermore, stated that path coefficient analysis is a standard partial regression coefficient that measures the direct influence of one variable up on others, and permits the separation of the correlation coefficient into components of direct and indirect effects. Therefore, a clear picture of contribution of each component in final expression of complex character is essential.
In southwest Ethiopia, cassava is a crop grown as a food security and income source. Since the economic importance of cassava and despite a few research efforts, the national average yield of cassava in Ethiopia (10 t ha-1) is still very low with compared to the genetic potential of the crop (80 t ha-1) and twice below productivity per unit area of some South Asian countries for example India (35.6 t ha-1). So as to achieve the target of increased production by increasing the yield potential of the cassava, understanding on direction and magnitude of association between yield and yield related character is essential for a cassava breeder. Hence, continuous improvement efforts of this crop are needed using suitable selection criteria in national or regional cassava improvement program. This warrants that there has research gap of study on interrelationships among various characters and amount of their contribution to root yield. Therefore, the major contributors of the characters for such important features of the crop need to be studied and exploited to design appropriate selection criteria in cassava breeding program. The object of this study was conducted to estimate the interrelationship of yield related characters and extent of their contribution to cassava fresh storage root yield using correlation and path coefficient analysis. Specific objectives: to determine the magnitude of correlation among characters and to determine the direct and indirect contribution of characters to cassava fresh storage root yield [2].
Materials and Methods
Description of the study area
The experiment was conducted at Tarcha research site in Dawuro zone of Southern Nation And Nationality People Regional State (SNNPRS) of Ethiopia during in 2019-2021 cropping season. Tarcha research site is located at latitude 07°09’32”N and longitude 037°10’16”E (Figure 1) with an altitude 1250 meters above sea level (M.A.S.L). The area receives mean annual rainfall of 1392 mm with mean maximum and minimum temperatures of 30°C and 17.0°C, respectively.

Figure 1: (A) Map and position of the study region in Ethiopia. (B) Zones map of the study area in region.
The soil of the study site is Nitosol (weathered brown) with pH of 5 .6 (EMA) [3].
Experimental materials
The study used 64 cassava accessions among which 15 accessions were provided by International Institute of Tropical Agriculture (IITA), Ibadan, Nigeria. The remaining 49 accessions were obtained from two national research centers namely Jimma Agricultural Research Center and Hawassa [4] Agricultural Research Center (Table 1).
| Genotype | Code | Source | Genotype | Code | Source |
|---|---|---|---|---|---|
| J-local | G1 | JARC | 46330/12 | G33 | HARC |
| 50583014 | G2 | HARC | 1051741 | G34 | HARC |
| F-100 | G3 | HARC | AWC-4 | G35 | HARC |
| 5028/73 | G4 | HARC | 1071393 | G36 | ITTA |
| 26/84 | G5 | HARC | 1061630 | G37 | ITTA |
| 5338-19 | G6 | HARC | 191/0427 | G38 | HARC |
| 1070952 | G7 | IITA | WALAMO | G39 | HARC |
| 45/72 white | G8 | HARC | 101 | G40 | HARC |
| 156 | G9 | HARC | 5532-4 | G41 | HARC |
| AWC-5 | G10 | HARC | 1070337 | G42 | ITTA |
| MM96/3280 | G11 | HARC | Wajo bohe | G43 | HARC |
| 1011224 | G12 | ITTA | Korre(original) | G44 | HARC |
| 5048-33 | G13 | HARC | Gamo dhaske | G45 | HARC |
| NALINDAM 96-41 | G14 | HARC | Korre- dhaske-8 | G46 | HARC |
| 1050125 | G15 | ITTA | Bajk-8 | G47 | HARC |
| KIgoma Red | G16 | HARC | 1038 | G48 | HARC |
| 1062630 | G17 | ITTA | M-94/0114 | G49 | HARC |
| 1070593 | G18 | ITTA | 1630 | G50 | HARC |
| AWC-3 | G19 | HARC | 869 | G51 | HARC |
| 45/72 Red | G20 | HARC | 1554 | G52 | HARC |
| MM 96/9361 | G21 | HARC | 196/624 | G53 | HARC |
| 10540 | G22 | ITTA | M-94/0125 | G54 | HARC |
| 1980510 | G23 | ITTA | Umbure | G55 | HARC |
| 1011206 | G24 | ITTA | 1708 | G56 | HARC |
| 104 | G25 | HARC | Bajk-1 | G57 | HARC |
| 200 | G26 | HARC | Korre-dhaske-7 | G58 | HARC |
| 1061365 | G27 | ITTA | AAGT 192 | G59 | JARC |
| 7070824 | G28 | HARC | Melko 108 | G60 | JARC |
| 1070539 | G29 | ITTA | AAGT 191 | G61 | JARC |
| MM 96/9308 | G30 | HARC | Hawassa -04 | G62 | JARC |
| 1010085 | G31 | ITTA | Kello | G63 | HARC |
| 1050127 | G32 | ITTA | Qulle | G64 | HARC |
| IITA = International Institute for Tropical Agriculture, JARC = Jimma Agriculture Research Center, HARC = Hawassa Agriculture Research Center | |||||
Table 1: List of cassava accessions with their code and source of collection.
Experimental design and management
The field experiment was laid out in 8 × 8 simple lattice designs with two replications (Figure 2) Mature cassava cuttings measuring 25-30 cm [6] long were planted (7 m2) in a single row plot of 7 m long using inter row spacing of 1 m and intra-rows spacing of 1 m on the top of ridge at an angle of 450 to the ground surface. All agronomic practices were done according to the recommendations and farmers’ practices of the areas. Five middle plants within a row were sampled and tagged for data collection and final harvest [7].

Figure 2: Cassava at seedling stage in field.
Data collection
Quantitative data measures and counting were taken on 3 plants for each accession per repetition. Five middle plants within a row were sampled and tagged for data collection and final harvest. All quantitative characters were measures as per described [8] in Table 2.
| Evaluation Period | Traits measured | Code | Scoring |
|---|---|---|---|
| 6MAP | length of leaf lobe(cm) | Lll | measured three leaves from the middle of the plant, measure from the intersection of all lobes to the end of the middle lobe |
| width of leaf lobe(cm) | Wll | measured three leaves from the middle of the plant, measure from the widest part of the middle lobe | |
| Ratio: length lobe/width lobe | R | ratio between length and width was performed with Excel | |
| Petiole length (cm) | Pl | measured two leaves/plant from the middle third | |
| 18MAP (Harvest) | Plant height (cm) | Ph | measured vertical height from the ground to the top of the canopy, record measurements from three plants |
| Canopy diameter (cm) | Cd | measured the top of the canopy diameter , record measurements from three plants | |
| Diameter of stem at 50 cm from ground (cm) | Sd | measured the main stem diameter using caliper at height of 50 cm , record measurements from three plants | |
| Level of branching | Lb | Counted level of branch from the ground to the top canopy from three plant | |
| Height of first branch(cm) | Hfb | measured vertical height from ground to first primary branch from three plant | |
| Number of storage roots per plant | Nsr | recorded from each of three plants | |
| Weight of fresh roots yield (t/ha) | Wfr | Was weighed the root fresh weight/plot then converted to tonnes per hectare (t/ha) | |
| Weight of fresh aboveground biomass per plot (kg) | Wfab | measured the weight of aboveground biomass | |
| Harvest index (%) | HI | Measured the weight of 5 plant |
Table 2: Quantitative data used and technique of measurement 64 cassava accessions.
Data analysis
All data generated were subjected to analysis of variance (ANOVA) using R-software (version 4.0.3). Phenotypic and genotypic correlation coefficients and co-variance analysis was estimated using the formula [9] suggested by Singh and Chaudhury and Miller. Direct and indirect contributions of various characters to root yield was calculated through path coefficient analysis according to the team of expert [10].
Variance and co-variance analysis
Phenotypic and genotypic variances and co-variances was calculated according to the method suggested by
Genotypic variance component
• Genotypic variance (σ2g)=(MSg -MSe)/r
• Where MSg is genotypic mean square, MSe is error mean square and r is replication
• Genotypic coefficient of variation (GCV)
• Where is the grand mean value of the trait
• Environmental variance component (On genotypic mean basis) σ2e=MSe/r
Phenotypic variance component
• Phenotypic variance (σ2p)=σ2g+σ2e
• Phenotypic coefficient of variation (PCV)
Covariance
Covariance was calculated using the following formula as:
• Genotypic covariance (Cov A)=rA σXAσYA
• Where rA=correlation of breeding values arises from two sources, σXA=standard deviation of trait x, σyA=standard deviation of trait y,
• Environmental covariance (CovE)=rEσXEσyE
Where rE=correlation of environmental deviations, σXE=environmental standard deviation of trait x, σyE=environmental standard deviation of trait y
• Phenotypic covariance (CovP)=Genotypic covariance (CovA) +Environmental covariance (CovE)
Correlation analysis
Correlation coefficient(r): was calculated using the standard procedure suggested by [11]
Phenotypic correlation coefficient between traits x and y is given by:
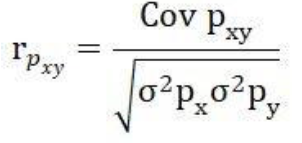
Where,
rpxy=Phenotypic correlation coefficient between traits x and y, Cov pxy=Phenotypic covariance between traits x and y, σ2px=Phenotypic variance of trait x, σ2py=Phenotypic variance of trait y
Genotypic correlation coefficient between traits x and y:
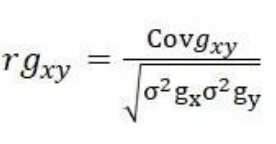
Where,
rgxy=genotypic correlation coefficient between traits x and y, Covg xy=genotypic covariance between trait x and y, σ2gx=genotypic variance of trait x, σ2gy=genotypic variance of trait y [12].
Genotypic and phenotypic correlation coefficients were tested for their significance using the formula, using the t- table at (g-2) degrees of at 5% and 1%level of significance.
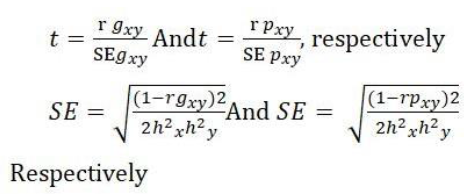
Where h2x and h2y are heritability values for trait x and y, respectively.
SE=standard error for genotypic and phenotypic correlation. G=number of genotypes.
Path coefficient analysis
Fresh root yield was considered as the dependent variable while the rest of characters were taken as [13] the independent variables. The direct and indirect effect of the independent characters on fresh root yield/plot was estimated with the formula given by [6]
Rij=Pij + Ʃ rik pjk
Where: Rij=mutual association between the independent character (i) and dependent characters (j) as measured by correlation coefficients, Pij=component of direct effect of independent variable (i) on the dependent variable (j) as measured by the phenotypic and genotypic path coefficient, and Σ rki pkj=summation of components of indirect effect of a given independent variable (i) on a given dependent variable (j) via all other k independent variables. Residual effect (R): The residual effect permits precise explanation about the pattern of interaction of other possible components of yield. It is estimated with the help of direct effects and simple correlation coefficient. The residual effect (R) was estimated as [14]:
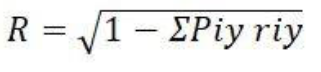
Where, Piy=direct effect of the independent variable i on the dependent variable y; riy=the correlation coefficient of the independent variable i with the dependent variable y [15].
Results and Discussion
Correlation root yield with other character
The Genotypic (rg) and [16] Phenotypic (rp) correlation coefficients for fifteen characters in 64 cassava accessions were presented in (Table 3). The genotypic correlation coefficient for fresh storage root yield per hectare showed significant and highly significant positive correlation with root diameter (rg=0.65), root length (rg=0.31), stem diameter (rg=0.63), root number per plant (rg=0.54), petiole length (rg=0.47), plant height (rg=0.34), weight fresh aboveground biomass
per plot (rg=0.56) and harvest index (rg=0.57) (Table 3). On the other hand, fresh storage root yield had significant negative correlation with ratio leaf lobe length to leaf lobe width (rg=-0.31) and also it had non- significant correlation with leaf lobe [17] length and width, height of first branch and canopy diameter (Table 3). In the same way at phenotypic level, fresh storage root yield per hectare showed significant and highly significant positive correlation with root diameter (rp=0.37), root length (rp=0.24), stem diameter (rp=0.30), root number per plant (rp=0.39), petiole length (rp=0.32), weight fresh aboveground biomass per plot (rp=0.49) and harvest index (rp=0.59) (Table 3). Likewise genotypic level, fresh storage root yield per hectare at phenotypic level had significant negative correlation with ratio leaf lobe length to leaf lobe width (rg=-0.18) but it had non- significant correlation with the rest of the characters (Table 3) [18].
Correlations among characters play a vital role in plant breeding by refining selection efficiency. Stronger and positive correlations are observed between fresh storage root yield per hectare with root diameter, root length, stem diameter, root number per plant, petiole length, plant height, weight fresh aboveground biomass per plot and harvest index characters indicating that any increase in such characters will do the boosting in root yield(Table 3). This genotypic and phenotypic correlation results is agreed with research findings of earlier workers with respect to positive correlation of root yield with stem diameter and number of commercial roots per plant, root length, root diameter. However, fresh storage root yield per hectare has negative correlation with ratio leaf lobe length to leaf lobe width, suggesting that when selection for high root fresh yield one should go for accessions with low leaf length to width ratio (Table 3) [19].
In generally, the attributes of genotypic and phenotypic correlation coefficients value either positive or negative are exhibited roughly similar in respect of the majority of the characters studied (Table 3). In [20] those characters in which fresh storage root yield show positive and significant correlation, there are component interactions in which a gene get ready an increase in one character will influence another character as long as other conditions are kept constant. Hence, improvement in fresh storage root yield per hectare is possible by considering above characters as criteria in selection design (Table 3). Furthermore, the significantly higher magnitudes of positive genotypic correlation than the corresponding phenotypic correlation in respect to some of the characters (Table 3) suggest that these characters are strong [21] association with root yield and genetically controlled. Larger genotypic correlation coefficients indicate greater contribution of genetic factors and reduced effects of the environment. These results agree with the study by expert team, they found cassava root yield genotypic correlation magnitude higher than phenotypic correlation with respect to the characters studied. In contrary, noted that in sweet potato accessions, the genotypic correlation coefficients are lower than the phenotypic correlation coefficients among different sweet potato traits, indicating the significant effects of the environment [22]. The magnitude may be varied among crop types.
Correlation among other character
Many Several remarkable genotypic and phenotypic associations were revealed among themselves (Table 3). The Genotypic (rg) association results showed that stem diameter had highly significant positive association with leaf lobe width (rg=0.34), petiole length (rg=0.40), plant height (rg=0.80), root number per plant (rg=0.48), root diameter (rg=0.28), root length (rg=0.41) and [23] weight fresh above ground biomass per plot (rg=0.65) and it had non-significant association with the rest of the characters (Table 3). Likewise, root diameter had positive and significant correlation with petiole length (rg=0.37), height first branch (rg=0.34), weight fresh above ground biomass per plot (rg=0.25), harvest index per plot (rg=0.42) and it revealed non-significant association with the rest of the characters except stem diameter (Table 3). Further, stronger and positive associations were observed between root number per plant with root length (rg=0.33) and weight fresh aboveground biomass per plot (rg=0.66) suggesting that as cassava root length and aboveground biomass per plot increases correspondingly it will increase in root number per plant. Most of the characters have negative genotypic associations with number of root per plant (Table 3).
At [24] Phenotypic (rp) level, stem diameter had significant and highly significant positive association with petiole length (rp=0.28), plant height (rp=0.22), root number per plant (rp=0.26), root diameter (rp=0.18), weight fresh above ground biomass per plot (rp=0.38) and it had non-significant association with the rest of the characters (Table 3). Root diameter had strong positive association with petiole length (rg=0.28), weight fresh above ground biomass per plot (rg=0.25), harvest index per plot (rg=0.20) whereas rest of the characters showed non-significant association except stem diameter. Similarly, root number per plant had highly significant and positive association with root length (rp=0.23) and weight fresh above ground biomass per plot (rp=0.47). Among the characters, petiole length, plant height, root number per plant, root diameter and weight fresh above ground biomass per plot are strong positively associated with stem diameter at both genotypic and phenotypic levels (Table 3) [25].
In the present study, many genotypic and phenotypic associations are observed among themselves (Table 3). The character has more and strong positive correlation with respect to the character studied, suggest that any increase in such characters will do the boost more than one character among themselves. Also the observed associations among the agronomic characters indicate that improvement of one character would also result in simultaneous improvement to the other character. The results are in [26] accordance with who reported genotypic and phenotypic associations are observed among themselves for sweet potato. As compared to genotypic correlation, the value of phenotype correlation coefficients between most of the characters is lower than among themselves [27].
| Traits | LLL | WLL | R | PL | PH | CD | SD | LB | HFB | RN | RD | RL | WFAB | HI | FSRY |
|---|---|---|---|---|---|---|---|---|---|---|---|---|---|---|---|
| LLL | 0.64** | 0.32 * | 0.49** | 0.55** | -0.09NS | 0.19NS | -0.23NS | 0.14NS | -0.06NS | 0.22NS | -0.1NS | -0.2NS | 0.14NS | -0.04 NS | |
| WLL | 0.49** | -0.49** | 0.74** | 0.47** | -0.27* | 0.35 ** | -0.28 * | 0.11 NS | 0.12 NS | 0.19 NS | -0.16 NS | -0.03 NS | 0.27* | -0.21 NS | |
| R | 0.42** | -0.55 ** | -0.32* | -0.01NS | 0.22NS | -0.24NS | 0.04NS | 0.01NS | -0.28 * | -0.02NS | -0.04 NS | -0.21NS | -0.17NS | -0.31 * | |
| PL | 0.41** | 0.60 ** | -0.23 ** | 0.54** | -0.16 NS | 0.40 ** | -0.13NS | 0.14NS | 0.10NS | 0.37 ** | -0.11NS | 0.26* | 0.21 NS | 0.47** | |
| PH | 0.33** | 0.22* | 0.05NS | 0.28 ** | -0.13 NS | 0.80** | -0.34** | 0.27* | 0.12NS | 0.24 NS | 0.18 NS | 0.51** | -0.10NS | 0.34** | |
| CD | 0.03NS | -0.09 NS | 0.13NS | -0.07 NS | 0.18* | 0.18 NS | 0.09NS | -0.05NS | 0.09NS | -0.15NS | -0.07NS | 0.21 NS | 0.04NS | 0.21 NS | |
| SD | 0.11 NS | 0.11NS | -0.06NS | 0.28 ** | 0.22* | 0.02 NS | -0.08NS | 0.04NS | 0.48** | 0.29* | 0.41 ** | 0.65** | 0.06NS | 0.63 ** | |
| LB | -0.17 NS | -0.24 ** | 0.06 NS | -0.12 NS | -0.11 NS | 0.08 NS | -0.05 NS | -0.19NS | -0.07 NS | -0.16NS | 0.09NS | 0.04NS | 0.01 NS | 0.01NS | |
| HFB | 0.09NS | 0.05 NS | 0.03 NS | 0.11NS | 0.15NS | -0.02 NS | 0.03NS | -0.17NS | 0.03NS | 0.34** | -0.11 NS | 0.07 NS | 0.06NS | 0.16 NS | |
| RN | -0.06NS | 0.03 NS | -0.14NS | 0.09 NS | 0.09NS | 0.03 NS | 0.26 ** | -0.02 NS | -0.04NS | 0.16 NS | 0.33 ** | 0.66 ** | 0.03NS | 0.54** | |
| RD | 0.14 NS | 0.01NS | 0.12NS | 0.28 ** | 0.12 NS | -0.05 NS | 0.18 * | -0.15NS | 0.17NS | 0.10 NS | -0.06 NS | 0.25 * | 0.42** | 0.65** | |
| RL | -0.08NS | -0.14 NS | 0.01 NS | -0.07 NS | 0.06NS | 0.02 NS | 0.07 NS | 0.04NS | -0.06NS | 0.23** | 0.14 NS | 0.47** | -0.07NS | 0.31* | |
| WFAB | -0.21 * | -0.06 NS | -0.15 NS | 0.22* | 0.26 ** | 0.14NS | 0.37** | 0.03NS | 0.05NS | 0.47** | 0.18* | 0.29 ** | -0.35 ** | 0.56 ** | |
| HI | 0.12 NS | 0.14NS | -0.06 NS | 0.08NS | -0.10NS | 0.02 NS | -0.02NS | 0.02 NS | 0.05NS | 0.02NS | 0.20* | 0.01NS | -0.39 ** | 0.57 ** | |
| FSRY | -0.04 NS | 0.10NS | -0.18 * | 0.32 ** | 0.14NS | 0.13 NS | 0.30 ** | 0.03NS | 0.11NS | 0.39** | 0.37 ** | 0.24** | 0.49** | 0.59** | |
| Key: NS=none significant,*Significant at 0.05 probability level; **= Highly significant at 0.01 level of probability level, LLL=leaf lobe length(cm), WLL= width of leaf lobe(cm), R= ratio leaf lobe length to width leaf lobe ,PL=petiole length(cm), PH= plant height(cm) , CD= canopy diameter(cm), SD= stem diameter(cm), LB= level of branch per plant, HFB= height of first branch(cm), RN= Root number per plant , RD= root diameter(cm) , RL= Root length(cm) , WFAB= weight of fresh above ground biomass (kg /plot), HI= harvest index(%) and FSRY = fresh storage root yield(t/ha). |
|||||||||||||||
Table 3: Genotypic (above diagonal) and Phenotypic (below-diagonal) correlations of 15 cassava traits grown at Tarcha, 2019-2021.
Path-coefficient analysis
Based on genotypic path coefficient analysis result revealed that weight fresh above ground biomass per plot (0.770) the highest and positive direct effect was applied on fresh storage root yield per hectare, followed by harvest index per plot (0.763), root diameter (0.121) and petiole length (0.120) (Table 4). On the other hand, canopy diameter, root length and height of first branch were employed weak positive direct effects 0.079, 0.034 and 0.014, respectively on fresh storage root yield per plot, whereas plant height (-0.006), stem diameter(-0.029), level of branch per plant (-0.029), root number (-0.035), leaf lobe length to width ratio(-0.042) and width of leaf lobe (-0.058) had negative direct influence (Table 4). The residual factor (0.037) showed that about 96.3% of the variability in fresh storage root yield per hectare was contributed by the fourteen characters studied in path analysis. This means, those characters considered in this study are sufficient to adequately explain the variation in fresh storage root yield in cassava (Table 4) [28].
As correlation coefficients analysis does not permit the separating of both phenotypic and genotypic correlation coefficients in to direct and indirect effect, they are further analyzed by path coefficient analysis. Therefore [29], Path coefficient analysis is a tool to separation the showed association into direct and indirect effects of yield components on fresh storage root yield per hectare offers clearer picture of character association for expressing efficient component approach (Table 4). A very high positive direct contribution to fresh storage root yield per hectare is employed by weight fresh above ground biomass per plot. Harvest index per plot, root diameter, petiole length, canopy diameter and root length are also major positive direct contribution to the fresh storage root yield per hectare (Table 4). Also all these characters were correlated strongly and positively with fresh storage root yield per hectare (Table 4), suggest that indirect selection of these characters would be worthwhile to improve cassava fresh storage root yield. In other words, positive direct effects of these characters on fresh storage root yield per hectare indicate that, with other variables kept constant, improvement of these characters will increase fresh storage root yield per hectare (Table 4). Similar results are reported by for root diameter, number of branch per plant and for root diameter, number root per plant, weight fresh above ground biomass per plot and for stem diameter, root diameter and negative direct effect petiole length on fresh storage root yield. All those authors are found root diameter the most important components contributing to fresh storage root yield. On other study [10,29,30] are also reported that above ground fresh weight per plot and harvest index per plot have direct positive effects on tuber yield of sweet potato which is supported by present findings.
The negative direct effect of these six characters on fresh storage root weight might be explained by the fact that selection based on these six characters might reduce fresh storage root weight (Table 4). But from these root number, stem diameter and plant height characters are also exhibited strong and positive genotypic correlations with fresh storage root yield (Table 4). This finding is in agreement with who are stated that plant height and root number per plant are negative direct effect on fresh storage root yield of cassava but opposite results are reported by for canopy diameter, stem diameter and level of branch per plant. Similarly, for leaf length and leaf width are negative and positive direct effect respectively on tuber yield of yam. Within the scope of the path analysis is carried out in the present study, it is, hence, suggested that the weight of above ground biomass per plot, harvest index per plot, root diameter and petiole length are the main components of yield should be given high attentions in the selection process [30].
| Traits | LLL | WLL | R | PL | PH | CD | SD | LB | HFB | RN | RD | RL | WFAB | HI | rg |
|---|---|---|---|---|---|---|---|---|---|---|---|---|---|---|---|
| LLL | 0.000 | -0.038 | 0.013 | 0.059 | -0.003 | -0.007 | -0.005 | 0.007 | 0.002 | 0.002 | 0.027 | -0.004 | -0.158 | 0.106 | -0.04 NS |
| WLL | 0.000 | -0.058 | 0.021 | 0.088 | -0.003 | -0.021 | -0.010 | 0.008 | 0.002 | 0.004 | 0.023 | -0.005 | -0.026 | 0.207 | -0.21 NS |
| R | 0.000 | 0.029 | -0.042 | -0.038 | 0.000 | 0.017 | 0.007 | -0.001 | 0.000 | 0.010 | -0.003 | -0.001 | -0.159 | -0.130 | -0.31 * |
| PL | 0.000 | -0.043 | 0.013 | 0.120 | -0.003 | -0.013 | -0.011 | 0.004 | 0.002 | 0.004 | 0.044 | -0.004 | 0.200 | 0.157 | 0.47** |
| PH | 0.000 | -0.028 | 0.001 | 0.064 | -0.006 | -0.010 | -0.023 | 0.010 | 0.004 | -0.004 | 0.029 | 0.006 | 0.394 | -0.073 | 0.34** |
| CD | 0.000 | 0.016 | -0.009 | -0.020 | 0.001 | 0.079 | -0.005 | -0.003 | -0.001 | -0.003 | -0.018 | -0.002 | 0.160 | 0.032 | 0.21 NS |
| SD | 0.000 | -0.020 | 0.010 | 0.048 | -0.005 | 0.014 | -0.029 | 0.002 | 0.001 | -0.017 | 0.036 | 0.014 | 0.502 | 0.042 | 0.63 ** |
| LB | 0.000 | 0.016 | -0.002 | -0.015 | 0.002 | 0.007 | 0.002 | -0.029 | -0.003 | 0.002 | -0.020 | 0.003 | 0.027 | 0.010 | 0.01NS |
| HFB | 0.000 | -0.006 | -0.001 | 0.017 | -0.002 | -0.004 | -0.001 | 0.006 | 0.014 | -0.001 | 0.041 | -0.004 | 0.054 | 0.046 | 0.16 NS |
| RN | 0.000 | -0.007 | 0.012 | 0.012 | -0.001 | 0.007 | -0.014 | 0.002 | 0.000 | -0.035 | 0.019 | 0.011 | 0.511 | 0.026 | 0.54** |
| RD | 0.000 | -0.011 | 0.001 | 0.044 | -0.001 | -0.011 | -0.008 | 0.005 | 0.005 | -0.006 | 0.121 | -0.002 | 0.193 | 0.318 | 0.65** |
| RL | 0.000 | 0.009 | 0.001 | -0.013 | -0.001 | -0.006 | -0.012 | -0.003 | -0.002 | -0.012 | -0.007 | 0.034 | 0.363 | -0.052 | 0.31* |
| WFAB | 0.000 | 0.002 | 0.009 | 0.031 | -0.003 | 0.016 | -0.019 | -0.001 | 0.001 | -0.023 | 0.030 | 0.016 | 0.770 | -0.269 | 0.56 ** |
| HI | 0.000 | -0.016 | 0.007 | 0.025 | 0.001 | 0.003 | -0.002 | 0.000 | 0.001 | -0.001 | 0.051 | -0.002 | -0.272 | 0.763 | 0.57 ** |
| Key: LLL=leaf lobe length(cm), WLL= width of leaf lobe(cm), R= ratio leaf lobe length to width leaf lobe ,PL=petiole length(cm), PH= plant height(cm) , CD= canopy diameter(cm), SD= stem diameter(cm), LB= level of branch per plant, HFB= height of first branch(cm), RN= Root number per plant , RD= root diameter(cm) , RL= Root length(cm) , WFAB= weight of fresh above ground biomass (kg /plot), HI= harvest index(%) and FSRY = fresh storage root yield(t/ha). | |||||||||||||||
Table 4: Genotypic direct effects (bold and underlined diagonals) and indirect effects (off-diagonals) of 14 variables on fresh storage root yield of cassava at Tarcha.
Residual effect=0.037
Conclusion
Various characters in determinants of fresh storage root yield and yield components are influenced greatly by the genotype and environment. Hence, as new cultivars are being made by crossing or selection, the breeders investigate the associations between root yield and its components. Therefore, association assessments are useful in defining the components of complex characters such as fresh storage root yield. To increase the fresh storage root yield of cassava, one has to examine of direct and indirect effects of yield components which give the basis for its effective cassava root yield improvement and thus the difficult of fresh storage root yield increase can be more successfully undertaken due to performance of yield components and selection for closely associated characters.
Based on this findings, it may be conclude character that employed positive direct effect and strong positive association value with fresh storage root yield is identified to influence cassava fresh storage root yield in the positive direction and requires much consideration during the process of selection situations in point are weight of above ground biomass per plot, harvest index per plot, root diameter and petiole length.
Acknowledgments
Authors would like to thank Jimma and Wolita Sodo University for financing the research work. Authors are also pleased to acknowledge Jimma agricultural research, center, Hawassa agricultural research center and International Institute for Tropical Agriculture who provided planting materials.
References
- Babu Rao B, Ashok P, Ramanandam G, Sasikala K (2015) Trait association and path coefficient analyses in cassava. Int J Veg Sci 21: 402-415.
- Babu Rao B, Swami DV, Kalyana Babu B, Ashok P, Ramanandam G, et al. (2017) Correlation and path coefficient analysis of cassava (manihot esculenta crantz) genotypes. Int J Curr Microbiol App Sci 6: 549-557.
- Benesi IRM (2005) Characterization of malawian cassava germplasm for diversity, starch extraction and its native and modified Properties. Doctoral dissertation, Univer Free State 270.
- Daniel Markos, Legesse Hidoto, Fiseha Negash (2016) Achievements of cassava agronomy research in southern ethiopia in the last two decades. Agric Food Sci Res 3:12-18.
- Danquah JA, Gracen VE, Offei SK, Asante IK, Aduening JM, et al. (2016) Agronomic performance and genotypic diversity for morphological traits among cassava genotypes in the Guinea Savannah ecology of Ghana. J Crop Sci Biotechnol 19: 99-108.
- Dewey DR, Lu KH (1959) A correlation and path coefficient analysis of components of crested wheat grass seed production. Agron J 51: 515-518.
- Gari T, Loha E, Deressa W, Solomon T, Lindtjorn B, et al. (2018) Malaria increased the risk of stunting and wasting among young children in Ethiopia: Results of a cohort study. PloS one 13: e0190983.
- Cavalcante M, Ferreira PV, Paixao SL, da Costa JG, Pereira RG, et al. (2010) Agronomic performance, genetic dissimilarity and parental selection of sweet potato for hybridization. Revista Brasileira de Ciências Agrárias (Agrária) 5: 485-490.
- Zaidi SS, Vanderschuren H, Qaim M, Mahfouz MM, Kohli A, et al. (2019) New plant breeding technologies for food security. Sci 363: 1390-1391.
- Bovell Benjamin AC (2007) Sweet potato: A review of its past, present, and future role in human nutrition. Adv Food Nutr Res 52: 1-59.
- Burke M, Lobell D (2010) Food security and adaptation to climate change: What do we know?. Climate change and food security pp: 133-53.
- Kong YR, Jong YX, Balakrishnan M, Bok ZK, Weng JK, et al. (2021) Beneficial role of Carica papaya extracts and phytochemicals on oxidative stress and related diseases: A mini review. Bio 10: 287.
- Iqbal S, Mahmood T, Ali TM, Anwar M Sarwar M, et al. (2003) Path coefficient analysis in different genotypes of soybean (Glycine max (L)Merril). Pakistan J Biol Sci 6: 1085-1087.
- Matin MQ, Uddin MS, Rohman MM, Amiruzzaman M, Azad AK, et al. (2017) Genetic variability and path analysis studies in hybrid maize (Zea mays L.). Am J Plant Sci 8: 3101-3109.
- Kundy AC, Mkamilo GS, Misangu RN (2014) Correlation and Path Analysis between yield and yield Components in Cassava (Manihot esculenta Crantz) in Southern Tanzania. J Nat Sci Res 4: 6-10.
- Sayed MA, Bedawy IM (2016) Heterosis and inheritance of some physiological criteria imparting drought tolerance of grain sorghum in the irrigated and water-limited environments. Egypt J Agron 38: 293-318.
- Miller PA, Williams JC, Robinson HF, Comstock RE (1958) Estimates of Genotypic and Environmental Variances and Covariances in Upland Cotton and Their Implications in Selection. Agronomy J 50: 126-13.
- Oluwatoyin Ayetigbo ID, Sajid Latif, Adebayo Abass, Joachim Müller (2018) Comparing Characteristics of Root, Flour and Starch of Biofortified Yellow-Flesh and White-esh Cassava Variants, and Sustainability Consideration: A review. Sustainability 10: 3089.
- Robertson (1959) The sampling variance of the genetic correlation coefficient. Biometric 15: 469-485.
- Singh RK, Chaudhary BD (1977) Biometrical methods in quantitative genetic analysis 304.
- Singh D, Guaf J, Okpul T, Wiles GD, Hunter D, et al. (2006) Taro (Colocasia esculenta) variety release recommendations forpapua new guinea based on multi-location trials New Zealand. J Crop Hortic Sci 34: 163-171.
- Shimelis H, Hugo A (2011) Determination of selection criteria for seed yield and seed oilcontent in Vernonia (Vernonia galamensis variety ethiopica). Indus Crops Pro 33: 436-439.
- Okpara DA, Mbah EU, Ojikpong TO (2014) Association and path coefficients analysis of fresh root yield of high and low cyanide cassava (Manihot esculenta Crantz) genotypes in the humid tropics. J Crop Sci Biotechnol 17:103-109.
- Aina O, Dixon A, Akinrinde E (2007) Trait association and path analysis for cassava genotypes in four agroecological zones of Nigeria. J Bio Sci 7: 759-764.
- Tewodros M, Mohammed H (2012) Genetic variability and association among yield and yield related traits in Aerial Yam/Dioscorea bulbifera (L.)/Accessions at Southwestern Ethiopia. J Nat Sci Res 9: 63-70.
- Mulualem T, Dagne Y (2013) Studies on Correlation and Path Analysis for root yield and related traits of cassava (manihot esculenta crantz) in south ethiopia. J Plant Sci 1: 33-38.
- Mulualem T (2016) Genetic Diversity, Path Coefficient Analysis, Classification and Evaluation of Yams (Dioscorea spp.) in Southwest Ethiopia. University Haramaya, Ethiopia.
- Tirkey PL, Jitendra Singh, Chaurasia PC, Sarnaik DA (2011) Character association and path coefficient studies in sweet potato (Ipomoea batatas (L.) Lam.) Genotypes. J Plant Dev Sci 3: 137-143.
- Tsegaye E, Sastry EVD, Dechassa N (2006) Correlation and path analysis in sweet Potato and their implications for clonal selection. J Agron 5: 391-395.
- Wright S (1921) Correlation and causation. J Agril Res 20: 557-585.
- Yadav SK, Pandey P, Kumar B, Suresh BG (2011) Genetic architecture, interrelationship and selection criteria for yield improvement in rice (Oryza sativa L.). Pak J Biol Sci 14: 540-545.
Indexed at, Google Scholar, Crossref
Indexed at, Google Scholar, Crossref
Indexed at, Google Scholar, Crossref
Indexed at, Google Scholar, Crossref
Citation: Bilate B, Belew D, Mulualem T, Abtew WG (2022) Correlation and path coefficient analysis for root yield and related characters of cassava (manihot esculenta crantz) accessions in southwest ethiopia. Adv Crop Sci Tech 10: 518 DOI: 10.4172/2329-8863.1000518
Copyright: © 2022 Bilate B, et al. This is an open-access article distributed under the terms of the Creative Commons Attribution License, which permits unrestricted use, distribution, and reproduction in any medium, provided the original author and source are credited.
Select your language of interest to view the total content in your interested language
Share This Article
Recommended Journals
Open Access Journals
Article Tools
Article Usage
- Total views: 4202
- [From(publication date): 0-2022 - Nov 15, 2025]
- Breakdown by view type
- HTML page views: 3562
- PDF downloads: 640