Correlation and Path Coefficient Analysis of Yield and Yield Associated Traits in Barley (Hordeum vulgare L.) Germplasm
Received: 05-Mar-2016 / Accepted Date: 21-Mar-2016 / Published Date: 28-Mar-2016 DOI: 10.4172/2329-8863.1000216
Abstract
Sixty four barley genotypes were tested in 8 × 8 simple lattice design at Atsbi, Ofla and Quiha environments in Tigray region, in 2009/10. The objective was to estimate the extent of association between pairs of characters in genotypic and phenotypic levels and thereby compare the direct and indirect effects of the characters. Analysis of variance (ANOVA) revealed that there was a significant difference (p<0.001) among the sixty four genotypes for all the characters studied except for 1000-kernel weight at Quiha which was significant (p<0.05) and plant height was non-significant at Atsbi and Ofla. Grain yield had positive and highly significant phenotypic and genotypic correlation with 1000-kernel weight and biological yield in all environments except harvest index at Ofla. Grain yield had positive and highly significant phenotypic and genotypic correlation with 1000-kernel weight and biological yield in all environments except harvest index at Ofla. On the other hand, grain yield had negative and highly significant correlation at genotypic level with days to heading and days to maturity only at Ofla. Path analysis revealed that biological yield exerted maximum positive direct effect on grain yield across location followed by harvest index excluding Ofla. However, days to maturity exhibited highest negative direct effect on grain yield at Ofla.
Keywords: PCV; GCV; Path coefficient analysis; Direct effect
404302Introduction
The center of origin of cultivated barley has been reported to be the Fertile Crescent of the Middle East [1]. Even though barley was indicated to have been brought to Ethiopia at least 5000 years ago [2,3] new studies supporting the polyphyletic origin of the crop have indicated Ethiopia as one of the centers of origin of barley [4] Furthermore, barley is believed to have originated in Abyssinia (Ethiopia) and Southeast Asia [5]. According to Vavilov [6] declared that nowhere else in nature he has observed such a diversity of forms and genes. Therefore, he proposed Abyssinia (the former Ethiopian Empire) as a center of origin of cultivated barley. The genus Hordeum has centers of diversity in central and southwestern Asia, western North America, southern South America, and the Mediterranean [7]. Cultivated barley is adapted to and produced over a wider range of environmental conditions than other cereals. It can grow at a latitude of 70° North in Norway, on the fringe of the Sahara desert in Algeria and below the equator in Ecuador and Kenya. In addition, it was observed at elevations up to 4200 meters on the Altiplano and slopes of the Andes in Bolivia and at 330 meters below sea level near the Dead Sea [8,9].
In genetic studies, it is necessary to distinguish two cause of correlation between characters, genetic and environmental. Two possible causes of correlation are attributed to pleiotropism and/or linkage disequilibrium [10]. Pleiotropy, particularly in a population derived from crosses between divergent strains. The degree of correlation arises from pleiotropy expresses the extent to which two characters are influenced by the same genes. Some genes may increase both characters, while others increase one and reduce the other; the former tends to cause a positive correlation, the latter a negative one.
The association between two characters that can be directly observed is the correlation of phenotypic values, or the phenotypic correlation. This is determined from measurements of the two characters in a number of individuals of the population. The genotypic correlation is the correlation of breeding values, and the environmental correlation, the correlation of environmental deviations together with non-additive genetic deviations [11].
Correlation coefficients measure the absolute value of the correlation between variables in a given body of data. Correlation does not say anything about the cause and effect relationship [12]. Path coefficient analysis is a very important statistical tool that indicates which variables (causes) exert influence on other variables (effects), while recognizing the impacts of multi colinearity [13]. A path coefficient measures the direct influence of one variable upon another and permits the separation of correlation coefficient into components of direct and indirect effects. Path coefficient analysis specifies the cause and measures the relative importance of the characters, while correlation measures only mutual association without considering causation [14].
In any breeding program of complex characters such as yield for which direct selection is not effective, it becomes essential to measure the contribution of each of the component variables to the observed correlation and to partition the correlation into components of direct and indirect effect [15].
Information on the extent and nature of interrelationship among characters helps in formulating efficient scheme of multiple trait selection, as it provides a means of direct and indirect selection of component characters. Therefore, the objective of this study was to estimate the extent of association between pairs of characters in genotypic and phenotypic levels and thereby compare the direct and indirect effects of the characters.
Materials and Methods
Description of the study sites
The experiment was conducted at three locations of the Tigray region, namely Atsbi, Ofla and Quiha where barley grows most with an erratic rainfall where heavy rain alternate with dry periods resulting in alternating floods and dry periods. The region receives the least rainfall compared to other parts of Ethiopia. The average annual rainfall for the period from 1961 to 1987 was 571 mm, which was 38% less than the national average (921 mm) for the same period [16]. The mean annual rainfall ranges from 980 mm on the Central plateau to 450 mm on the northeastern escarpments of the region [17]. The annual rainfall shows a high degree of variation ranging from 20% in the western to 49% in the eastern parts of Tigray [18]. The map of experimental sites is given in Figure 1 and the different characteristics of each location are presented in Table 1.
| Testing location |
Agro-ecological zones | Altitude (m.a.s.l) |
Location | Annual rainfall (mm) | Annual temperature | Soil type | Soil pH | ||
|---|---|---|---|---|---|---|---|---|---|
| Latitude | Longitude | Min. | Max. | ||||||
| Atsbi | SM2e | 2630 | 13°52’N | 39° 44’E | 500 - 600 | 15°c | 15- 35°c | Sandy loam | 6.1 |
| Quiha | Not available | 2247 | 13°30’N | 39° 29’E | 812.4 | 15.4°c | 20.4°c | Clay loam | 6.7 |
| Ofla | SM2a | 2539 | 12°30′N | 39°31′E | 450 - 800 | 6°c | 32°c | Clay loam | 5.2 |
Table 1: Different characteristics of locations.
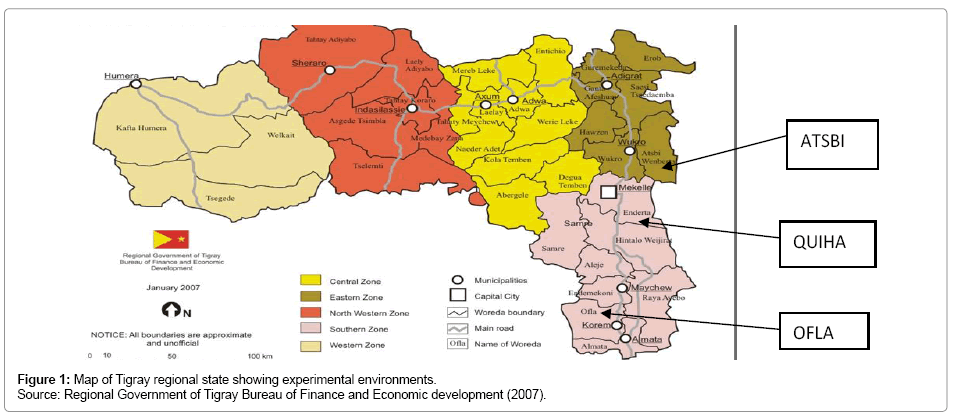
Figure 1: Map of Tigray regional state showing experimental environments. Source: Regional Government of Tigray Bureau of Finance and Economic development (2007).
Experimental materials
A total of 64 barley genotypes from ICARDA and one local check (Saesea) were considered in this study.
Experimental design, management and season
The experiments were conducted in 2009/10 in main cropping season using 8 × 8 Lattice design with two replications at three locations. The varieties were planted in a plot consisted of a four rows with 2 m long and 20 cm apart. The middle two rows were used for data collection. Planting was done by hand drilling using a seed rate of 80 kg/ha for each variety. Nitrogen and phosphorous fertilizers were applied at the rate of 50 kg/ha Urea and100 kg/ ha DAP at planting. All other management practices were uniformly applied to all plots at planting.
Data collected: Data were collected for the following parameters like plant height, spike length and number of kernels per spike. The data were recorded on plant basis by randomly selecting 10 plants from each plot. Number of productive tillers/m2 was recorded by counting the whole second row and then converted into 1 m2 area, whereas days for heading, days for maturity, 1000 kernel weight, biological yield, grain yield, and germination test were estimated on plot basis. The germination test was done by soaking 100 seeds of each genotype in water for 12 hours. Then the seeds were planted using top-dressing method on filter paper and two batches of fifty seeds of each genotype were germinated in a box, which were kept under its plastic cover to reduce evaporation. The germination boxes were placed on the laboratory bench at room temperature of 20°C (± 0.5) and were watered every other day.
Evaluation of germination test was done on the seventh day from sowing. A seed was considered to have germinated if the radicle exceeded 2 mm in length [19].
Statistical analysis
Analysis of variance (ANOVA): The data collected for each quantitative trait were subjected to analysis of variance (ANOVA) for simple lattice design. Analysis of variance was done using Proc lattice and Proc GLM procedures of SAS version 9.2, [20] after testing the ANOVA assumptions. Before pooling the data across environments, test of heterogeneity for error of variance was done. The difference between treatment means was compared using DMRT at 5% probability levels. GENRES Version 7.01 [21] was employed for estimation of correlation between traits, phenotypic and genotypic correlation and path coefficient analysis.
The model for lattice design is:
Yil(j) = μ + ti + rj + (b|r)l(j) + eil(j)
Where, Yil(j) is the observation of the treatment i (i = 1, ..., v = k2), in the block l (l = 1, ..., k) of the replication j (j = 1, ..., m);μ is a constant common to all observations; ti is the effect of the treatment i;rj is the effect of the replication j;(b|r)l(j) is the effect of the block l of the replication j; eil(j) is the error associated to the observation Yil(j), where eil(j) ~ N(0, s), independent.
Phenotypic and genotypic correlation: Phenotypic correlation (the observation correlation between two variables, which includes both genotypic and environmental components between two variables) and genotypic correlation was computed following the method described in [22]:
Where, rp and rg are phenotypic and genotypic correlation coefficients, respectively; pcovx.y and g covx.y are phenotypic and genotypic, covariance between variables x and y, respectively;δ2px and δ2gx are phenotypic and genotypic, variances for variable x; and δ2py and δ2gy are phenotypic and genotypic variances for the variable y, respectively. The coefficients of correlation were tested using ‘r’ tabulated value at n-2 degrees of freedom, at 5% and 1% probability level, where n is the number of treatments (accessions).
Path coefficient analysis: Path coefficient analysis was computed as suggested by Dewey and Lu [14] using phenotypic as well as genotypic correlation coefficients as:
rij = Pij + Σrik * Pkj
Where, rij = mutual association between the independent character i (yield-related trait) and dependent character, j (grain yield) as measured by the genotypic correlation coefficients;
Pij = components of direct effects of the independent character (i) on the dependent character (j) as measured by the path coefficients; and Σrikpkj = summation of components of indirect effects of a given independent character (i) on a given dependent character (j) via all other independent characters (k). Whereas, the contribution of the remaining unknown characters is measured as the residual which is calculated as:
Results and Discussion
Analysis of variance
The analysis of variance for different characters at Atsbi, Ofla and Quiha locations is presented in Appendices 1-3, respectively. There were very highly significant differences (P< 0.001) among genotypes for all characters considered in all environments except for 1000 kernel weight in Quiha which was significant (p< 0.05) and plant height was non-significant at both Atsbi and Ofla locations.
The relative efficiency of the two designs showed that for most characters simple lattice design is not more efficient than complete randomized block design (RCBD) (Appendices 1-3). Results obtained from tests of homogeneity for error of variance showed the computed Chi-square test (x2) value exceeds the corresponding tabular (x2) value at 5% and 1% level of significance for all traits. Therefore, the hypothesis of homogeneous variance is rejected [23]. Therefore, the analysis of variance and other statistical analysis were run for the three locations separately.
Phenotypic and genotypic correlations
Yield is a very complex character. It is formed by the effect of numerous simple characters that are easily observed and that doesn’t change or change a little from one environment to another. If there is no significant correlation between the sample characters, then their effects on yield are direct and determined by applying path analysis method [24]. The analysis of the relationship among these characters and their association with yield is essential to establish selection criteria [25]. Therefore, understanding of the inheritance and interrelationships of grain yield and the magnitudes of genotypic and phenotypic correlations of grain yield and its components among yield related traits is highly crucial to utilize the existing variability through selection.
Phenotypic and genotypic correlations of grain yield with other traits
Phenotypic and genotypic correlations of yield and yield components are presented in Tables 2-4 for Atsbi, Ofla and Quiha environments, respectively. Generally, the estimates of genotypic correlation coefficients were higher than the corresponding phenotypic correlation coefficients for all the character combinations. It was observed that grain yield had a positive and significant (P<0.01) phenotypic and genotypic association with biological yield and 1000 kernel weight across location, whereas harvest index except at Ofla. In addition, only at Ofla environment grain yield had positive and significant (P<0.01) correlations with the number of productive tillers/m2 at phenotypic and genotypic levels. Therefore, any improvement of these characters would result in a substantial increment on grain yield. In harmony with this, Kole [26] reported that grain yield per plant had positive and significant correlations with tiller number, and 100 grain weight at both genotypic and phenotypic levels. Moreover, Kraljevic-Balalic [27] reported that biological yield was significantly and positively correlated with grain yield.
| DH | DM | PHT | SL | NK | PT | BY | TKW | HI | GEM | GYLD | |
|---|---|---|---|---|---|---|---|---|---|---|---|
| DH | 1.000 | 0.916** | -0.247 | -0.261* | 0.467** | -0.433** | -0.341** | -0.445** | 0.057 | 0.021 | -0.178 |
| DM | 0.9518** | 1.000 | -0.205 | -0.321* | 0.496** | -0.471** | -0.314* | -0.444** | 0.081 | 0.020 | -0.151 |
| PHT | -0.559** | -0.602** | 1.000 | 1.072 | -0.499** | 0.658** | 0.491** | 0.466** | -0.092 | -0.190 | 0.310* |
| SL | -0.233 | -0.297* | 0.528** | 1.000 | -0.444** | 0.227 | 0.110 | 0.102 | -0.371** | -0.118 | -0.094 |
| NK | 0.403** | 0.398** | -0.145 | -0.312* | 1.000 | -0.329** | 0.099 | -0.266* | 0.636** | 0.195 | 0.354** |
| PT | -0.385** | -0.297* | 0.368** | 0.375** | -0.482** | 1.000 | 0.485** | 0.419** | 0.039 | -0.322* | 0.321* |
| BY | -0.253* | -0.189 | 0.485** | 0.134 | 0.123 | 0.471** | 1.000 | 0.517** | 0.607** | -0.001 | 0.944** |
| TKW | -0.320* | -0.266* | 0.400** | 0.167 | -0.411** | 0.524** | 0.588** | 1.000 | 0.330** | -0.120 | 0.513** |
| HI | 0.067 | 0.119 | 0.037 | -0.269* | 0.605** | 0.126 | 0.516** | 0.294* | 1.000 | 0.160 | 0.836** |
| GEM | -0.090 | -0.092 | 0.042 | -0.013 | 0.129 | -0.065 | 0.143 | -0.109 | 0.176 | 1.000 | 0.064 |
| GYLD | -0.142 | -0.070 | 0.373** | -0.007 | 0.318* | 0.386** | 0.944** | 0.478** | 0.735** | 0.168 | 1.000 |
* and ** indicate significance at 0.05 and 0.01 probability levels, respectively. PHT=Plant height; DM=Days to maturity; DH=Days to heading; TKW=Thousand kernel weight; PT=Number of productive tillers per meter square area; SL=Spike length; NK=Number of kernels per spike; BY=Biological yield; HI= Harvest index; GEM=Germination test and GYLD=Grain Yield.
Table 2: Genotypic (above diagonal) and phenotypic correlation coefficients at Atsbi.
| DH | DM | PHT | SL | NK | PT | BY | TKW | HI | GEM | GYLD | |
|---|---|---|---|---|---|---|---|---|---|---|---|
| DH | 1.000 | 0.828** | 0.021 | -0.141 | 0.264* | -0.357** | -0.340** | -0.167 | -0.234 | -0.235 | -0.449** |
| DM | 0.972** | 1.000 | -0.031 | -0.203 | 0.313* | -0.436** | -0.474** | -0.303* | -0.225 | -0.337** | -0.601** |
| PHT | 0.310* | -0.107 | 1.000 | 0.362** | -0.325** | 0.312* | -0.173 | 0.143 | 0.119 | -0.372** | -0.238 |
| SL | -0.082 | -0.168 | 0.194 | 1.000 | -0.498** | 0.239 | 0.418** | 0.227 | 0.392** | -0.443** | 0.074 |
| NK | 0.199 | 0.268* | -0.165 | -0.454** | 1.000 | -0.667** | -0.705** | -0.565** | -0.203 | 0.470** | -0.352** |
| PT | -0.182 | -0.248* | 0.059 | 0.310* | -0.807** | 1.000 | 0.771** | 0.457** | 0.249 | -0.292* | 0.534** |
| BY | -0.124 | -0.158 | 0.143 | 0.240* | -0.400** | 0.646** | 1.000 | 0.560** | 0.345** | -0.112 | 0.829** |
| TKW | -0.119 | -0.178 | 0.195 | 0.334** | -0.655** | 0.616** | 0.715** | 1.000 | 0.138 | 0.033 | 0.649** |
| HI | -0.187 | -0.237 | -0.066 | -0.416 ** | 0.438** | -0.162 | 0.030 | 0.072 | 1.000 | -0.125 | 0.228 |
| GEM | -0.176 | -0.201 | 0.047 | 0.341** | -0.184 | 0.189 | 0.150 | 0.081 | -0.150 | 1.000 | 0.434** |
| GYLD | -0.188 | -0.234 | 0.119 | 0.060 | -0.200 | 0.518** | 0.925** | 0.542** | 0.385** | 0.084 | 1.000 |
* and ** indicate significance at 0.05 and 0.01 probability levels, respectively. PHT=Plant height; DM=Days to maturity; DH=Days to heading; TKW=Thousand kernel weight; PT=Number of productive tillers per meter square area; SL=Spike length; NK=Number of kernels per spike; BY=Biological yield; HI= Harvest index; GEM=Germination test and GYLD=Grain Yield.
Table 3: Genotypic (above diagonal) and phenotypic correlation coefficients at Ofla.
| DH | DM | PHT | SL | NK | PT | BY | TKW | HI | GEM | GYLD | |
|---|---|---|---|---|---|---|---|---|---|---|---|
| DH | 1.000 | 0.938** | -0.303* | -0.384** | 0.406** | -0.163 | -0.083 | -0.246 | -0.221 | -0.224 | -0.177 |
| DM | 0.966** | 1.000 | -0.352** | -0.461** | 0.498** | -0.314* | -0.212 | -0.260* | -0.182 | -0.253* | -0.190 |
| PHT | -0.381** | -0.476** | 1.000 | 0.734** | -0.702** | 0.740** | 0.895** | 0.603** | -0.018 | 0.564** | 0.491** |
| SL | -0.275* | -0.350** | 0.598** | 1.000 | -0.569** | 0.328** | 0.396** | 0.172 | -0.152 | 0.307* | 0.133 |
| NK | 0.395** | 0.454** | -0.453** | -0.388** | 1.000 | -0.476** | -0.556** | -0.331** | -0.022 | -0.234 | -0.285* |
| PT | -0.218 | -0.263* | 0.538** | 0.503** | -0.533** | 1.000 | 0.784** | 0.175 | 0.061 | 0.365** | 0.357** |
| BY | -0.133 | -0.156 | 0.655** | 0.371** | -0.363** | 0.500** | 1.000 | 0.353** | 0.049 | 0.365** | 0.694** |
| TKW | -0.131 | -0.129 | 0.300** | 0.138 | -0.709** | 0.487** | 0.974** | 1.000 | 0.382** | 0.587** | 0.819** |
| HI | -0.090 | -0.100 | -0.018 | -0.144 | -0.006 | 0.047 | 0.128 | 0.197 | 1.000 | 0.136 | 0.706** |
| GEM | -0.235 | -0.234 | 0.439** | 0.243 | -0.221 | 0.281* | 0.205 | 0.312* | 0.114 | 1.000 | 0.252* |
| GYLD | -0.144 | -0.156 | 0.411** | 0.157 | -0.221 | 0.308* | 0.727** | 0.404** | 0.732** | 0.228 | 1.000 |
* and ** indicate significance at 0.05 and 0.01 probability levels, respectively. PHT=Plant height; DM=Days to maturity; DH=Days to heading; TKW=Thousand kernel weight; PT=Number of productive tillers per meter square area; SL=Spike length; NK=Number of kernels per spike; BY=Biological yield; HI= Harvest index; GEM=Germination test and GYLD=Grain Yield.
Table 4: Genotypic (above diagonal) and phenotypic correlation coefficients at Quiha.
In addition, at Atsbi environment grain yield had a significant (P<0.01) and positive phenotypic correlation with plant height (r=0.373) and number of productive tillers/m2 (0.386) and at genotypic level number of kernels/spike (r=0.354). Similarly, at Quiha a grain yield showed positive and significant (P<0.01) phenotypic and genotypic association with plant height with correlation coefficients of (r=0.411) and (r=0.491) respectively.
On the other hand, at Ofla location grain yield had a negative and significant correlation (P<0.01) at the genotypic level with days to heading (r=-0.449) and days to maturity (r=-0.601). The negative correlations of grain yield with days to heading and maturity at Ofla indicated simultaneous improvement in these two traits and yield seems to be particularly difficult. However, in resource poor environment early maturing genotypes that are able to use existing resources efficiently and able to complete their life cycle within short period could escape the effect of terminal moisture stress and perform better than late maturing genotypes. Similarly, Bhutta [28] reported that grain yield was negatively correlated with days to heading.
Moreover, grain yield at Ofla and Quiha environments showed a significant and negative association with a number of kernels/spike at the genotypic level. The negative correlation of some important character as the number of kernels/spike with grain yield may lead to some undesirable selection depends on whether the negative association is due to linkage or pleiotropic effect. The negative associations of these character pairs were to impose problem in combining important yield components in one genotype. To improve yield components with negative association with other, suitable recombination may be obtained through bi parental mating, mutation breeding or diallel selective mating by breaking undesirable linkages. Similarly, Khan and Dar [29] reported that seed yield showed a significant negative association with number of seeds/ spikelet at genotypic level in wheat research.
Phenotypic and genotypic correlations among other characters
It was observed that, a positive and highly significant phenotypic and genotypic correlation between biological yield with number of productive tillers/m2 and 1000 kernel weight in all environments. Likewise, days to heading and maturity with number of kernels/spike exhibited a positive and highly significant phenotypic and genotypic correlation except at Ofla. However, a negative and highly significant phenotypic and genotypic correlation was found between number of kernels/spike and number of productive tillers/m2 and 1000 kernel weigh tin all environments. This indicated that for those traits which were positively associated the improvement for one trait will simultaneously improve the other. Whereas, those traits, which were negatively correlated the improvement for one trait will antagonistically affect the other. Traits like spike length and number of productive tillers/m2, plant height with days to heading had a significant phenotypic association but not genotypically correlated except at Quiha. Characters, which are phenotypically correlated but not genotypically, will not produce repeatable estimates of inter-character associations and any selection based on the relationship is likely to be unreliable [30].
Generally, for most characters studied at these three locations, the genotypic correlation coefficients were greater than the phenotypic correlation coefficients. This is similar with the finding of Bhutta [25] where it indicates a greater contribution of the genetic factor in association development. In addition, Ahadu [31] also reported that the magnitudes of genotypic correlation coefficients for most of the characters were higher than their corresponding phenotypic correlation coefficients, except a few cases, which indicate the presence of inherent or genetic association among various characters. From this study, it was suggested that high yielding population in barley may be selected by concentrating upon 1000-kernel weight, biological yield, and number of productive tillers/m2. Since the three traits are correlated among themselves, selection in one of the traits will implicitly result in the improvement of the other traits.
Path coefficient analysis
Correlation between yield and its components simply measures mutual relationships without presumption of causation [32] but the result of path coefficient analysis for grain yield and yield components can describe genotypic correlations to direct and indirect effects. Therefore, in this study, it is assumed that grain yield per plot was the end product of days to heading, days to maturity, plant height, 1000-kernel weight, number of productive tillers per m2, spike length and number of kernels/spike. Moreover, biological yield, harvest index and germination test were considered as yield components. The residual that represents other factors affecting grain yield but not included in this study was also considered.
Path coefficient analysis in Atsbi revealed that biological yield had the highest positive direct effect on grain yield (0.749) followed by harvest index (0.508). Genotypic correlations were also positive and significant (r=0.944 and 0.836), respectively. Similarly, at Quiha environment biological yield had the highest positive direct effect on grain yield (0.693) with a positive genotypic correlation coefficient of 0.694. In addition, harvest index had a positive direct effect on grain yield with a positive genotypic correlation coefficient of 0.706. Moreover, at Ofla location the highest positive direct effect was resulted from biological yield (0.846) with a positive genotypic correlation coefficient of 0.649. However, a negative direct effect was resulted from days to maturity (-0.407) with a negative (-0.601) genotypic correlation coefficient.
From this result, it was indicated that there is a true relationship between grain yield and biological yield across locations, and grain yield with harvest index at Atsbi and Quiha sites. In addition, a true association was observed between days to maturity and grain yield only in Ofla condition. Similarly, Madic [33] reported that a positive direct effect of harvest index of winter barley on grain yield (0.38).
On the other hand, number of productive tillers/m2 at Atsbi had a negative direct effect on grain yield (-0.042) with positive genotypic correlation coefficient of (0.321). Similarly, at Ofla, number of productive tillers/m2 had a negative direct effect on grain yield (-0.024) with positive genotypic correlation coefficient of (0.534). Moreover, at Quiha, number of productive tillers/m2 had a negative direct effect on grain yield (-0.323) with positive genotypic correlation coefficient of (0.357). The positive genotypic correlation was due to the indirect effect of biological yield with number of productive tillers/m2 across locations. This showed there was no true relationship between number of productive tillers/m2 and grain yield in all environments. This is in agreement with the findings of Khan and Dar, [29] where path coefficient analysis revealed that number of effective tillers exhibited negative direct effect (-0.170) on seed yield in wheat research. Maximum and positive indirect effect was exhibited by 1000 Kernel Weight through Biological yield (0.675) followed by Plant Height through Biological yield (0.621) and Number of Productive Tillers/m2 through Biological yield (0.543) at Quiha.
Residual effect in the present study was 0.03, 0.167 and 0.06 at Atsbi, Ofla and Quiha respectively (Tables 5-7). Which means the characters in the path analysis expressed the variability in grain yield by 96.4%, 83.3% and 93.1% and the remaining 3.6%, 16.7% and 6.9% needs additional characterization for the future breeding program at Atsbi, Ofla and Quiha, respectively. Similar result reported by Ali [34], Mollasadeghi [35].
| DH | DM | PHT | SL | NK | PT | BY | TKW | HI | GEM | rg | |
|---|---|---|---|---|---|---|---|---|---|---|---|
| DH | -0.199 | 0.222 | 0.041 | -0.023 | -0.052 | 0.018 | -0.255 | 0.041 | 0.029 | -0.001 | -0.178 |
| DM | -0.199 | 0.222 | 0.044 | -0.029 | -0.055 | 0.020 | -0.235 | 0.041 | 0.041 | -0.001 | -0.151 |
| PHT | 0.111 | -0.134 | -0.073 | 0.096 | 0.055 | 0.011 | 0.368 | -0.043 | -0.047 | 0.004 | 0.310* |
| SL | 0.052 | -0.071 | -0.079 | 0.089 | 0.049 | -0.016 | 0.082 | -0.015 | -0.188 | 0.003 | -0.094 |
| NK | -0.093 | 0.110 | 0.037 | -0.040 | -0.111 | 0.020 | 0.074 | 0.038 | 0.323 | -0.005 | 0.354** |
| PT | 0.086 | -0.104 | -0.048 | 0.033 | 0.053 | -0.042 | 0.364 | -0.048 | 0.020 | 0.008 | 0.321* |
| BY | 0.068 | -0.070 | -0.036 | 0.010 | -0.011 | -0.020 | 0.749 | -0.054 | 0.308 | 0.001 | 0.944** |
| TKW | 0.088 | -0.098 | -0.034 | 0.015 | 0.046 | -0.022 | 0.440 | -0.092 | 0.168 | 0.003 | 0.513** |
| HI | -0.011 | 0.018 | 0.007 | -0.033 | -0.071 | -0.002 | 0.454 | -0.030 | 0.508 | -0.004 | 0.836** |
| GEM | -0.004 | 0.005 | 0.014 | -0.011 | -0.022 | 0.013 | -0.001 | 0.011 | 0.081 | -0.023 | 0.064 |
Residual effect=0.0366
*, ** indicate significance at the 0.05 and 0.01 probability levels, respectively. PHT=Plant height; DM=Days to maturity; DH=Days to heading; TKW=1000-Kernel weight; PT=Number of productive tillers/m2; SL=Spike length; NK=Number of kernels/ spike; BY=Biological yield; HI=Harvest index and GEM=Germination test; rg=Genotypic correlation coefficients
Table 5: Path coefficients at genotypic level of direct (diagonal) and indirect effects of the characters studied at Atsbi.
| DH | DM | PHT | SL | NK | PT | BY | TKW | HI | GEM | rg | |
|---|---|---|---|---|---|---|---|---|---|---|---|
| DH | 0.283 | -0.395 | 0.006 | 0.022 | 0.029 | 0.008 | 0.288 | 0.015 | 0.009 | -0.077 | -0.449** |
| DM | 0.275 | -0.407 | 0.002 | 0.032 | 0.034 | 0.010 | 0.401 | -0.028 | 0.009 | 0.110 | -0.601** |
| PHT | 0.088 | 0.044 | -0.020 | 0.056 | 0.035 | -0.007 | 0.146 | 0.013 | 0.005 | 0.121 | -0.238 |
| SL | 0.040 | 0.083 | 0.007 | 0.155 | 0.054 | -0.007 | 0.354 | 0.031 | 0.015 | -0.144 | 0.074 |
| NK | 0.075 | -0.127 | 0.007 | 0.077 | 0.109 | 0.019 | -0.597 | 0.060 | 0.008 | 0.153 | -0.352** |
| PT | 0.101 | 0.177 | 0.006 | 0.048 | 0.088 | -0.024 | 0.653 | 0.057 | 0.009 | -0.095 | 0.534** |
| BY | 0.096 | 0.193 | 0.004 | 0.065 | 0.077 | -0.018 | 0.846 | 0.066 | 0.013 | 0.036 | 0.829** |
| TKW | 0.047 | 0.123 | 0.003 | 0.052 | 0.071 | -0.015 | 0.605 | 0.092 | 0.005 | 0.011 | 0.649** |
| HI | 0.066 | 0.092 | 0.002 | 0.061 | 0.022 | -0.006 | 0.292 | 0.013 | 0.038 | -0.049 | 0.228 |
| GEM | 0.066 | 0.137 | 0.008 | 0.069 | 0.051 | 0.007 | 0.095 | 0.003 | 0.006 | 0.326 | 0.434** |
Residual effect=0.1686
*, ** indicate significance at the 0.05 and 0.01 probability levels, respectively. PHT=Plant height; DM=Days to maturity; DH=Days to heading; TKW=1000-Kernel weight; PT=Number of productive tillers/m2; SL=Spike length; NK=Number of kernels/ spike; BY=Biological yield; HI=Harvest index and GEM=Germination test; rg=Genotypic correlation coefficients
Table 6: Path coefficients of direct (main diagonal) and indirect effects of the characters studied at Ofla.
| DH | DM | PHT | SL | NK | PT | BY | TKW | HI | GEM | rg | |
|---|---|---|---|---|---|---|---|---|---|---|---|
| DH | 0.004 | 0.001 | -0.023 | -0.103 | 0.128 | 0.053 | -0.057 | -0.077 | -0.142 | 0.041 | -0.177 |
| DM | 0.004 | 0.003 | -0.029 | -0.124 | 0.157 | 0.101 | -0.147 | -0.081 | -0.117 | 0.046 | -0.190 |
| PHT | -0.002 | -0.002 | 0.061 | 0.197 | -0.221 | -0.239 | 0.621 | 0.188 | -0.011 | -0.102 | 0.491** |
| SL | -0.002 | -0.001 | 0.045 | 0.268 | -0.179 | -0.163 | 0.274 | 0.043 | -0.098 | -0.056 | 0.133 |
| NK | 0.002 | 0.002 | -0.043 | -0.153 | 0.315 | 0.172 | -0.385 | -0.221 | -0.014 | 0.042 | -0.285* |
| PT | -0.001 | -0.001 | 0.045 | 0.135 | -0.168 | -0.323 | 0.543 | 0.152 | 0.039 | -0.066 | 0.357** |
| BY | -0.001 | -0.001 | 0.054 | 0.106 | -0.175 | -0.253 | 0.693 | 0.304 | 0.031 | -0.066 | 0.694** |
| TKW | -0.001 | -0.001 | 0.037 | 0.037 | -0.223 | -0.157 | 0.675 | 0.312 | 0.246 | -0.106 | 0.819** |
| HI | -0.001 | -0.001 | -0.001 | -0.041 | -0.007 | -0.020 | 0.034 | 0.119 | 0.643 | -0.021 | 0.706** |
| GEM | -0.001 | -0.001 | 0.034 | 0.082 | -0.074 | -0.118 | 0.253 | 0.183 | 0.073 | -0.181 | 0.252* |
Residual effect=0.0691
*, ** indicate significance at the 0.05 and 0.01 probability levels, respectively. PHT=Plant height; DM=Days to maturity; DH=Days to heading; TKW=1000-Kernel weight; PT=Number of productive tillers/m2; SL=Spike length; NK=Number of kernels/ spike; BY=Biological yield; HI=Harvest index and GEM=Germination test; rg=Genotypic correlation coefficients
Table 7: Path coefficients of direct (main diagonal) and indirect effects of the characters studied at Quiha.
Conclusion
It was observed that grain yield had a positive and significant (P<0.01) phenotypic and genotypic association with biological yield and 1000-kernel weight across location, whereas harvest index at Atsbi and Quiha and number of productive tillers/m2 at Ofla environment. On the other hand, at Ofla location grain yield had a negative and significant correlation (P<0.01) at the genotypic level with days to heading (r=-0.449) and days to maturity (r=-0.601). Generally, for most characters studied at these three locations, the genotypic correlation coefficients were greater than the phenotypic correlation coefficients. From this study, it was suggested that high yielding population might be selected by concentrating upon 1000-kernel weight, biological yield, harvest index and number of productive tillers/m2.
Genotypic correlation coefficients of various characters with grain yield were partitioned in to direct and indirect effects. Path coefficient analysis in Atsbi revealed that biological yield and harvest index show high and positive direct effect on grain yield at Atsbi and Quiha, while at Ofla location the highest positive direct effect was resulted from biological yield and days to maturity. On the other hand, number of productive tillers/m2 had a negative direct effect on grain yield across location.
Acknowledgements
The Authors would like to thank Ethiopian Agricultural Research Institute for funding the research and we also thank to all crop case team of Mekelle Agricultural Research Center.
References
- Zohary D, Hopf M(2000) Domestication of Plants in the Old World: The Origin and Spread of Cultivated Plants in West Asia, Europe, and the Nile Valley. 3rd edition. Oxford University Press: 59–69.
- Harlan JR(1969) Ethiopia: a center of diversity. Economic Botany 23: 309-314.
- Frost S(1974) Three chemical races in barley. Barley Genetics Newsletter 4: 25-28.
- Molina CJL, Russell JR, Moralejo MA, Escacena JL, Arias G,et al.(2005) Chloroplast DNA microsatellite analysis supports a polyphyletic origin for barley. Theoretical and Applied Genetics 110: 613-619.
- Reddy SR(2009) Agronomy of field crops. 3rd edition, Kalyani publishers. India, 169.
- Vavilov NI (1951)The origin, variation, immunity and breeding of cultivated plants. Chron Bot 13: 1-366.
- Bothmer, Von R, Seberg O, Jacobsen N(1992) Genetic resources in the Triticeae. Hereditas 116:141-150.
- Nilan RA, Ullrich SE(1993) Barley: Taxonomy, origin, distribution, production, genetics, and breeding. In: MacGregor A, BahattyRS (eds.) Barley: Chemistry and Technology. AACC. St.Paul, MI, pp: 1-29.
- Harlan JR (1968) On the origin of barley. In Barley: Origin, Botany, Cultivars, Winter Hardiness, Genetics, Utilization and Pests. USDA Agricultural Handbook 338: 9-34.
- Allard RW(1960) Principles of Plant Breeding. John Wiley and Sons, Inc. New York, pp: 48.
- Falconer DS, Mackay FCT(1996) Introduction to Quantitative Genetics. (4th edn.) Longman Group Ltd, England, 122-125.
- Roy D (2000) Plant Breeding Analysis and Exploitation of Variation. Narosa Publishing House. New Delhi, India.
- Akanda SI, Mundt CC (1996) Path coefficient analysis of the effects of strip rust and cultivar mixtures on yield and yield components of winter wheat. Theory and Applied Genetics 92: 666-672.
- Dewey DR, Lu KH (1959) A correlation and path coefficient analysis of components of crested wheat grass seed production. Agronomy Journal 51: 515-518.
- Giriraji K, Vijayakumar S(1974) Path coefficient analysis of yield attributes in mung bean. Ind J Genet 34: 27-30.
- Webb P, Braun JV(1994) Famine and Food Security in Ethiopia: Lessons for Africa. John Wiley and Sons Ltd. Chichetser, England.
- Solomon H (1999) Analysis of Irrigation Water Management Practices and Strategies in Betmera - Hiwane, Tigray, Ethiopia. An M. Sc. Thesis presented to the school of Wageningen Agricultural University. Netherlands.
- CoSAER (1994) Sustainable agriculture and environmental rehabilitation in Tigray. Commission for Sustainable Agricultural and Environmental Rehabilitation in Tigray: Basic Text. Mekelle, Tigray.
- NSIA (2001) Seed testing laboratory mannual. National Seed Industry Agency. Ethiopia, Addis Ababa, pp: 61-85.
- SAS Institute Inc (2008) Statistical analysis Software version 9.2, Cary, NC: SAS Institute Inc. USA.
- Pascal Institute Software solution(1994) GENRES, a statistical package for genetic researchers. Version 7.01.
- Singh RK, Chaundry BD(1985) Biometrical Methods in Quantitative Genetic Analysis. Kalayani Publishers, New Delhi-Ludhiana78: 318.
- Gomez KA, Gomez AA (1984) Statistical Procedures for Agricultural Research. 2nd (edn.) John Wiley and sons, Inc. New York,pp: 294-297, 467-469.
- Dogan R (2010) The correlation and path coefficient analysis for yield and some yield components of durum wheat (Triticum turgidum var. Durum l.) In west anatolia conditions. Pak J Bot 41: 1081-1089.
- Singh KB, Geletu B,Malhorta RS(1990) Associatition of some characters with seed yield in chick pea collection. Euphytica 49: 83-88.
- Kole PC (2006)Variability, Correlation and regression analysis in third somaclonal generation of barley. Barley Genetics Newsletter 36: 44-47.
- Kraljevic-Balalic M, Worland AJ, Porceddu E, Kuburovic M (2001) Variability and gene effects in wheat. In: Quarrie SI (eds.) Genetics and breeding of small grains, pp: 9-49.
- Bhutta WM,Tahira B, Ibrahim M (2005) Path-coefficient analysis of some quantitative characters in husked barley. Cadernode Pesquisa série Biologia 17: 65-70.
- Khan MH, Dar AN (2010)Â Correlation and path coefficient analysis of some quantitative traits in wheat. African Crop Science Journal 18: 9 - 14.
- Ariyo OJ, Aken’ova ME, Fatokun CA (1987) Plant character correlations and path analysis of pod yield in Okra (Abelmoschus esculentus). Euphytica 36: 677–686.
- AhaduMA (2008) Genetic variability and association of characters In sesame (Sesamum indicum L.) Genotypes. An M.Sc. Thesis presented to the school of Graduate Studies of Haramaya University.
- Puri YP,Qualset CO,Williams CA(1982) Evaluation of yield components as selection criteria in barley breeding. Crop Science 22: 927–931.
- Madic M, Paunovic A, Djurovic D, Knezevic D(2005) Correlations and “path†coefficient analysis for yield and yield components in winter barley. Acta Agriculturae Serbica 10: 3-9.
- Ali Y, Atta BM, Akhter J, Monneveux P, Lateef Z(2008) Genetic variability, association and diversity studies in wheat (Triticum aestivum L.) germplasm. Pak J Bot 40: 2087- 2097.
- Mollasadeghi V, Shahryari R(2011) Important morphological markers for improvement of yield in bread wheat. Advances Environ. Biol 5: 538–542.
Citation: Hailu A, Alamerew S, Nigussie M, Assefa E (2016) Correlation and Path Coefficient Analysis of Yield and Yield Associated Traits in Barley (Hordeum vulgare L.) Germplasm. Adv Crop Sci Tech 4:216. DOI: 10.4172/2329-8863.1000216
Copyright: © 2016 Hailu A, et al. This is an open-access article distributed under the terms of the Creative Commons Attribution License, which permits unrestricted use, distribution, and reproduction in any medium, provided the original author and source are credited.
Select your language of interest to view the total content in your interested language
Share This Article
Recommended Journals
Open Access Journals
Article Tools
Article Usage
- Total views: 16054
- [From(publication date): 4-2016 - Aug 29, 2025]
- Breakdown by view type
- HTML page views: 14634
- PDF downloads: 1420