Research Article Open Access
Quantitative Method for the Determination of Posaconazole in Mouse Tissues using Liquid Chromatography-Mass Spectrometry
Ibrahim El-Serafi1, Tommy Pettersson2, Ola Blennow3,4, Jonas Mattsson3,4, Erik Eliasson2, Anton Pohanka2, and Moustapha Hassan1,5*1Experimental Cancer Medicine (ECM), Clinical Research Centre (KFC), Department of Laboratory Medicine, Karolinska Institutet-Huddinge, Novum, Stockholm, Sweden
2Division of Clinical Pharmacology, Department of Laboratory Medicine, Karolinska Institutet and Karolinska University Hospital-Huddinge, Stockholm, Sweden
3Center for Allogeneic Stem Cell Transplantation, Karolinska Institute, Karolinska University Hospital, Huddinge, Sweden
4Department of Therapeutic Immunology, Karolinska Institute, Karolinska University Hospital, Huddinge, Sweden
5Clinical Research Center (KFC), Karolinska University Hospital-Huddinge, Novum, Stockholm, Sweden
- *Corresponding Author:
- Moustapha Hassan
Experimental Cancer Medicine(ECM)
Clinical Research Centre (KFC)
Department of Laboratory Medicine
Karolinska Institutet Huddinge
Novum, 141 86 Stockholm, Sweden
Tel: +46-8-585 838 62
Fax: +46-8-58583800
E-mail: Moustapha.hassan@ki.se
Received date: June 02, 2014; Accepted date: June 26, 2014; Published June 28, 2014
Citation: El-Serafi I, Pettersson T, Blennow O, Mattsson J, Eliasson E, et al. (2014) Quantitative Method for the Determination of Posaconazole in Mouse Tissues using Liquid Chromatography-Mass Spectrometry. J Anal Bioanal Tech 5:193 doi: 10.4172/2155-9872.1000193
Copyright: © 2014 El-Serafi I, et al. This is an open-access article distributed under the terms of the Creative Commons Attribution License, which permits unrestricted use, distribution, and reproduction in any medium, provided the original author and source are credited.
Visit for more related articles at Journal of Analytical & Bioanalytical Techniques
Abstract
Fast and selective liquid chromatography-mass spectrometry (LC-MS) method was developed for the quantification of posaconazole in different mouse organs including liver, heart, brain, kidney and lung. Organs were homogenized and diluted in isotonic NaCl solution. Protein was precipitated using acetonitrile containing internal standard and analyzed. The analysis was carried out using gradient condition with mobile phases consisting of aqueous formic acid and pure acetonitrile. Analysis was run at a flow-rate of 0.51 mL/min. The method was selective with a limit of quantification of 0.5 μg/mL in homogenate at a sample volume of 100 μL. The standard curve was linear over a concentration range of 0.5-10 μg/mL for all organs. The inter-day and intra-day coefficient of variation values were all less than 15%. Hence, the method is suitable for use in pharmacokinetic and bioavailability studies of posaconazole in tissues.
Keywords
Mass spectrometry; Posaconazole; Tissue distribution; Pharmacokinetics; Liquid chromatography
Introduction
Posaconazole is a highly lipophilic drug. It is one of the more recent triazole antifungals critical in the treatment of invasive mycoses [1]. It disturbs fungi growth by inhibiting cytochrome P450 lanosterol 14α-demethylase (CYP51A1) that leads to blockage of ergosterol synthesis in the fungal cell membranes. The end result of this reaction is the increase of fungi cell membrane permeability and cessation of cell growth and replication [2,3]. Posaconazole is active against several organisms including Candida spp, zygomycota and Aspergillus spp [4,5].
Posaconazole is orally bioavailable and reaches plasma maximum concentration by 10 hours post dose, meaning that its elimination is rather slow and the mean of its half-life is 20 hours [6]. Similar to previous triazoles, posaconazole inhibits CYP3A4; however, the risk of drug-drug interaction is still considered to be lower compared to earlier drugs, partially because posaconazole elimination by CYP-pathways is very limited [6]. Posaconazole is excreted in the feces (76.9%), mainly as unchanged drug, or excreted in urine (14%) as conjugated drug or unchanged [6]. In vitro studies have shown that posaconazole is conjugated with UDP-glucuronosyltransferase 1A4 (UGT1A4) to form posaconazole glucuronide [7].
Several studies were reported to detect posaconazole in human plasma using high performance liquid chromatography (HPLC) especially in patients with hematological diseases [8,9]. Furthermore; liquid chromatography-mass spectrometry (LC-MS) was also utilized for the measurement of posaconazole plasma concentration in order to investigate its pharmacokinetics [10-12]. All these reported methods didn’t analyze posaconazole in different tissues and were not validated to be used in different organs. Applying any of these methods for measuring posaconazole in tissues need further validation for each tissue.
Much less is known about the distribution of posaconazole into different tissues. However, this unresolved issue needs to be addressed in order to better understand the optimal dose regimens for different loci. In the present study we utilized LC-MS as a simple, fast and quantitative method for the detection of posaconazole from posaconazole-spiked mouse tissues, which could be employed as a model to evaluate the extraction and analyses of tissue concentrations. The present method showed high extraction yield and good reproducibility and can thus be used to determine posaconazole in tissue from animals and patients in order to determine organ toxicity.
Materials and Methods
Chemicals and reagents
We used posaconazole (no 2976, Schering-Plough, Kirkland, Canada) and UK-115794 (Janssen, Buckinghamshire, UK) as an internal standard (I.S.), both of high purity (>99%).
All solvents were of analytical grade with purity (>99%): methanol, acetonitrile and formic acid (Merck, Darmstadt, Germany).
Water was purified using the Milli-Q System from Millipore (Milford, MA, USA).
Tissues samples from brain, heart, liver, lung and kidney were obtained from C57BL/6N mice at the age of 8-10 weeks (Charles River, Sulzfeld, Germany). All animal experiments were approved by the Stockholm Southern Ethical Committee on Animal Research and performed in accordance with Swedish Animal Welfare Law.
Instrument
The LC-MS system consisted of an Agilent 1100 MSD (Santa Clara, CA, USA) equipped with an Agilent 1100 LC system (Santa Clara, CA, USA). The reversed-phase column used was Phenomenex Kinetex C18 (2.6 μm particle size, 50 mm length, 0.21 mm ID, Torrance, CA, USA).
Standard solutions
Stock solutions of posaconazole and I.S. were prepared in methanol (500 μg/mL and 1000 μg/mL, respectively) and stored at -20°C. A working I.S. solution was prepared at a concentration of 150 ng/mL in 0.1% formic acid in acetonitrile and was kept at +6°C until sample preparation.
Standard curve and quality control samples
A serial dilution technique was employed to obtain the final standard concentration in the range of 0.48-10.07 μg/mL for all organs except heart and lungs (0.51-10.14 μg/mL). Calibration curves were prepared daily. Quality control samples at two levels were also prepared daily from independently prepared stock solutions in mouse tissues.
Sample preparation
Pre-weighted mouse organs including liver, heart, brain, kidney and lung were placed in 0.9% NaCl and homogenized by probe sonication for up to 5 minutes depending on the tissue type. After sonication, NaCl volume was adjusted to 1:6 w:v, except for the heart which was adjusted to 1:10 w:v. Posaconazole was added at different concentrations for standard curves and quality controls (QCs).
Extraction procedure
Acetonitrile containing internal standard (200 μL) was added to 100 μL of homogenate/sample in a 2 mL glass HPLC vial and then vortexed for at least 20 seconds. After centrifugation at 2000 × g for 5 minutes at ambient temperature (room temperature), 1 μL aliquot of supernatant was injected onto the Agilent LC-MS system.
Instrumental condition
Chromatography was performed at 40°C at a flow-rate of 0.51 mL/ min using a gradient condition. The mobile phases consisted of 25 mM formic acid as solvent A and 100% acetonitrile as solvent B. The analysis was run in a gradient with an initial flow of 30% B for 4 min increased to 75% B, then decreased to 30% B for 1.5 min, making a total run of 5.5 min.
Mass spectrometry
Mass spectrometry was operated in SIM using electrospray ionization in positive mode at the following ions: m/z 351 for posaconazole and m/z 348 for the internal standard. The gas temperature was set at 300°C, drying gas flow at 10 L/min, nebulizer pressure at 25 psi and voltage cap at 3500 V.
Validation
The protocol described by Shah et al. [13,14] was employed for method validation. Linearity was determined through two quality controls (QCs) including blanks for each tissue. Results were taken from inter-day precision for 5 organs. Standard and control were calculated separately against the calibration curve from the same tissue. The quantification analysis was based on the ratio peak height analyte/ peak height I.S. and equal weighting in a linear regression analysis equation
Low and high quality controls were run five times in pentaplicate in each tissue and quantitated by standard curves in the same matrix to evaluate the intra-day precision and the inter-day precision in each tissue. Each run also included blank samples for all tissues to detect interfering substances. Limit of detection (LOD) was theoretically calculated through signal to noise ratio (S/N). Stability of the analyte stock solution in methanol and working solution in plasma was established at different time points and temperatures.
Extraction recovery, matrix effect, and process efficiency were investigated for each organ at one concentration level. Posaconazole was added A) before protein precipitation, B) after protein precipitation and in C) initial mobile phase composition. Analyte peak area ratio of A/B corresponded to extraction recovery, B/C to matrix effect, and A/C to process efficiency [15].
Analytical data treatment
Chromatograms and all the quantitative results were measured using Agilent LC/MSD ChemStation software Rev. B.04.02.SP (Santa Clara, CA) while the statistical results were obtained using ANOVA (version 6.84, licensed to ACB, Dr. Anders Kallner, Dept. of Clinical Chemistry, Karolinska University Hospital, Sweden, qmtoolbox@ gmail.com).
Results and Discussion
Specificity
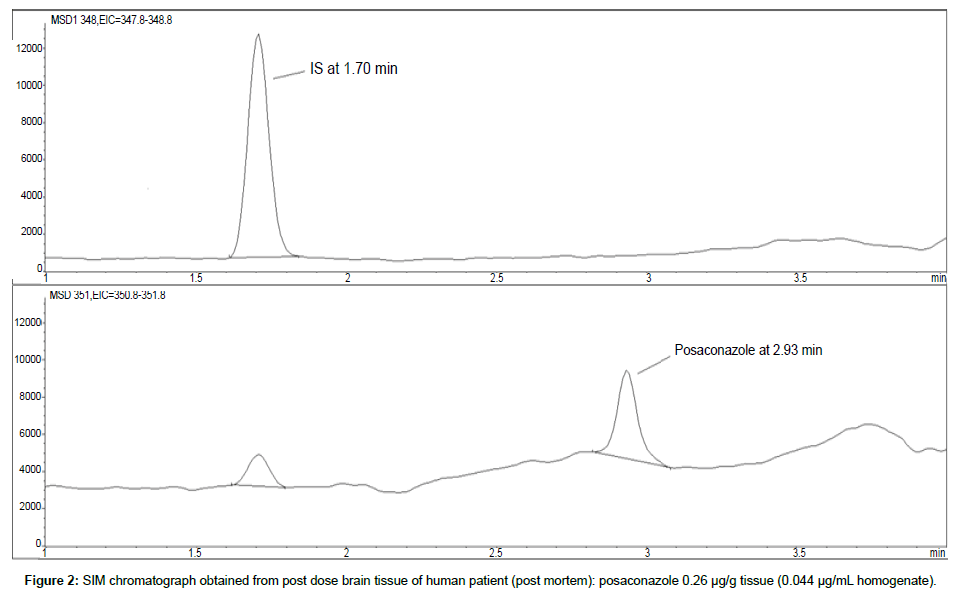
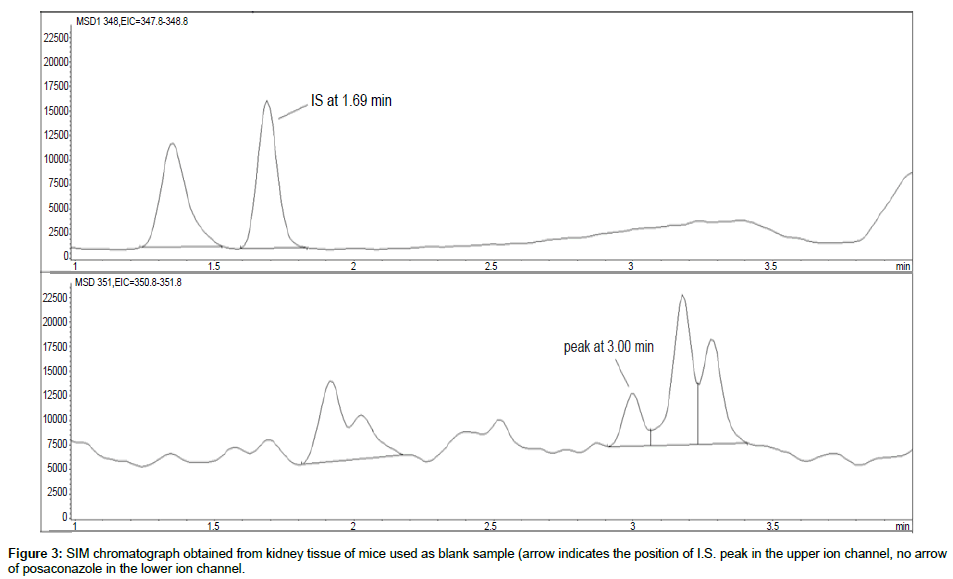
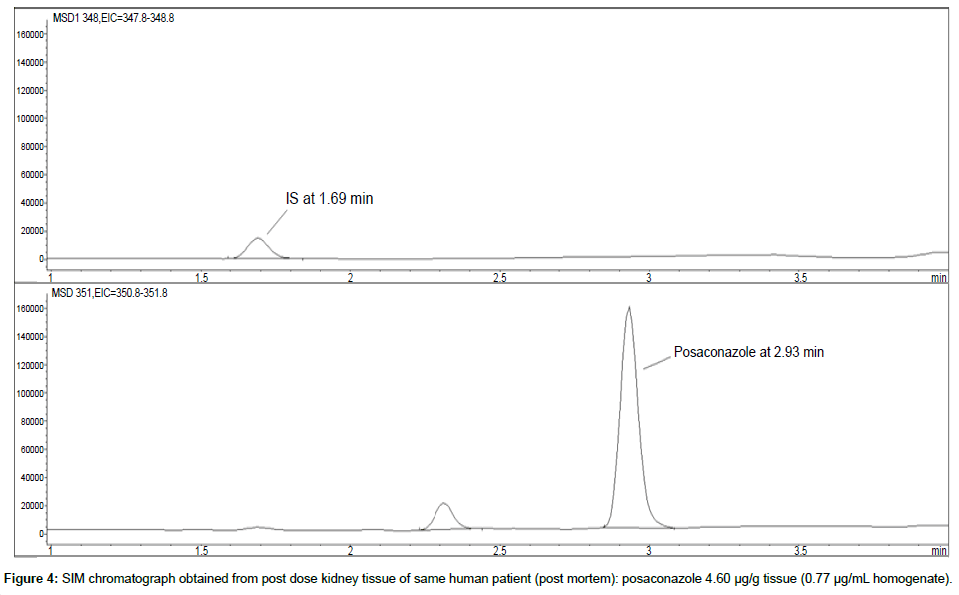
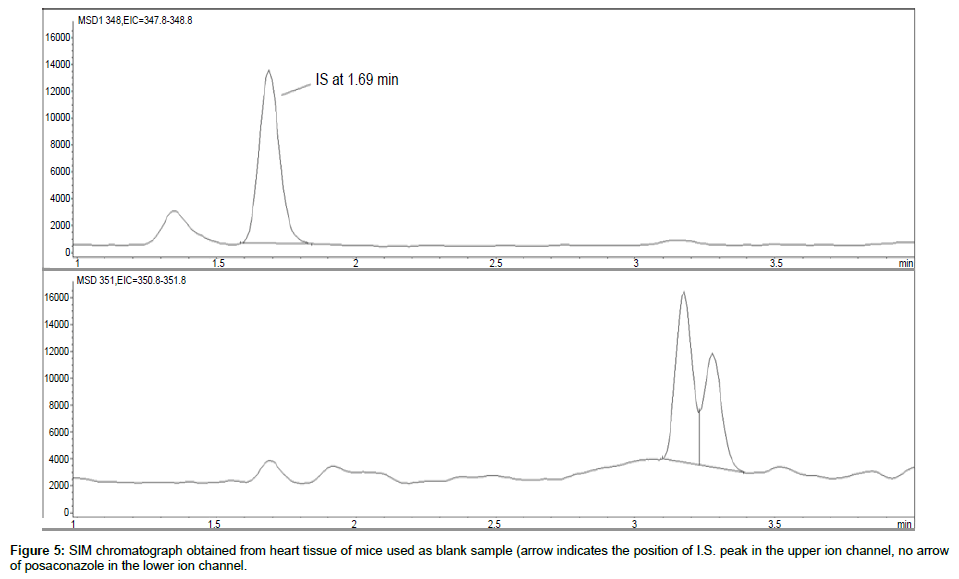
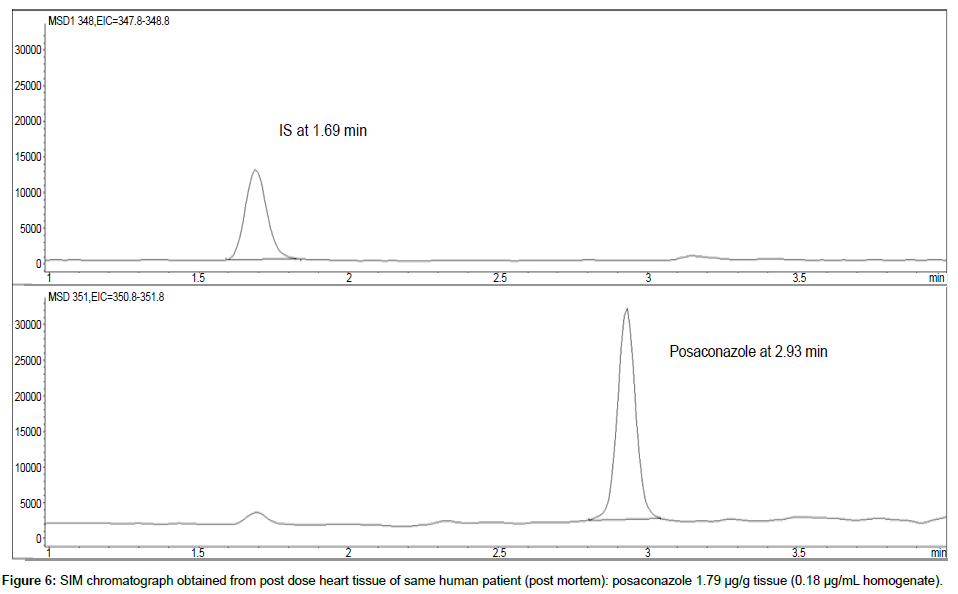
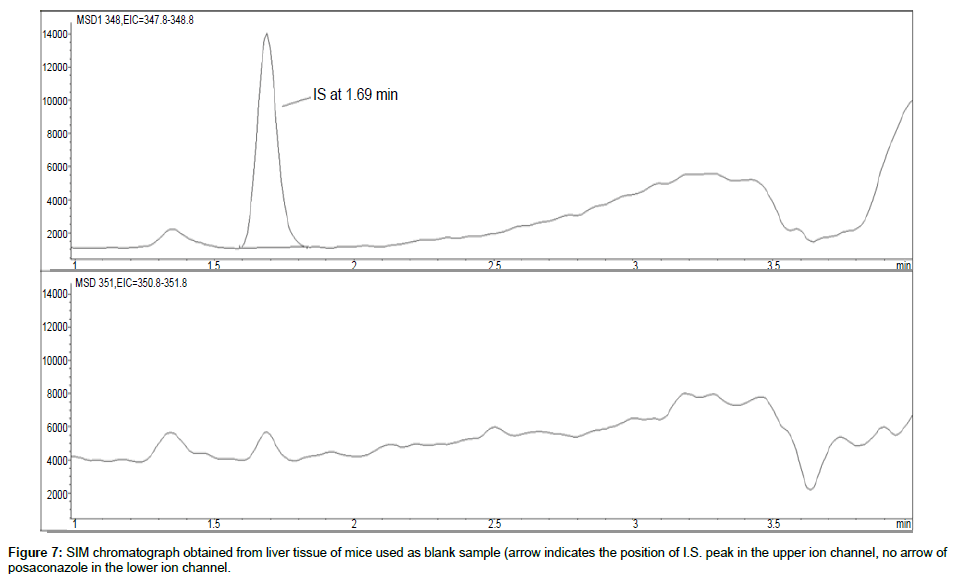
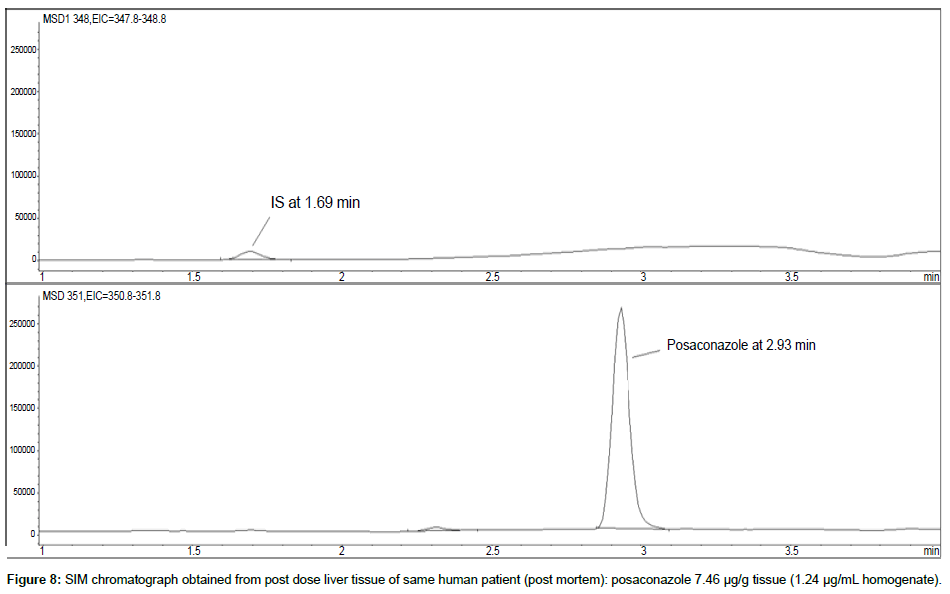
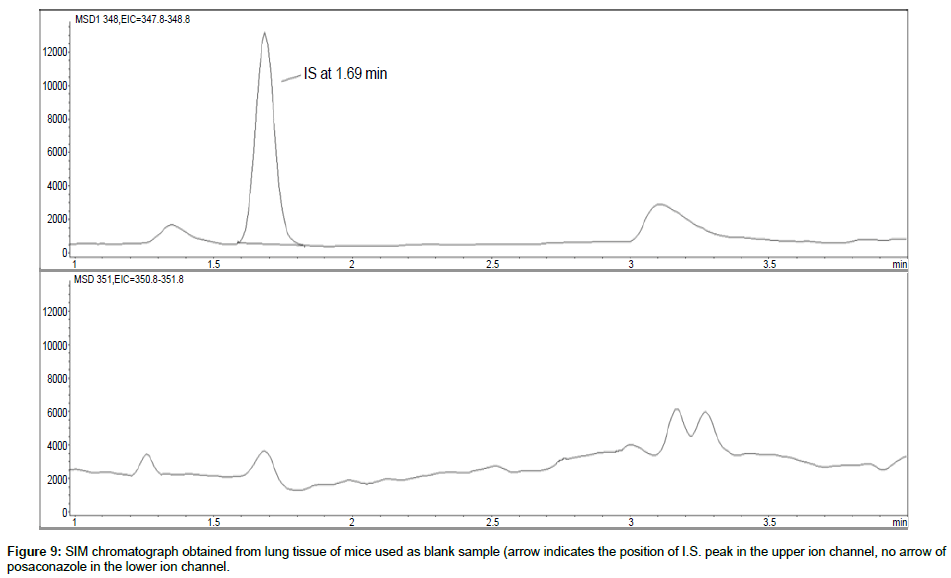
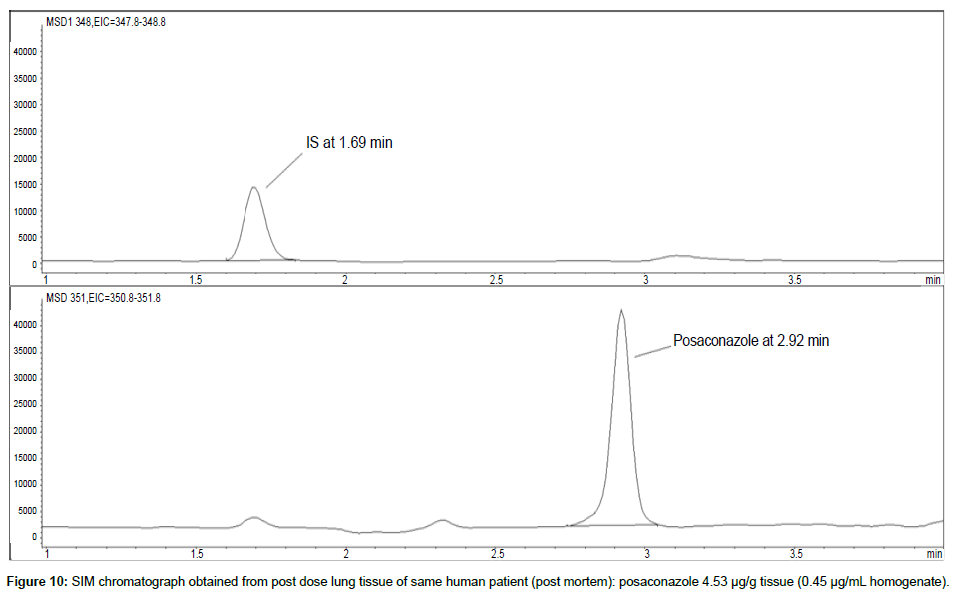
Representative SIM chromatographs of selected tissues obtained from post dose human patient (post mortem) and blank mouse tissue are presented in Figures 1-10. No significant interfering peaks were detected at the retention times of the peaks of interest, neither as well as nor in the ion channel, in the post dose sample. The retention times for posaconazole and I.S. were 2.9 min and 1.7 min, respectively.
Sensitivity and selectivity
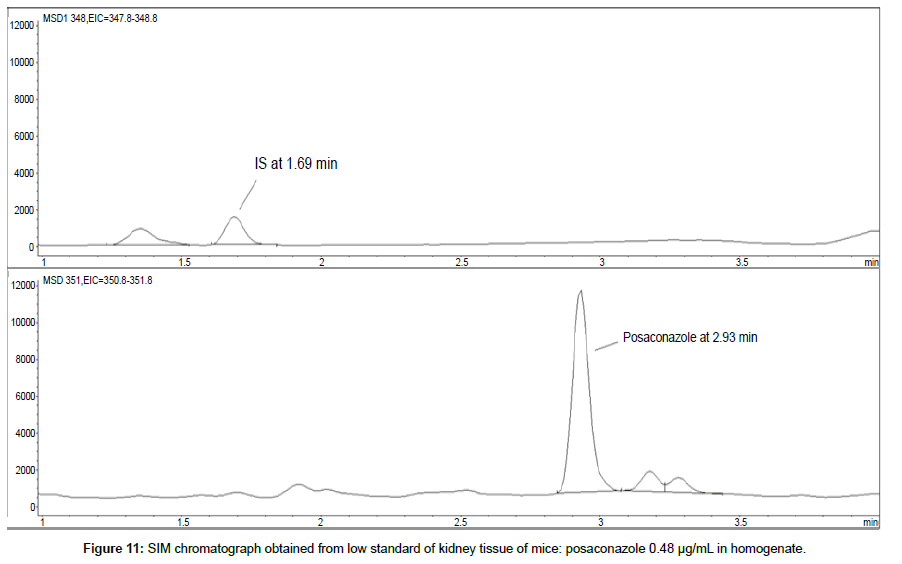
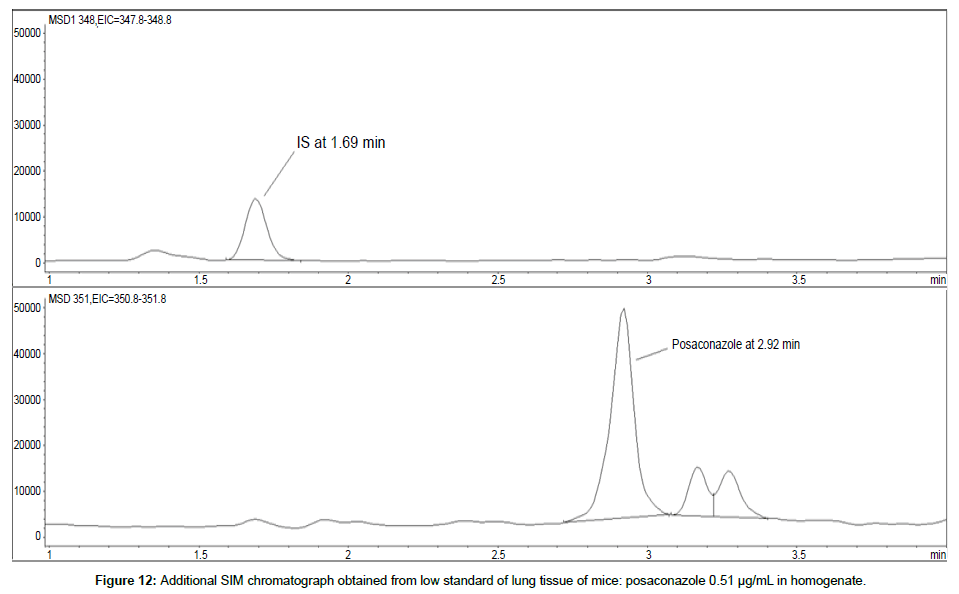
LOD was calculated as 3 times S/N, i.e. approximately 500 mAU (Table 1), where the S/N was approximately 166 mAU according to base line. The lower limit of quantification (LLOQ) was 0.48 μg/mL for all organs, except the heart and lungs, where it was 0.51 μg/mL (Figures 11 and 12).
| Tissue | St low concentr | Measures height, mAU | Theoretical LOD concentration |
|---|---|---|---|
| Brain | 0.48 mg/L | 58000 | 0.004 µg/mL |
| Liver | 0.48 mg/L | 45000 | 0.005 µg/mL |
| Kidney | 0.48 mg/L | 75000 | 0.003 µg/mL |
| Heart | 0.51 mg/L | 36000 | 0.007 µg/mL |
| Lung | 0.51 mg/L | 20000 | 0.013 µg/mL |
Table 1: LOD was calculated as 3 times S/N, i.e. approximately 500 mAU.
| Standard nominal value (µg/mL) | Standard measured value (µg/mL) | Accuracy % | |
|---|---|---|---|
| Brain | 0 | 0 | 100.0 |
| 0.48 | 0.44 | 91.7 | |
| 2.42 | 2.36 | 97.5 | |
| 10.07 | 10.09 | 100.2 | |
| Liver | 0 | 0 | 100.0 |
| 0.48 | 0.55 | 114.6 | |
| 2.42 | 2.30 | 95.0 | |
| 10.07 | 10.10 | 100.3 | |
| Kidney | 0 | 0 | 100.0 |
| 0.48 | 0.48 | 100.0 | |
| 2.42 | 2.39 | 98.8 | |
| 10.07 | 10.08 | 100.1 | |
| Heart | 0 | 0 | 100.0 |
| 0.51 | 0.35 | 68.8 | |
| 2.54 | 2.75 | 108.3 | |
| 10.14 | 10.10 | 99.0 | |
| Lung | 0 | 0 | 100.0 |
| 0.51 | 0.52 | 102.0 | |
| 2.54 | 2.52 | 99.2 | |
| 10.14 | 10.14 | 100.0 |
Table 2: Accuracy and precision for the 5 organs were established from the analysis of standard curves and QCs (n=5).
No quantifiable carry over effect in any tissue homogenate was found in blank samples after injection of approximately 10 μg/mL posaconazole; however, a larger injection volume will affect the symmetrical form of a chromatogram.
Accuracy and precision
Accuracy and precision for the 5 organs were established from the analysis of standard curves and QCs (Table 2). The standard curve was lineal over the concentration range 0.5-10 μg/mL for all organs. The average slope for every organ was 1.010 (1.004 – 1.022) while the average correlation for every organ was 0.997 (0.992 – 0.999).
The precision and accuracy were determined for all five organs in pentaplicate for intra-day and inter-day variations. The QC results showed a standard deviation <15% for all values obtained, including low and high QCs, compared to the nominal values (Tables 3 and 4).
| Number of samples | Average value (µg/mL) | SD | CV% | Accuracy (%) | ||
|---|---|---|---|---|---|---|
| Brain | Low | 5 × 5 | 1.07 | 0.03 | 3.27 | 101.45 |
| High | 5 × 5 | 8.00 | 0.26 | 4.45 | 98.94 | |
| Liver | Low | 5 × 5 | 1.12 | 0.08 | 7.32 | 106.48 |
| High | 5 × 5 | 5.17 | 0.19 | 5.03 | 103.66 | |
| Kidney | Low | 5 × 5 | 1.12 | 0.03 | 2.90 | 106.46 |
| High | 5 × 5 | 6.52 | 0.18 | 2.68 | 107.60 | |
| Heart | Low | 5 × 5 | 0.88 | 0.04 | 4.37 | 87.14 |
| High | 5 × 5 | 7.17 | 0.37 | 5.35 | 113.20 | |
| Lung | Low | 5 × 5 | 0.70 | 0.04 | 5.91 | 69.12 |
| High | 5 × 5 | 5.11 | 0.30 | 6.36 | 90.25 |
Table 3: Precision and accuracy for all five organs in pentaplicate for the intraday variations. The QC results showed a standard deviation <15% for all values obtained compared to the nominal values.
| Control | Nominal value (µg/mL) | Average value (µg/mL) | SD | CV % | Accuracy (%) | |
|---|---|---|---|---|---|---|
| Brain | Low | 1.05 | 1.06 | 0.05 | 4.91 | 101.0 |
| High | 6.06 | 6.00 | 0.37 | 6.10 | 99.0 | |
| Liver | Low | 1.05 | 1.13 | 0.12 | 10.64 | 107.6 |
| High | 6.06 | 6.42 | 0.31 | 5.54 | 106.0 | |
| Kidney | Low | 1.05 | 1.12 | 0.05 | 4.66 | 106.7 |
| High | 6.06 | 6.52 | 0.32 | 4.91 | 107.6 | |
| Heart | Low | 1.01 | 0.88 | 0.06 | 7.09 | 87.1 |
| High | 6.33 | 7.17 | 0.50 | 7.01 | 113.3 | |
| Lung | Low | 1.01 | 0.62 | 0.07 | 11.73 | 61.4 |
| High | 6.33 | 5.97 | 0.41 | 6.90 | 94.3 |
Table 4: Precision and accuracy for all five organs in pentaplicate for the interday variations. The QC results showed a standard deviation <15% for all values obtained compared to the nominal values.
Sample stability
Stock solution in methanol solution was stable for 12 months at -20°C. Moreover, working solution in plasma was also stable for 12 months at -20°C.
A high control of plasma was exposed to normal light at room temperature for 24 and 48 hours respectively and analyzed in triplicate; the recovery was calculated to 101.4% at 24 h and 101.9% at 48 h showing no sign of degradation.
Extraction recovery
Matrix effects were determined in triplicate at one level by analyzing supernatant from 5 different tissues spiked with posaconazole against a solution of 40% acetonitrile in aqueous 25 mM formic acid spiked with posaconazole. All organs had almost the same effect (98-102%) indicating minimal interference from the matrix effect in the samples (Table 5).
| Organ | Matrix effect | Recovery | Process Efficiency |
|---|---|---|---|
| Brain | 98% | 112% | 111% |
| Heart | 101% | 105% | 106% |
| Liver | 99% | 110% | 109% |
| Lung | 102% | 99% | 101% |
| Kidney | 102% | 107% | 109% |
| Human plasma | 98% | 114% | 112% |
Table 5: Matrix effect, recovery and process efficiency for all five organs (n=3).
Recovery of the analyte was determined in triplicate at one level by analyzing blank biological fluids from 5 different tissues spiked with posaconazole against supernatant by the same fluids spiked with posaconazole. All organs had good recovery (99-114%) compared to the unextracted analytes (Table 5).
Process efficiency was determined in triplicate at one level by analyzing blank biological fluids from 5 different tissues spiked with posaconazole against a solution of 40% acetonitrile in aqueous 25 mM formic acid spiked posaconazole. Results showed high efficiency in all organs (101-112%) (Table 5).
Conclusion
We developed and validated a sensitive LC-MS procedure with selective ion monitoring by single quadrupole mass spectrometer for the determination of posaconazole in different tissues. The reported method offers several advantages such as a rapid and simple extraction scheme, improved sensitivity, short chromatography run time, and the ability to work with very small homogenate sample volume. This makes the method suitable for use in settings where normal doses are administered, and/or where there are limitations to the amount of tissue that can be collected.
During the method development, some degradation was observed when spiked standard samples and QCs samples were stored in homogenate for a long time in the freezer (-20°C). This might cause complications, and therefore the standard samples and quality controls have been prepared daily in order to avoid degradation.
We managed to measure up to approximately 10 μg/mL posaconazole using LC-MS with consistent linearity in calibration. ¼ of the sample should be diluted with ¾ blank tissues. Substances showed good stability for up to 48 hours in room temperature.
Posaconazole is known for its organ toxicity in clinical situations, and the present method is simple, robust and reliable. It can be easily adapted to determine tissue concentrations of posaconazole.
Acknowledgements
We wish to acknowledge grant support from the Swedish Cancer Society and the Swedish Childhood Cancer Foundation.
References
- Schiller DS, Fung HB (2007) Posaconazole: an extended-spectrum triazole antifungal agent. Clin Ther 29: 1862-1886.
- Groll AH, Walsh TJ (2005) Posaconazole: clinical pharmacology and potential for management of fungal infections. Expert Rev Anti Infect Ther 3: 467-487.
- Groll AH, Piscitelli SC, Walsh TJ (1998) Clinical pharmacology of systemic antifungal agents: a comprehensive review of agents in clinical use, current investigational compounds, and putative targets for antifungal drug development. Adv Pharmacol 44: 343-500.
- Cacciapuoti A, Loebenberg D, Corcoran E, Menzel F Jr, Moss EL Jr, et al. (2000) In vitro and in vivo activities of SCH 56592 (posaconazole), a new triazole antifungal agent, against Aspergillus and Candida. Antimicrob Agents Chemother 44: 2017-2022.
- Munayyer HK, Mann PA, Chau AS, Yarosh-Tomaine T, Greene JR, et al. (2004) Posaconazole is a potent inhibitor of sterol 14alpha-demethylation in yeasts and molds. Antimicrob Agents Chemother 48: 3690-3696.
- Krieter P, Flannery B, Musick T, Gohdes M, Martinho M, et al. (2004) Disposition of posaconazole following single-dose oral administration in healthy subjects. Antimicrob Agents Chemother 48: 3543-3551.
- Ghosal A, Hapangama N, Yuan Y, Achanfuo-Yeboah J, Iannucci R, et al. (2004) Identification of human UDP-glucuronosyltransferase enzyme(s) responsible for the glucuronidation of posaconazole (Noxafil). Drug Metab Dispos 32: 267-271.
- Cendejas-Bueno E, Forastiero A, Rodriguez-Tudela JL, Cuenca-Estrella M, Gomez-Lopez A (2012) HPLC/UV or bioassay: two valid methods for posaconazole quantification in human serum samples. Clin Microbiol Infect 18: 1229-1235.
- Müller C, Arndt M, Queckenberg C, Cornely OA, Theisohn M (2006) HPLC analysis of the antifungal agent posaconazole in patients with haematological diseases. Mycoses 49 Suppl 1: 17-22.
- Xu HR (2013) Liquid chromatography-mass spectrometry method for the quantification of posaconazole in human plasma: application to pharmacokinetics following single-dose administration in the fasted state and with a high-fat meal. Pharmazie 68: 173-177.
- Cunliffe JM1, Noren CF, Hayes RN, Clement RP, Shen JX (2009) A high-throughput LC-MS/MS method for the quantitation of posaconazole in human plasma: Implementing fused core silica liquid chromatography. J Pharm Biomed Anal 50: 46-52.
- Shen JX1, Krishna G, Hayes RN (2007) A sensitive liquid chromatography and mass spectrometry method for the determination of posaconazole in human plasma. J Pharm Biomed Anal 43: 228-236.
- Shah VP (1991) Analytical methods validation: bioavailability, bioequivalence and pharmacokinetic studies. Conference report. Eur J Drug Metab Pharmacokinet 16: 249-255.
- Shah VP, Midha KK, Findlay JW, Hill HM, Hulse JD, et al. (2000) Bioanalytical method validation--a revisit with a decade of progress. Pharm Res 17: 1551-1557.
- Marchi I, Viette V, Badoud F, Fathi M, Saugy M, et al. (2010) Characterization and classification of matrix effects in biological samples analyses. J Chromatogr A 1217: 4071-4078.
Relevant Topics
Recommended Journals
Article Tools
Article Usage
- Total views: 15635
- [From(publication date):
July-2014 - Jul 12, 2025] - Breakdown by view type
- HTML page views : 10941
- PDF downloads : 4694


