Determination of Some Component Equilibrium-Constants by Cd(II) Picrate Extraction with Benzo-18-crown-6 Ether into Various Diluents and their Evaluation
Received: 18-Dec-2017 / Accepted Date: 26-Dec-2017 / Published Date: 30-Dec-2017 DOI: 10.4172/2155-9872.1000391
Abstract
Using benzo-18-crown-6 ether (B18C6), extraction experiments of cadmium picrate (CdPic2) into various diluents were performed at 298 K. Thereby, three kinds of extraction constants, KCd/CdL, Kex± and Kex, four kinds of distribution constants, KD,j (=[j]org/[j]), with j=Pic−, CdLPic2, CdLPic+ and CdL2+ and two kinds of ion-pair formation constants, K1,org {=Kex±/KCd/CdL(KD,Pic)2} and K2,org (=Kex/Kex±), for L=B18C6 were determined. Here, KCd/CdL, Kex± and Kex were defined as [CdL2+]org/[Cd2+][L]org, [CdLPic+]org[Pic−]org/P and [CdLPic2]org/P, respectively, with P=[Cd2+][L]org[Pic−]2 and the subscript “org” denotes an organic phase. Based on these equilibrium constants, distribution properties of the species j between the water (w) and org phases and reactivity of CdL2+ or CdLPic+ in the org phases were compared. Additionally, some Pb2+ selectivity coefficients, kpotPbCd(=KCd/CdL/KPb/PbL), against Cd2+ with L=18-crown-6 ether at the nitrobenzene/w, 1,2-dichloroethane/w, o-dichlorobenzene/w and dichloromethane/w interfaces.
Keywords: Conditional distribution constants; Ion-pair formation constants in organic phases; Distribution equilibrium-potential differences; Extraction constants; Potentiometric selectivity coefficients; Cadmium picrate; Benzo-18-crown-6 ether
Introduction
Crown compounds (L), such as 18-crown-6 ether (18C6) and benzo-18C6 (B18C6), have extracted Cd2+ and Pb2+ (= M2+) with Cl−, Br− and picrate ion (Pic−) into various diluents [1-6]. In such M2+ extraction systems with L, four component equilibrium-constants, KD,A, KD,MLA, KD,MLA2 and K2,org, have been determined so far [1-5]. Here,the symbols, KD,A, KD,MLA, KD,MLA2 and K2,org, refer to the conditional distribution constant (=[A−]org/[A−]) of A− (=Cl−, Br− and Pic−), that (=[MLA+]org/[MLA+]) of MLA+ with the distribution equilibrium-potential difference (dep; φeq as its symbol employed for equations), the distribution constant (=[MLA2]org/[MLA2]) of MLA2 with dep=0 V into an organic (org) phase or diluent and the ion-pair formation one {=[MLA2]org/[MLA+]org[A−]org, see Eq. (4)} for MLA2 in the org phase, respectively [1-5]. Recently, the approximate determination method for the 5th component equilibrium-constant, that is K1,org=[MLA+] org/[ML2+]org[A−]org {see Eq. (9)}, was developed [6,7]. So, these five-component equilibrium-constants let us expect an evaluation of general characteristics for the above overall extraction-systems.
In order to evaluate the possibility as the method studying such extraction systems, we examined the present extraction experiments of CdPic2 with B18C6 by using various diluents, as which nitrobenzene (NB), 1,2-dichloroethane (DCE), o-dichlorobenzene (oDCBz), dichloromethane (DCM), chlorobutane (CBu), chlorobenzene (CBz), bromobenzene (BBz), chloroform (CF), dibutylether (DBE), toluene (TE) and m-xylene (mX) were used. These diluents were selected as the group of the high polarity, NB, that of the medium one, DCE to BBz, and that of the low one, CF to mX with benzene (Bz). In course of such evaluations, the K1,org values were determined more precisely than those [6] reported previously and also comparisons among the KD,Pic, KD,CdLPic2, KD,CdLPic and KD,CdL values were performed. In addition to the above evaluations, standard distribution constants (KD,jS) of j=Pic−, CdLPic+and CdL2+into the NB, DCE, oDCBz and DCM phasesunder the condition of dep=0 V were calculated from their conditional distribution constants, KD,j, with dep [6,7]. Besides, the regular-solution theory (RST) plot [3-6,8] based on the data of the KD,L and Kex,ip values was examined, where the symbols KD,L and Kex,ip denote a distribution constant (=[L]org/[L]) of L between the water and org phases and an ion-pair extraction constant (=[CdLPic2]org/[CdL2+][Pic−]2) for CdLPic2 into the org phase, respectively [8]. Application to the estimation of the potentiometric selectivity coefficient for ISE [9,10] based on KM/ML {=[ML2+]org/[M2+][L]org, see Eq. (8)} was tried by using 18C6 as L.
Results and Discussion
Determination of the Cd(II):L composition of extracted species
In the present systems, slopes of the plots of log (D/[Pic−]2) versus log [L]org give compositions of Cd(II):L for species extracted into the various diluents [1-7]. Here, the symbol D refers to an experimental distribution ratio {see Eq. (5)}. Figure 1 shows some examples for such plots. The obtained slope values were 0.92 for the NB system, 1.06 for DCE, 1.00 for oDCBz (Figure 1), 0.93 for DCM, 0.998 for CBu (Figure 1), 0.95 for CBz (Figure 1), 0.96 for BBz (Figure 1), 1.04 for CF, 0.08 for DBE (Figure 1), 1.02 for TE (Figure 1) and 0.99 for mX. Except for the DBE system, we concluded the compositions of the mainly extracted species to be Cd(II):L=1:1 on the basis of these values which are about unity. Also, the compositions of Cd(II):Pic(−I)=1:2 for the extracted species were speculated by considering the principle of electroneutrality in the org phases [3-7].

Figure 1: Plots of log (D/[Pic−]2) vs. log [B18C6]org for the CdPic2 extraction with B18C6 into some diluents. Org=oDCBz (square), CBu (full circle), CBz (circle), BBz (diamond), DBE (full triangle) and TE (triangle).
The slope being less than unity in the experimental [B18C6]DBE range suggested the dissociation [3-7] of Cd(B18C6)Pic2 or Cd(B18C6) Pic+ in the DBE phases. So, the following analyses of this system were performed by essentially assuming the extraction of the species composed of Cd(II):B18C6:Pic(−I)=1:1:2 into the DBE phase.
Determination of Kex, Kex±, KD,Pic, K2,org, KCd/CdL and K1,org
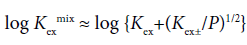
For the determination of KD,Pic, Kex and Kex±, the extraction constant parameter (Kexmix) has been used [3-7].
 (1)
(1)
Here, assuming [CdLPic2]org+[CdLPic+]org >> [CdL2+]org+ …, this equation changes into
 (2)
(2)
with [CdLPic+]org/[Pic−] ≈ KD,Pic at the approximation [Pic−]org ≈ [CdLPic+]org (>>2[CdL2+]org+2[Cd2+]org+…) on the charge balance equation, [Pic−]org=2[Cd2+]org+2[CdL2+]org+[CdLPic+]org+[CdPic+]org for the org phase. Also, the following equation has been derived [3-7].
 (3)
(3)
Hence, Eq. (2) gives KD,Pic and Kex from the plot of log Kex mix versus −log ([Cd2+][L]org[Pic−]) and Eq. (3) does Kex± and Kex from that of log Kex mix versus −log P1/2 [3-7].. Examples of these plots are shown in Figures 2 and 3. A regression line was log Kexmix=log [(1.71 ± 0.21) × 103+{(1.09 ± 0.25) × 10−5/[Cd2+][L]mX[Pic−]}] at the square of correlation coefficient (R )=0.521 in Figure 2, while a line was log Kex mix=log [(6.5 ± 4.2) × 102+{(1.15 ± 0.51) × 10−3/P}1/2] at R2=0.520 in Figure 3. In this mX system, the analyses of both Eqs. (2) and (3) yielded somewhat different Kex values over the experimental errors. Similar results were obtained for the other ten diluent systems. As log Kex values, the analyses based on Eq. (3) gave 4.48 ± 0.03 for the NB system, 2.45 ± 0.10 for DCE, 2.48 ± 0.15 for oDCBz, 2.26 ± 0.08 for DCM, 3.05 ± 0.04 for CBz, 2.54 ± 0.09 for BBz and 2.82 ± 0.28 for mX (Figure 3).

Figure 2: Plot of log Kexmix vs. -log ([Cd2+][L]mX[Pic−]) for the mX extraction system with L=B18C6.

Figure 3: Plot of log Kexmix vs. −log P1/2 for the mX extraction system with L=B18C6.
The (K2,org/mol−1 dm3) values for given ionic-strength ones (Iorg/mol dm−3) of the org phases were calculated from the relation.
K2,org=Kex/Kex± (4)
Here, Iorg was derived approximately to be [Pic−]org {=(1/2)(4[Cd2+] org+4[CdL2+]org+[CdLPic+]org+ [CdPic+]org+[Pic−]org)=(1/2)(2[Cd2+] org+2[CdL2+]org+2[Pic−]org)=[Cd2+]org+[CdL2+]org+[Pic−]org} from the charge balance equation for the org phase (see above) under the condition of [Pic−]org >> (obviously 2[CdL2+]org >) [Cd2+]org+[CdL2+]org {see the derivation of Eq. (2)}. The four basic constants determined above are listed as common logarithmic values in Table 1.
| No. Diluenta | log Kexb | log Kex±c | log KCd/CdLd | log KD,Picb (Ie) |
log K1,orgf (Iorge/10-7) |
log K2,orgg |
|---|---|---|---|---|---|---|
| 1. NB | 4.622 ± 0.008 | 0.18 ± 0.07 | 0.63 ± 0.08 | -2.88 ± 0.02 (0.028) |
5.30 ± 0.11 (2.9 ×10²) |
4.44 ± 0.07 |
| 2. DCE | 2.47 ± 0.07 | -4.55 ± 0.70 | -1.52 ± 0.15 | -4.70 ± 0.29 (0.022) |
6.35 ± 0.82 (3.3) |
7.03 ± 0.70 |
| 3. oDCBz | 2.61 ± 0.05 | -4.01 ± 0.44 | -1.31 ± 0.09 | -5.07 ± 0.21 (0.029) |
7.43 ± 0.54 (2.0) |
6.63 ± 0.45 |
| 4. DCM | 2.33 ± 0.04 | -4.16 ± 0.37 | -1.48 ± 0.11 | -4.74 ± 0.16 (0.031) |
6.82 ± 0.45 (4.3) |
6.49 ± 0.38 |
| 5. CBu | 2.50 ± 0.08 | -4.19 ± 0.17 | -0.87 ± 0.33 | -5.18 ± 0.10 (0.033) |
7.03 ± 0.55 (1.8) |
6.68 ± 0.18 |
| 6. CBz | 3.11 ± 0.02 | -4.00 ± 0.24 | -0.21 ± 0.06 | -5.52 ± 0.12 (0.059) |
7.26 ± 0.30 (1.5) |
7.10 ± 0.24 |
| 7. BBz | 2.76 ± 0.03 | -3.84 ± 0.15 | -0.87 ± 0.26 | -5.53 ± 0.08 (0.043) |
8.10 ± 0.32 (1.0) |
6.60 ± 0.15 |
| 8. CF | 1.78 ± 0.05 | -5.71 ± 0.73 | -2.22 ± 0.12 | -5.34 ± 0.30 (0.031) |
7.19 ± 0.85 (1.1) |
7.49 ± 0.74 |
| 9. DBE | 2.05 ± 0.46 | -5.03 ± 0.10 | -0.92 ± 0.17 | -6.14 ± 0.12 (0.034) |
8.17 ± 0.26 (0.20) |
7.08 ± 0.47 |
| Bzh | 2.36, 2.37 | ---i | ---i | ---i (0.095) |
---i (---i) |
---i |
| 10. TE | 3.23 ± 0.03 | -6.5 ± 2.4 | -0.04 ± 0.07 | -6.6 ± 1.5 (0.059) |
6.7 ± 3.2 (0.13) |
9.7 ± 2.4 |
| 11. mX | 3.23 ± 0.05 | -2.94 ± 0.19 | -0.68 ± 0.12 | -4.96 ± 0.10 (0.029) |
7.66 ± 0.27 (2.5) |
6.17 ± 0.20 |
aPolarity of the diluents decreases in going from No. 1 to 11, where especially Nos. 10 and 11 with Bz show almost the same values. bObtained from Eq. (2). KD,Pic is a conditional distribution constant with dep. cFrom Eq. (3). dFrom Eq. (8). This is the conditional constant with dep. eUnit: mol dm-3. fObtained from Eq. (9). gFrom Eq. (4). hSee [3]. iNot determined.
Table 1: Fundamental data of CdPic2 extraction with B18C6 into various diluents at 298 K.
According to our previous papers [6,7], moreover, KCd/CdL has been defined as [CdL2+]org/[Cd2+][L]org (see Introduction) and the firstapproximately equals D/[L]org. Of course, this constant can be reflected to be the 3rd extraction constant [6,7], Kex2±=[CdL2+]org([Pic−]org)2/ P=KCd/CdL(KD,Pic)2. Here, the experimental distribution ratio D is exactly expressed as:
D=[CdL2+]org{1+([CdLPic+]org+[CdLPic2]org+[CdPic+]org+…)/ [CdL2+]org}/[Cd2+]{1+([CdL2+]+[CdLPic+]+[CdLPic2]+[CdPic+]+ …)/ [Cd2+]}=f × [CdL2+]org/[Cd2+] (5)
Rearranging this f term, we can easily obtain
f ={1+K1,orgKD,Pic[Pic−](1+K2,orgKD,Pic[Pic−])+(Kex,CdPicKD,L/KD,CdLKCdL) ([Pic−]/[L]org)+…}/
[1+[Pic−]{(KCdL/KD,L)[L]org(K1+K1K2[Pic−])+KCdPic}+…] (6)
with Kex,CdPic=[CdPic+]org/[Cd2+][Pic−] and KCdL/KD,L=[CdL2+]/[Cd2+] [L]org. Then, this equation was approximately expressed as:
f ≈ {1+K1,orgKD,Pic[Pic−](1+K2,orgKD,Pic[Pic−]) }/[1+[Pic−]{(KCdL/KD,L) [L]org(K1+K1K2[Pic−])+KCdPic}], (7)
because of a lack of the Kex,CdPic value. For the symbols, KCdL, KD,CdL, K1 and K2, see Eq. (12) to (15). The f values for all the systems were evaluated. The average values of the evaluated f were in the range of 1.2 to 2.6 for the present diluent systems and the the KCd/CdL values were corrected with the f terms.
KCd/CdL ≈ D/f [L]org. (8)
So, this equation becomes the second approximation. In the f calculation with Eq. (7), we assumed that K2,org is independent of Iorg, while we calculated K1, K2 and KCdPic as functions of I (see below). Also, KD,Pic and KD,CdL terms were used as constant values which consist of their averaged values in the f calculation. Besides, we can calculate easily K1,org from the thermodynamic relation of
K1,org=Kex±/KCd/CdL(KD,Pic)2=Kex±/Kex2± [11] (9)
These KCd/CdL and K1,org values are summarized in Table 1, as well as the above four constants.
On amounts of dominant species distributed into org phases
Considering differences among the extraction constants, Kex, Kex± and KCd/CdL, we can compare distribution (or population) of CdLPic20, CdLPic+ and CdL2+ in the org phases [6,7]. The D0, D+ and D2+ values can be calculated from the following equations:
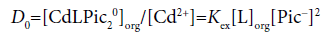 (2a)
(2a)
 (3a)
(3a)
and
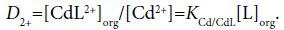 (8a)
(8a)
Figure 4 shows the representative example of the log D0, log D+ and log D2+ plots against log [B18C6]CF for the CF (=org) extraction system. Obviously, the distribution or population profiles were in the order [CdLPic20]CF>[CdLPic+]CF ≥ [CdL2+]CF at L=B18C6. Similar profiles were obtained for the other ten diluent systems. Their profiles were +>0>2+ for the NB system, 0 ≥ 2+=+ for DCE, +≥ 0>2+ for oDCBz, 0 >+> 2+ for DCM, +≥ 0 ≥ 2+ for CBu, 0>+>2+ for CBz, +>0>2+ for BBz, +>2+≥0 for DBE, 0>2+ >+for TE and +>0>2+ for mX. Here, the symbols 0, + and 2+ denote the concentrations at equilibrium of the extracted species CdLPic20, CdLPic+ and CdL2+, respectively. There is no diluent system that CdL2+ is most extractable. These profiles can be classified to two cases that CdLPic20 is most extractable, while CdLPic+ is most extractable. The DCE, DCM, CBz, CF and TE systems belong to the former cases and the NB, oDCBz, CBu, BBz, DBE and mX systems do to the latter ones. Except for TE, the former diluents contain the Cl group in their molecules. On the other hand, the diluent molecules without the Cl group are major in the latter [8-11].
Comparison of distribution properties of the complexes
The three distribution constants, KD,MLA2, KD,MLA and KD,ML, for the complexes can be calculated from the following thermodynamic cycles:
 (10)
(10)
 (11)
(11)
and
 (12)
(12)
with
 (13)
(13)
 (14)
(14)
and
 (15)
(15)
Here, the two distribution constants, KD,MLA and KD,ML, are the conditional equilibrium constants with dep and the evaluations of K1 and K2 were performed from the I-dependence of the K10 and K20 values [2] (the values at I → 0 mol dm−3), respectively. Thus calculated constants are listed in Table 2, with log KD,Pic.
| No. diluent | log KD,Pica (depb/V) |
log KD,CdLPic2c | log KD,CdLPicd,e [ ]f | log KD,CdLe,g [ ]h |
log KD,Li | log Kex,ipj |
|---|---|---|---|---|---|---|
| 1. NB | -2.88 (0.17) |
-0.882 | -0.05 [-2.98] |
2.09 [-3.76] |
1.57k | 6.082 |
| 2. DCE | -4.70 (0.22) |
-2.64 | -2.56 [-6.25] |
0.38 [-6.99] |
2.009 | 4.37 |
| 3. oDCBz | -5.07 (0.17) |
-3.22 | -2.39 [-5.19] |
-0.19 [-5.78] |
1.225 | 3.73 |
| 4. DCM | -4.74 (0.24) |
-2.21 | -1.56 [-5.63] |
0.93 [-7.20] |
2.52 | 4.74 |
| 5. CBu | -5.18 | -4.18 | -3.30 | -0.61 | 0.37 | 2.76 |
| 6. CBz | -5.52 | -2.69 | -1.92 | 0.84 | 1.155 | 4.15 |
| 7. BBz | -5.53 | -3.12 | -1.82 | 0.15 | 1.130 | 3.78 |
| 8. CF | -5.34 | -2.71 | -2.47 | 0.24 | 2.57 | 4.24 |
| 9. DBE | -6.14 | -5.68 | -4.23 | -1.71 | -0.68 | 1.26 |
| Bzl | ---m | -3.56 | ---m | ---m | 0.943 | 3.19 |
| 10. TE | -6.6 | -3.08 | -3.9 | 0.49 | 0.64 | 3.76 |
| 11. mX | -4.96 | -3.53 | -2.35 | -0.49 | 0.30 | 3.43 |
aSee Table 1. bCalculated from Eq. (16a). cFrom Eq. (10). dFrom Eq. (11). eThis is the conditional constant with dep. fLog KD,CdLPicS value. gFrom Eq. (12). hLog KD,CdLS value. iSee [8]. jCalculated from log Kex,ip=log Kex-log (KD,L/KCdL) with KCdB18C6=100.11 mol-1 dm3 in water at 298 K [1]. See [18]. kSee [23]. lSee [1,2]. mNot determined
Table 2: Data derived from the distribution of some species into the various diluents at 298 K.
Figure 5 shows a general tendency for their distribution properties. The log KD,Pic values were smallest of these log KD,j values. There was the order of KD,CdLPic2<KD,CdLPic<KD,CdL, except for the TE system (No. 10 in Figure 5). For meanings of the order, the attention should be needed, because its order does not necessarily reflect amounts of the species extracted into the org phase (Figure 4).

Figure 4: Relative concentration profiles of CdPic20 (circle and D0), CdLPic+ (triangle & D+) and CdL2+ (square and D2+) for the CF extraction with L=B18C6.

Figure 5: Comparison among the log KD,Pic (circle), log KD,CdLPic2 (full triangle), log KD,CdLPic (square) and log KD,CdL (diamond) values in the various diluents. See Table 1 or 2 for the numbering of the diluents.
The log KD,CdL values were positive for the NB (No. 1), DCE (2), DCM (4), CBz (6), BBz (7), CF (8) and TE (10) systems, indicating that interactions of CdB18C62+ with the diluent molecules are larger than those with water molecules. Interestingly, the order, KD,Pic<KCdLPic2<KD, CdLPic<KD,CdL, holds except for the TE system (No. 10), being dependent on the formal charges (−1, 0, +1 and +2) of their species.
On the standardized distribution constants of the complex ions
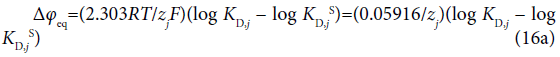
Generally the dep value is related to the conditional distribution constant KD,j of an ion (j) as follows [6,7]:
 (16)
(16)
where the symbols zj and Δφj0′ denote the formal charge of the ion j with its sign and the standard formal potential (V unit) for the j-ion transfer across the org/water (w) interface, respectively. Also, the following relation with the standard distribution constant KD,j S holds:  [4]. The log KD,PicS values have been reported to be 0.05 [12] for the NB/w system, −1.011 [12] for DCE/w, −2.278 [13] for oDCBz/w and −0.68 [14] for DCM/w at 298 K. From these values, we were immediately able to calculate the φeq values (Table 2) using the modified form of Eq. (16) or the Nernst-Donnan equation [15]:
at 298 K.
Similarly, the log KD,CdLPicS and log KD,CdLS values were calculated from the experimentally-obtained log KD,j ( j=CdLPic+ & CdL2+) and Δφeq values. As can be seen from Table 2, the actual (or conditional) KD,CdLPic and KD,CdL orders were NB>DCM>oDCBz>DCE and NB>DCM>DCE>oDCBz, respectively. On the other hand, the calculated log KD,jS orders were NB>oDCBz>DCM>DCE for j=CdLPic+ and NB>oDCBz>DCE>DCM for CdL2+ (Table 2). These orders indicate those standardized at dep=0 V, namely, the orders that the dep effects on log KD,j was lost. So, this fact shows that the occurrences of dep based on the extraction systems affect the more negative effects on CdLPic+ and CdL2+ in interactions with oDCBz molecules than in those with the other molecules at the present time. On the other hand, DCM molecules have positive effects.
Comparison of K1,org with K2,org
There was the relation of K1,org>K2,org for the NB, oDCBz, DCM, CBu, CBz, BBz, DBE and mX systems. The authors think that this is a formal case [6,16]. On the other hand, the relation, K1,org ≤ K2,org, holds for the other three diluent systems. This relation suggests a structural chance around Cd(II) in the reaction of Cd(B18C6)Pic+org+Pic−org  Cd(B18C6)Pic2,org. Relevantly, it has been reported that the crystals of Cd(B18C6)X2 at X=Cl(−I) and Br(−I) have a hexagonal bipyramidal structure [17] {although these examples are not ones in solution and of X=Pic(−I)}.
The log K1,org values were in the order org=NB(log K1,org=5.3)oDCBz ≤ mX ≤ BBz (8.1) ≤ DBE (Table 1). Also, the log K2,org values were in the order NB (log K2,org=4.44)<mX (6.2) ≤ DCM ≤ BBz ≤ oDCBz ≤ CBu ≤ DCE (7.0) ≤ DBE ≤ CBz ≤ CF ≤ TE (9.7) (Table 1). The NB and DCM systems were relatively in the lower range, while the CBz, CF and DBE ones in the higher range. The orders were independent of polarities of the diluents (see the footnote a described in Table 1).
RST plot for the CdPic2-B18C6 system
The RST plot can be obtained from the data (Table 2) of log Kex,ip (or log KD,CdLPic2) and log KD,B18C6, where the log Kex,ip values were calculated from the thermodynamic relation [1,18] of log Kex,ip=log Kex+log (KD,L/ KCdL). The data set, reported before [2], of the Bz system was added in the plot (Table 2). Figure 6 shows its plot for the CdPic2-B18C6 extraction system. The regression analysis of the plot gave the straight line of log Kex,ip=(0.99 ± 0.16)log KD,B18C6+(2.56 ± 0.21) at R2=0.825. In this equation, the slope means a molar volume ratio (VCdLPic2/VL) of CdLPic2 against L [3-6,8]. The points of the NB and CF extraction systems in Figure 6 were neglected from the calculation of the regression line, because of its high polarity [6] and its hydrogen-bonding ability [6,8], respectively. From the data [18] of VB18C6=252 ± 28 cm3 mol−1, we were able to calculate to be VCdLPic2=249 ± 49 at L=B18C6. The Vj values were in the order j=Cd(18C6)Pic2 (about 200 cm3 mol−1 [4]) ≤ 18C6 (214 [8]) ≤ Cd(B18C6)Pic2 ≤ B18C6. At least, the Vj relation, Cd(18C6) Pic2 ≤ Cd(B18C6)Pic2, seems to be reasonable, as well as 18C6 ≤ B18C6.

Figure 6: RST plot based on log Kex,ip and log KD,B18C6 for the 12 diluent systems with Bz (Table 2). The symbols with triangle show the NB and CF systems which were neglected from the regression analyses of the plots. See the text for their reasons.
On the other hand, the intercept generally means the term expressing solute-solvent interactions with the ion-pair formation in the w phase [6,8]: that is, (intercept)=(solute-solvent interaction term)+log K1K2. The common logarithmic values of the averaged K1K2 were in the range of 6.84-7.01. Obtaining K1K2=106.93 mol−2 dm6 as average K1K2 value, we estimated −4.4 as the interaction term from the intercept. This negative sign indicates that the interaction between water molecules and Cd(B18C6)Pic2 is larger than that between those and B18C6, assuming that there are little differences between B18C6 and Cd(B18C6)Pic2 in the interaction with the diluent molecules employed [6]. This result is in good agreement with that in the log KD,CdLPic2 values of which all are smaller than zero (namely KD,CdLPic2<1, Table 2 and Figure 5).
Possibility for estimation of potentiometric selectivity coefficients
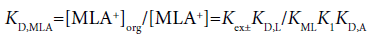
According to previous papers [9,10], a potentiometric selectivity coefficient of Mz+ against M′z+ at an org/w interface for ISE had been expressed as:
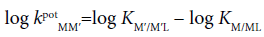 (17)
(17)
where M′z+ shows an interfering cation in a test solution. From the extraction data [3-5] of the MPic2-18C6 systems with M=Cd(II) and Pb(II) reported by us and Eq. (8) without the f correction, we can immediately calculate the log KCd/Cd18C6 and log KPb/Pb18C6 values. The log KCd/Cd18C6 values were calculated here to be 2.95 for the NB/w extraction system, −0.13 for DCE/w, −0.25 for oDCBz/w and −0.68 for DCM/w [6], while the log KPb/Pb18C6 values were 6.60 ± 0.17 for NB/w, 4.92 ± 0.06 for DCE/w, 6.309 ± 0.009 for oDCBz/w and 4.74 ± 0.05 for DCM/w. Therefore, the log kpot PbCd values based on 18C6 were obtained to be −3.7 for the NB/w interface, −5.1 for DCE/w, −6.6 for oDCBz/w and −5.4 for DCM/w. The oDCBz/w interface shows the highest Pb2+ selectivity of the four diluent/w interfaces. Similarly, if the KPb/PbB18C6 values are determined, then one can easily estimate the kpotPbCd values based on L=B18C6.
On the other hand, the logarithmic ratios of Kex±,Cd/Kex±,Pb with L=18C6 were calculated to be −7.5 for the NB system, −7.3 for DCE and −8.5 for oDCBz based on the data [3-5] reported before and its selectivity order is oDCBz >> NB>DCE. Similarly the log (Kex,Cd/Kex,Pb) were −7.72 for NB (calculated here from the data [4,5]), −8.08 for DCE, −8.03 for oDCBz and −8.4 for DCM [5] and its order is DCM>DCE>oDCBz>NB. These both orders are not accord with the KpotPbCd order, oDCBz >> DCM>DCE >> NB (see above for the evaluated values). This fact indicates that the KpotPbCd values are not simply predicted by the ratios of the experimental Kex± or Kex values without dep. So, this emphasizes the effect of the conditional KM/ML value on the estimation of kpot MM′ for ISE, because the relation, log KM/ML=log KD,M+log KML,org=(2F/2.303RT) (Δφeq−ΔφM 0′)+log KML,org, is derived from Eq. (16). In other words, KM/ ML or KM´/M´L is the function of dep [6,7].
Experimental
Materials and reagents
Preparation procedures of CdPic2⋅xH2O, B18C6 and the 11 diluents were the same as those reported before [3].
Extraction experiments
Operational procedures and analytical methods of the Cd(II) species extracted into the org phases were the same as those reported before [2-4,6]. Experimental initial concentrations were [Cd(II)]0=0.015 mol dm−3, [Pic(−I)]0=0.031 mol dm−3 and [B18C6]0=0.00070-0.0074 mol dm−3 for the NB system, 0.0053 and 0.012, 0.011 & 0.024 and 0.0017- 0.013 for DCE, 0.017, 0.034 and 0.00077-0.0051 for oDCBz, 0.017, 0.034 and 0.00077-0.015 for DCM, 0.020, 0.041 and 0.043 and 0.00074- 0.0095 for CBu, 0.037, 0.075 and 0.00024-0.0028 for CBz, 0.016&0.034, 0.034&0.072 and 0.00013-0.047 for BBz, 0.017, 0.034 and 0.0015-0.015 for CF, 0.020, 0.040 and 0.0018-0.0046 for DBE, 0.037, 0.075 and 0.00042-0.0056 for TE and 0.017, 0.034 and 0.00060-0.0053 for mX. Some results in the extraction experiments obtained from these initial concentrations are shown in Figure 1. The pH values for the w phases after the extraction operations were in the range of 5.34 to 6.87, except for the DBE system of which the lowest value was 4.26. Even such pH value shows that its [Pic−]/[HPic] ratio was about 103.8 (=10−pKa/10− pH=10−0.49/10−4.26), because pKa,HPic=0.49 at I=0.034 mol dm−3 (Table 1) for the DBE extraction system [19].
Data analyses
The data analyses were essentially the same as those reported before [6,7]. In the present study, the following component equilibria were basically employed for the analyses:
(i) Cd2++L CdL2+ [1], CdL2++Pic− CdLPic+ [2,20], CdLPic++Pic− CdLPic2 [2,20], Cd2+ +Pic− CdPic+ [20] and H++Pic− HPic [19] in the w phase;
(ii) Pic− Pic−org, CdLPic2 CdLPic2,org, CdLPic+ CdLPic+ org, CdL2+ CdL2+org, L Lorg [8] and HPic HPicorg [4,21] between the two phases;
(iii) CdL2+org+Pic−org CdLPic+org and CdLPic+org+Pic−org CdLPic2,org, in the org phase at L=B18C6. In order to avoid the unnecessary complexity in the overall extraction equilibrium, the equilibria of H+ H+ NB and Cd2+ Cd2+ NB were neglected, because their distribution data had been reported so far [11,22,23].
Conclusion
The K1,org values were determined precisely in terms of evaluating the f coefficients. By comparing these values with the K2,org ones, the structural changes around Cd(II) in the ion-pair complexes were speculated, as well as the CdA2-18C6 extraction systems with A=Cl(−I), Br(−I) and Pic(−I). The conditional KD,CdL values were smoothly estimated from the thermodynamic cycle, in addition to the KD,Pic, KD,CdLPic2 and KD,CdLPic determination at L=B18C6. So, the determination of these actual distribution constants made a systematic study of their distribution properties possible. The results in such a study were not in conflict with those based on the RST plot. Moreover, it was suggested that the evaluation of the KCd/CdL values with dep has a possibility in the prediction of the Kpot PbCd values for ISE. The above results promise us a systematic procedure for the study of the actual M(II) extraction with L.
References
- Katsuta S, Tsuchiya F, Takeda Y (2000) Equilibrium Studies on Complexation in Water and Solvent Extraction of Zinc(II) and Cadmium(II) with Benzo-18-crown-6. Talanta 51: 637-644.
- Kudo Y, Kobayashi Y, Katsuta S, Takeda Y (2009) Ion-pair Formation of Cadmium-18-crown-6 ether Complex Ions with Picrate and Chloride Ions in Water and Distribution of Its Picrate Ion-pair Complex into Benzene. J Mol Liquid 145: 60-65.
- Kudo Y, Horiuchi N, Katsuta S, Takeda Y (2013) Extraction of Cadmium Bromide and Picrate by 18-Crown-6 Ether into Various Less-polar Diluents: Analysis of Overall Extraction Equilibria Based on Their Component Equilibria with Formation of Their Ion Pairs in Water. J Mol Liquid 177: 257-266.
- Kudo Y, Katsuta S, Ohsawa Y, Nozaki K (2015) Solvent Extraction of Cadmium Picrate by 18-Crown-6 Ether into Several Less-polar Diluents and Nitrobenzene: Re-evaluation of the Corresponding Overall Extraction Systems. J Thermodyn Catal 6: 2.
- Kudo Y, Takahashi Y, Numako C, Katsuta S (2014) Extraction of Lead Picrate by 18-Crown-6 Ether into Various Diluents: Examples of Sub-analysis of Overall Extraction Equilibrium Based on Component Equilibria. J Mol Liquid 194: 121-129.
- Kudo Y, Tomokata S (2017) Extraction of Cadmium Chloride by 18-Crown-6 Ether into Various Diluents: A Comparative Study with Bromide and Picrate Extraction Systems. J Mol Liquid 249: 904-911.
- Kudo Y (2017) An Approximation Method for Determining Key Extraction Constants in the Equilibrium-analysis of Cd(II) Extraction with 18-Crown-6 Ether into Some Diluents. J Anal & Pharm Res 5: 3.
- Takeda Y (2002) Extraction of Alkali Metal Picrate with 18-Crown-6, Benzo-18-crown-6, and Dibenzo-18-crown-6 into Various Organic Solvents. Elucidation of Fundamental Equilibria Governing the Extraction-ability and -selectivity. Bunseki Kagaku (Anal Chem) 51: 515-525.
- Kudo Y, Takeda Y, Matsuda H (1991) Ion-transfer-polarographic Study of Distribution Equilibrium of Metal Complex Cations with Several Crown Ethers between Nitrobenzene and Water. Bunseki Kagaku (Anal Chem) 40: 779-784.
- Sandblom J, Eisenman G, Walker Jr JL (1967) Electrical Phenomena Associated with the Transport of Ions and Ion Pairs in Liquid Ion-exchange Membranes. J Phys Chem 71: 3862-3870.
- Kudo Y, Takeuchi T (2014) On the Interfacial Potential Differences for the Extraction of Alkaline-earth Metal Picrates by 18-Crown-6 Ether Derivatives into Nitrobenzene. J Thermodyn Catal 5: 2.
- Kudo Y, Harashima K, Hiyoshi K, Takagi J, Katsuta S, et al. (2011) Extraction of Some Univalent Salts into 1,2-Dichloroethane and Nitrobenzene: Analysis of Overall Extraction Equilibrium Based on Elucidating Ion-pair Formation and Evaluation of Standard Potentials for Ion Transfer at the Interfaces between Their Diluents and Water. Anal Sci 27: 913-919.
- Hundhammer B, Müller C, Solomon T, Alemu H, Hassen H (1991) Ion Transfer across the Water-o-dichlorobenzene Interface. J Electroanal Chem (Lausanne) 319: 125-135.
- de Namor AFD, Traboulssi R, Salazar FF, de Acosta VD, de Vizcardo YF, et al. (1989) Transfer and Partition Free Energies of of 1:1 Electrolytes in the Water-dichloromethane Solvent System at 298.15 K. J Chem Soc, Faraday Trans 185: 2705-2712.
- Koryta J (1979) Electrochemical Polarization Phenomena at the Interface of Two Immissible Electrolyte Solutions. Electrochim Acta 24: 293-300.
- Shriver DF, Atkins PW (1999) Inorganic Chemistry. 3rd edn. Oxford University Press, Oxford, NY, p: 243.
- Pickardt J, Wiese S, Wischlinski P (1997) Reactions of Cadmium and Mercury(II) Halides Pseudohalides with Crown Ethers: Crystal Structures of the Complexes of Benzo-18-crown-6 with CdX2 and HgX2 (X = Cl, Br) and of Dibenzo-18-crown-6 with Hg(CN)2 Z. Naturforsch 52: 1296-1300.
- Takeda Y, KatÅ H (1979) The Solvent Extraction of Bivalent Metal Picrates by 15-Crown-5, 18-Crown-6, and Dibenzo-18-crown-6. Bull Chem Soc Jpn 52: 1027-1030.
- Kortüm G, Vorgel W, Andrussow K (1961) Dissociation Constants of Organic Acids in Aqueous Solution. IUPAC, Section of Analytical Chemistry, Commission on Electrochemical Data, Butterworths, London UK, p: 454.
- Kudo Y (2013) Potentiometric Determination of Ion-pair Formation Constants of Crown Ether-complex Ions with Some Pairing Anions in Water in Electrochemistry. InTech-Open Access Publishers, Rijeka Croatia.
- Kudo Y, Takahashi Y, Katsuta S (2013) Distribution of Picric Acid into Various Diluents. J Chem, p: 4.
- MakrlÃk E, Vaňura P, Selucký P (2008) Solvent Extraction of Ba2+, Pb2+, and Cd2+ into Nitrobenzene by Using Strontium Dicarbollylcobaltate in the Presence of Tetraethyl p-tert-Butylcalix[4]arene Tetraacetate. Acta Chim Slov 55: 430-433.
- Kudo Y, Miyakawa T, Takeda Y, Matsuda H, Yajima S (1996) Ion-transfer Polarographic Study of the Distribution of Alkali and Alkaline-earth Metal Complexes with 3m-Crown-m Ether Derivatives (m = 6, 8) between Water and Nitrobenzene Phases. J Incl Phenom Mol Recognition Chem 26: 331-341.
Citation: Kudo Y, Tanaka Y, Ichikawa H, Katsuta S (2017) Determination of Some Component Equilibrium-constants by Cd(II) Picrate Extraction with Benzo-18-crown-6 Ether into Various Diluents and their Evaluation. J Anal Bioanal Tech 8: 391. DOI: 10.4172/2155-9872.1000391
Copyright: ©2017 Kudo Y, et al. This is an open-access article distributed under the terms of the Creative Commons Attribution License, which permits unrestricted use, distribution, and reproduction in any medium, provided the original author and source are credited.
Select your language of interest to view the total content in your interested language
Share This Article
Open Access Journals
Article Tools
Article Usage
- Total views: 6565
- [From(publication date): 0-2017 - Dec 19, 2025]
- Breakdown by view type
- HTML page views: 5610
- PDF downloads: 955