Diurnal Variation and Water Quality Parameters of Three Different Ecosystems in Gulf of Mannar, Southeast Coast of India
Received: 11-Apr-2018 / Accepted Date: 17-May-2018 / Published Date: 22-May-2018 DOI: 10.4172/2155-9910.1000252
Abstract
A study pertaining to diurnal variations of water quality parameters were carried out in three different coastal ecosystems Mandapm jetty (MJ), Seagrass meadows (SG) and coral reef (CR) i.e. sites (site1, site 2 and site 3) of Gulf of Mannar (GoM) for the period 24 hours from the month of September 20 to 21, 2016. The various physicochemical parameters like water temperature, salinity, pH and dissolved oxygen of the different environments are the main factors to influence the water quality of the selected study sites. The water temperature (WT°C) varied from 28.44 to 32.30°C, salinity ranged between 35.89 to 40.28 ppt, pH measured as from 7.98 to 8.48 and dissolved oxygen varied from 3.72 to 8.58 mg/l respectively. The recorded value of chlorophyll a ranged between 0.36 to 1.32 mg/m3 from three sites during the study period. From the three different ecosystems, seagrass ecosystem constantly influences the variation of physicochemical parameters from other two ecosystems. The physicochemical variations of coastal region are including wide range of spatio-temporal variations in selected ecosystems (sites).
Keywords: Gulf of Mannar; Physicochemical; Diurnal; Parameters; Ecosystems
Introduction
Water is importantly required for every living organism in this earth. Due to industrialization and urbanization, create deterioration of water quality and depletion of several aquatic animals [1]. Coastal area acts as a dynamic and productive ecosystem for human settlements, industries, and tourism [2]. Physicochemical characters are very important to monitor the water quality parameters and coastal water instability [3], considerable variations of physicochemical parameters affects the quality of water resources. The water and air temperature, turbidity, dissolved oxygen, salinity, hydrogen ion (pH) concentration, chlorides and total alkalinity are the important parameters used to determine the study of water quality. Indian estuaries and coastal water physicochemical parameters were analyzed by many researchers in earlier [4-7]. The fluctuation of physicochemical characters controls the entire aquatic ecosystems along the distribution of flora and fauna [5].
In Gulf of Mannar (GoM) comprise and supports several marine ecosystems i.e. coral reef, seagrass and mangrove ecosystem. In GoM coral reefs serve as spawning grounds for many fishes, seagrass meadows act as nursery grounds and mangroves give shelters, and thus form a unique component of life -support system for coastal biodiversity [8]. Coral reefs ecosystem along with the seagrass meadows, make this region is highly productive and it’s considered one of the most primitive ecosystem of the world [9,10]. Status of coral reef along with seagrass meadows and associate flora and fauna in GoM was studied earlier by several authors [11-14]. Coral reefs and seagrasses are the important part of the economy of many, often poor, coastal fisher folk, over thousand families of fishers live along the coastline of Gulf of Mannar and Palk Bay and the majority of them are directly depending on the coral reef associated fauna and flora for their livelihood [8]. Reported that seagrass ecosystems are more sensitive to impacts linked with human disturbance and are undergoing significant declines [15]. Mandapam is one of the important fish landing centers of the Tamil Nadu, with about 100 trawlers and large numbers of indigenous trawling boats operated from here [16]. The GoM coastline is known for its rich marine biodiversity especially intertidal biota and it’s extended to sub tidal area [17]. This seashore is highly protected area that declared by Gulf of Mannar Biosphere Reserve authority in 1989. Therefore, the present study reports that the spatial and temporal variations of the coastal water quality from the three different ecosystems in the Gulf of Mannar, southeast coast of India.
Materials and Methods
Study area
Gulf of Mannar (GoM) Marine National Park is located towards Ramanathpuram to Tuticorin, district of the state of Tamil Nadu. The park area is the core area of the GoM Marine Biosphere Reserve. It comprises of 21 coral reef islands along with several patches of seagrass meadows and shallow water habitat of unique marine biodiversity. The GoM receives rainfall from both southwest and northeast monsoons of India, irregular wind speed and ocean trends appeared in this regions and highest wind speed, turbulent ocean observed during the months of June to August. The study sites were selected based on its current pattern, topography and anthropogenic activity.
The present study was carried out during the month of September 19th to 20th September, 2016. The geography of the sampling sites coral reef site (Lat. 09° 15’ 01.13”N, Lon. 79° 12’ 43.13” E), seagrass meadows (Lat. 09° 15’ 02.21” N, Lon. 79° 12’ 45.72” E) and Mandapam south fishing jetty (Lat. 09° 16’ 39.32” N, Lon. 79° 09’ 23.98” E), are situated in the Gulf of Mannar. Multi-probe water quality data profiler (HYDROLAB DS 5X 500) were deployed over a sampling period to determine ambient water temperature (WT), dissolved oxygen (DO) concentration, salinity and pH on an hourly (15 min/data, 4 data/ hour) basis for 24 hours (diel period) through on-line method. In the diel period, Hydrolab deployed just below the water surface and just above the sediment-water interface of the deep water of coral reef, seagrass meadows, and Mandapam jetty.
Mandapam jetty was considered as site 1 and this site may polluted by oils spills and fish processing industries, the pollution in and around the jetty area is due to the fisheries boat anchoring. Site 2 was considered as seagrass meadows at Pamban near Chinnapalam village seashore. Coral reef site as considered as site 3 in near site 2. On the other hand every one hour coastal water sample were collected (manual @ off-line method), and water quality parameters cross checked in all sites (coral reef, seagrass meadows and Mandapam jetty) throughout the study period. During the sample collection pre-cleaned polypropylene bucket used for collection of coastal water samples for the analysis of DO, salinity, conductivity by using YSI 2030 DO meter in-situ conditions, pH was analysed by using hand pH meter (EUTECH instrument model: Eco Testr pH 1). After in-situ analysis samples are immediately preserved and labeled for further laboratory analysis. In laboratory conditions dissolved oxygen (mg/l) estimated by modified Winkler’s method described by Strickland and Parsons (1972). Salinity (ppt) estimated by using titration method [18]. Chlorophyll a (mg/m3) was estimated the method followed by Strickland and Parsons [19]. Primary productivity estimated by light and dark bottle method adopted by Strickland and Parson and result expressed as mg/cm/hr.
Statistical analysis
All collected data analysed and interpreted in SPSS 20.0. Analysis of Variance (ANOVA) used to compare all physicochemical parameters to one another between the sites; ANOVA was followed by Tukey’s post hoc test used to test multiple comparisons of sites for different physicochemical parameters in Table 1. The maximum, minimum and average values of WT, salinity, pH and DO were extracted from data obtained during the deployment period. The WT, salinity, pH and DO fluctuation was calculated as the average difference from the lowest value and highest value of data during the study period. Deployment data indicates strong diel variability appears between the parameters and sites. All quality control procedures are followed during the deployment and data collection. The instruments were pre-calibrated using NIST traceable standards and certified reference materials (CRM) before and after deployment.
| Dependent Variable | (I) Sites# | (J) Sites# | Mean Difference (I-J) | Std. Error | Sig. | 95% Confidence Interval | |
|---|---|---|---|---|---|---|---|
| Lower Bound | Upper Bound | ||||||
| Temperature | Site 1 | Site 2 | 0.734* | 0.099 | 0.000 | 0.501 | 0.967 |
| Site 3 | -0.827* | 0.099 | 0.000 | -1.060 | -0.594 | ||
| Site 2 | Site 1 | -0.734* | 0.099 | 0.000 | -0.967 | -0.501 | |
| Site 3 | -1.561* | 0.099 | 0.000 | -1.795 | -1.328 | ||
| Site 3 | Site 1 | 0.827* | 0.099 | 0.000 | 0.594 | 1.060 | |
| Site 2 | 1.561* | 0.099 | 0.000 | 1.328 | 1.795 | ||
| Salinity | Site 1 | Site 2 | -1.039* | 0.026 | 0.000 | -1.010 | -0.978 |
| Site 3 | 2.740* | 0.026 | 0.000 | 2.679 | 2.801 | ||
| Site 2 | Site 1 | 1.039* | 0.026 | 0.000 | 0.978 | 1.100 | |
| Site 3 | 3.779* | 0.026 | 0.000 | 3.718 | 3.840 | ||
| Site 3 | Site 1 | -2.740* | 0.026 | 0.000 | -2.802 | -2.679 | |
| pH | Site 2 | -3.779* | 0.026 | 0.000 | -3.840 | -3.718 | |
| Site 1 | Site 2 | 0.275* | 0.006 | 0.000 | 0.261 | 0.290 | |
| Site 3 | -0.041* | 0.006 | 0.000 | -0.056 | -0.027 | ||
| Site 2 | Site 1 | -0.275* | 0.006 | 0.000 | -0.290 | -0.260 | |
| Site 3 | -0.317* | 0.006 | 0.000 | -0.332 | -0.302 | ||
| Site 3 | Site 1 | 0.041* | 0.006 | 0.000 | 0.027 | 0.056 | |
| DO | Site 2 | 0.317* | 0.006 | 0.000 | 0.302 | 0.332 | |
| Site 1 | Site 2 | 1.825* | 0.126 | 0.000 | 1.527 | 2.124 | |
| Site 3 | 1.469* | 0.126 | 0.000 | 1.178 | 1.767 | ||
| Site 2 | Site 1 | -1.825* | 0.126 | 0.000 | -2.124 | -1.527 | |
| Site 3 | -0.356* | 0.126 | 0.014 | -0.655 | -0.058 | ||
| Site 3 | Site 1 | -1.469* | 0.126 | 0.000 | -1.768 | -1.171 | |
| Site 2 | 1.356* | 0.126 | 0.014 | 0.058 | 0.655 | ||
*The mean difference is significant at the 0.05 level. #site 1 Mandapam jetty, site 2 seagrass meadows, site 3 coral reef ecosystem
Table 1: Results of Tukey’s post hoc test showing multiple comparisons of physicochemical parameters between the sites.
Results and Discussion
Water temperature
In the present study water temperature ranged from 28.44 to 32.30°C in all study sites during the study period. In site 1 (Mandapam fishing jetty) WT may varied from 30.15 to 31.44°C, mean ± SD (30.61 ± 0.43, n=96). Compared to other study sites, site 2 (seagrass meadows) recorded highest range of WT from 28.44 to 31.67°C (29.87 ± 3.24, n=96) and site 3 showed 30.80 to 32.30°C (31.44 ± 0.37, n=96) respectively in Table 2 and Figure 1. ANOVA result showed significant variation between the sites (F=124.61, P<0.05 level). In site 2 coral reefs are well known temperature sensitive [20,21], geographical variation of coral reef temperature tolerance proved by [22]. Water temperature is an important hydrological parameter, which influence almost every chemical and biological interaction in water [23]. The GoM surface water temperature increase from the month of January until it reaches maximum in April, slightly fall in June and again rose towards August from then gradually falls to minimum in December. Water temperature variations influenced by the air temperature, humidity, wind action, tides, and solar energy.
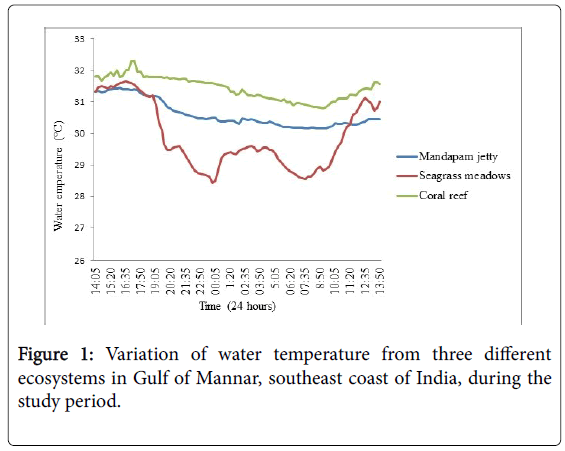
Figure 1: Variation of water temperature from three different ecosystems in Gulf of Mannar, southeast coast of India, during the study period.
Salinity
The salinity was fluctuated between 35.89 to 40.28 ppt in all sites in the GoM. Highest range of salinity was recorded in site 2 when compared to the other study sites, site 2 showed that 39.24 to 40.28 ppt, mean ± SD (39.74 ± 0.30, n=96) because of unusual water temperature was present in the site 2 it may influence the salinity of this site during the study period. In site 1 and site 3 salinity ranged between 38.56 to 38.79 (38.70 ± 0.06, n=96) and 35.89 to 35.99 (35.96 ± 0.02, n=96) respectively in Table 2. Due to the presence of water temperature fluctuation and coral reef-zooxanthallae association create less salinity in coral reef ecosystem as site 1 in Figure 2. [24]. A relationship between on-line and off-line coastal water sample results showed in Figure 3. ANOVA results shows that there is a significant variation between the sites during the study period (F=11328.60, P<0.05 level; Figure 2). The salinity acts as a limiting factor, for distribution of living organisms, and it causes dilution and evaporation, it may influence the fauna of the intertidal zone [25].
| Sites# | N | Temperature (°C) | Salinity (ppt) | pH | DO(mg/l) | ||||||||
|---|---|---|---|---|---|---|---|---|---|---|---|---|---|
| Min | Max | Mean ± SD |
Min | Max | Mean ± SD |
Min | Max | Mean ± SD |
Min | Max | Mean ± SD |
||
| Site 1 | 96 | 30.15 | 31.44 | 30.16 ± 0.43 |
38.56 | 38.79 | 38.70 ± 0.06 |
8.28 | 8.48 | 8.38 ± 0.05 |
6.75 | 8.30 | 7.49 ± 0.35 |
| Site 2 | 96 | 28.44 | 31.67 | 29.87 ± 1.04 |
39.24 | 40.28 | 39.74 ± 0.30 |
7.98 | 8.16 | 8.10 ± 0.05 |
3.72 | 8.58 | 5.67 ± 1.42 |
| Site 3 | 96 | 30.80 | 32.30 | 31.44 ± 0.37 |
35.89 | 35.99 | 35.96 ± 0.02 |
8.35 | 8.45 | 8.42 ± 0.03 |
5.34 | 6.83 | 6.03 ± 0.41 |
southeast coast of India, during the study period.
#site 1 Mandapam jetty, site 2 seagrass meadows, site 3 coral reef ecosystem
Table 2: Variation of physicochemical parameters from three different ecosystems in Gulf of Mannar.
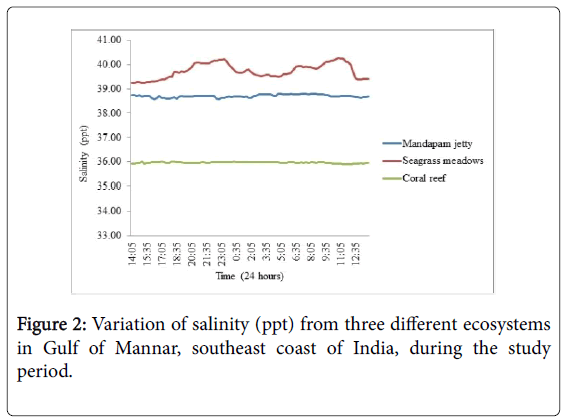
Figure 2: Variation of salinity (ppt) from three different ecosystems in Gulf of Mannar, southeast coast of India, during the study period.
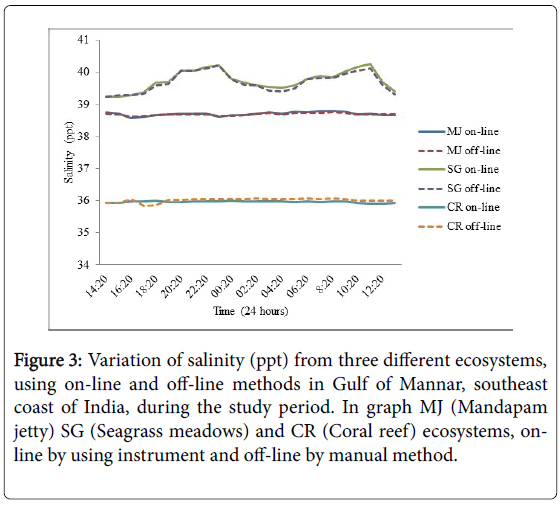
Figure 3: Variation of salinity (ppt) from three different ecosystems, using on-line and off-line methods in Gulf of Mannar, southeast coast of India, during the study period. In graph MJ (Mandapam jetty) SG (Seagrass meadows) and CR (Coral reef) ecosystems, online by using instrument and off-line by manual method.
pH
The range of hydrogen-ion concentration (pH) changed in the coastal water depends upon the removal of free CO2 in photosynthesis via. Bicarbonate degradation, reduction of salinity, freshwater influx, temperature and decomposition of organic matter [26,27]. The pH is one of the vital environmental parameter required for survival of aquatic organisms, its metabolic activity, physiology, and chemical process [28] In Table 2 and Figure 4, the maximum value of pH 8.48 was present in site 1 when compared to the other sites. The minimum value of pH 7.98 was representing in site 2 then the site 3 and site 1. In site 3 pH 8.45 shows not much different from the other sites. Site 1 pH ranged between 8.28 to 8.48, mean ± SD (8.38 ± 0.05, n=96), site 2 represent 7.98 to 8.16 (8.10 ± 0.05, n=96) and site 3 showed 8.35 to 8.45 (8.42 ± 0.03, n=96) respectively Table 2. There was a significant variation among the sites showed in ANOVA (F=1527.29, P<0.05 level).
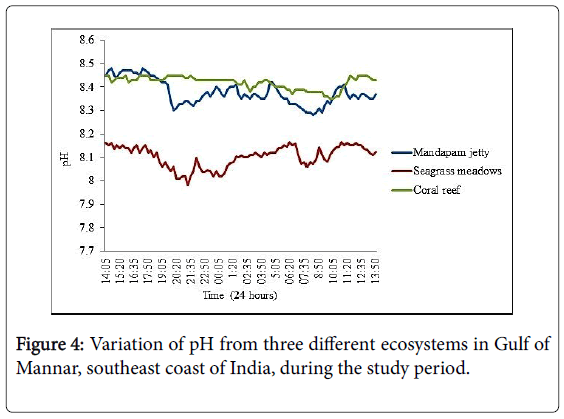
Figure 4: Variation of pH from three different ecosystems in Gulf of Mannar, southeast coast of India, during the study period.
Assessment of manual off-line and on-line coastal sample results showed in Figure 5. Based on Abowei (2010) report, pH values recorded (7.98 to 8.48) in this study were well within the preferred pH levels (7.0 to 8.5) for biological productivity in the ecosystems. Seagrass like macrophytes grows in the shallow coastal regions are characterized by metabolic activity and modify the pH within their limits [29]. For example, in Mediterranean Sea Posidonia oceanica seagrass meadows change or modify the pH in seawater column as much as 0.2–0.7 pH units diurnally, via photosynthetic activity and community metabolism [30-32].
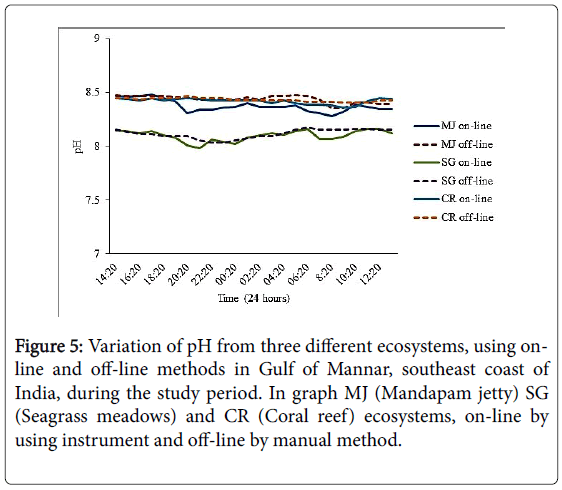
Figure 5: Variation of pH from three different ecosystems, using online and off-line methods in Gulf of Mannar, southeast coast of India, during the study period. In graph MJ (Mandapam jetty) SG (Seagrass meadows) and CR (Coral reef) ecosystems, on-line by using instrument and off-line by manual method.
Dissolve oxygen (DO)
During the study period the highest concentration of Dissolved oxygen (8.58 mg l-1) and lowest (3.72 mg l-1) was recorded in the site 2, mean ± SD (5.67 ± 1.42, n=96) when compared to the other study sites. In site 1, DO ranged between 6.75 to 8.30 mg l-1 (7.49 ± 0.35, n=96) and site 3 represent 5.34 to 6.83 mg l-1 (6.03 ± 0.41, n=96) respectively in Table 2 and Figure 6. Variation of on-line and off-line coastal water sample results showed in Figure 7. Monitoring of OD, provide water quality in coastal ecosystems and used as a tools of integrity in ecosystems [33]. Dissolved Oxygen is directly influenced by the water turbulence, surface diffusion, photosynthesis rate, Biological Oxygen demand, water temperature, and carbon dioxide concentration. Due to the presence of phytoplankton bloom were appeared in site 2 (seagrass meadows site) might be responsible for the DO fluctuations (difference ± SD; 4.86 ± 1.42) during the study period commonly occurred in high temperature, high salinity environment [34] temperature, salinity may influence the DO concentration in coastal waters [35]. The relationship between the water temperature and dissolved oxygen is inversed natural process, because warmer water more saturated with oxygen and it can holds less dissolve oxygen [36]. Statistically ANOVA result shows that there was a significant variation among sites in entire study period (F=116.87, P<0.05 level).
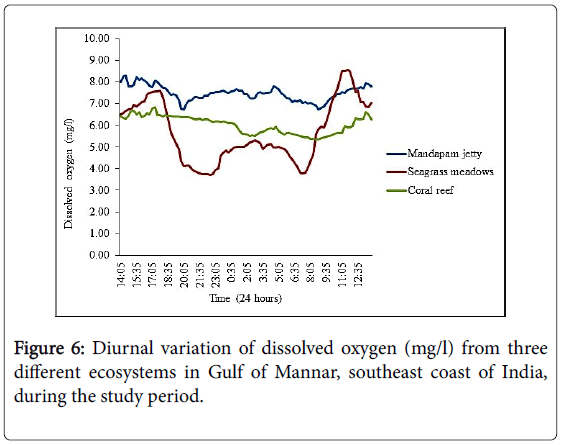
Figure 6: Diurnal variation of dissolved oxygen (mg/l) from three different ecosystems in Gulf of Mannar, southeast coast of India, during the study period.
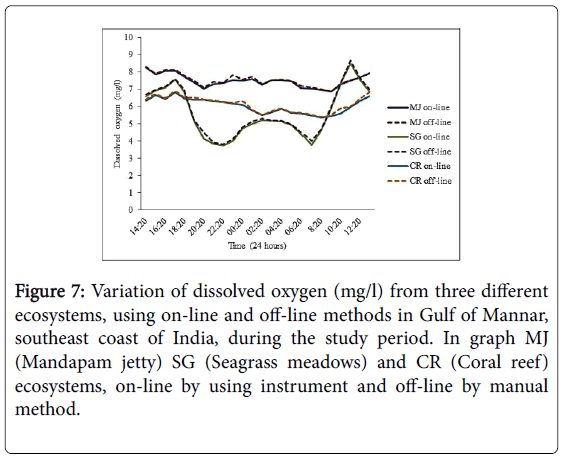
Figure 7: Variation of dissolved oxygen (mg/l) from three different ecosystems, using on-line and off-line methods in Gulf of Mannar, southeast coast of India, during the study period. In graph MJ (Mandapam jetty) SG (Seagrass meadows) and CR (Coral reef) ecosystems, on-line by using instrument and off-line by manual method.
Chlorophylla
Surface coastal water samples were collected preserved for chlorophyll a pigment analysis in selected study sites. The concentration of chlorophyll a seemed to be high (mean ± SD; 1.31 ± 0.04 mg/m3, n=24 (data/hour)) in site 2 when compare to the other study sites. Due to the high salinity, DO and phytoplankton concentration might be responsible for the high concentrations chlorophyll a during the study period. In site 1 concentration of chlorophyll a ranged from 0.86 to 0.96 mg/m3 (0.90 ± 0.31, n=24) and site 3 showed 0.32 to 0.41 mg/m3 (0.36 ± 0.02, n=24) respectively in Figure 8. ANOVA results shows that there is a significant variation between the sites in entire study period in Gulf of Mannar. The chlorophyll concentration is useful in estimating productivity as well as indicator of light stress in seagrasses [37,38].
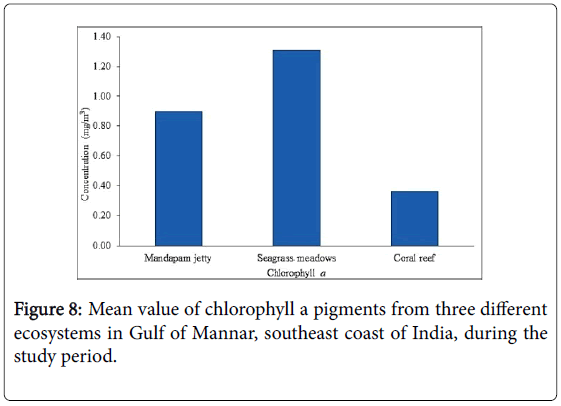
Figure 8: Mean value of chlorophyll a pigments from three different ecosystems in Gulf of Mannar, southeast coast of India, during the study period.
Conclusion
The present study concludes the spatial and temporal variations of several environmental characteristics of three different ecosystems in the Gulf of Mannar which suffered different scale of disturbance. The present baseline information of the physicochemical parameters in coastal water would form a useful tool for further assessment and monitoring of these coastal ecosystems. Among the three ecosystems, seagrass meadows ecosystem showed higher difference value of water temperature, salinity, dissolved oxygen and presence of high concentration of chlorophyll a , than the other ecosystems. Overall, from this study observed that site 2 (seagrass meadows ecosystem) constantly influences the variation of physicochemical parameters from other two sites.
Acknowledgement
The authors would like to thanks the Ministry of Earth Sciences, Government of India for financial support of the work. The authors also acknowledge to Dr. M. A. Atmanand, Director, National Institute of Ocean Technology, Chennai, India. Dr. M. V. Ramana Murthy, Scientist-G (Group Head) and Dr. Sivakholundu former Group Head, Coastal Environmental Engineering Division, National Institute of Ocean Technology, Chennai, India. We extended gratitude to other team members in our division and Tamil Nadu Forest department officials for their encouragement and constant support to complete this work.
References
- Kiran BR (2010) Physico-chemical characteristics of fish ponds of Bhadra project at Karnataka. Rasayan Journal of Chemistry 3: 671-676.
- Xiaojun Y (2008) Remote sensing and Geospatial Technologies for coastal ecosystem assessment and management. ISPRS Journal of Photogrammetry and Remote Sensing 63: 485-487.
- Efe SI, Ogban FE, Horsfall MJ, Akporhonor EE (2005) Seasonal variations of physico-chemical characteristics in water resources quality in western Niger delta region, Nigeria. Journal of Applied Sciences and Environmental Management 9: 191-195.
- Rajasegar M (2003) Physico-chemical characteristics of the Vellar estuary in relation to shrimp farming. Journal of Environmental Biology 24: 95-101.
- Sundaramanickam A, Sivakumar T, Kumaran R, Ammaiappan V, Velappan R (2008) A comparative study of physico-chemical investigation along Parangipettai and Cuddalore coast. Journal of Environmental Science and Technology 1: 1-10.
- Pradhan UK, Shirodhar PV, Sahu BK (2009) Physico-chemical characteristic of the coastal water off Devi estury, Orissa and evaluation of its seasonal changes using chemometric techniques. Current Science 96: 1203-1209.
- Sahu G, Satpathy KK, Mohanty AK, Sarkar SK (2012) Variations in community structure of phytoplankton in relation to phytochemical properties of coastal waters, southeast coast of India. Indian Journal of Marine Sciences 41: 223-241.
- Kumaraguru AK, Kannan R, Sundaramahalingam A (2000) Studies on socioeconomic of coral reef resource users in the Gulf of Mannar coast, south India. Final report, Centre for Marine and Coastal studies, Madurai Kamaraj University, Madurai, p. 1-163.
- Thangaradjou T, Sridhar R, Senthilkumar S, Kannan L (2008) Seagrass resources assessment in the islands and Mandapam coast of the Gulf of Mannar Biosphere Reserve, India. Applied Ecology Environmental Research 6: 139-146.
- Umamaheswari R, Ramachandran S, Nobi EP (2009) Mapping the extend of seagrass meadows of Gulf of Mannar Biosphere Reserve, India using IRS ID satellite imagery. International Journal of Biodiversity and Conservation 1: 187-193.
- Mahadevan S, Nayar KN (1972) Distribution of coral reefs in the Gulf of Mannar and Palk Bay and their exploitation and utilization. In: Symposium On Corals and Coral reefs. Journal of Marine Biological Association of India. p.181-190.
- Ganesan M, Kannan L (1995) Seasonal distribution of intertidal seaweeds and seagrasses at two selected places of the Gulf of Mannar. Phykos 34: 135-144.
- Kannan, L, Thangaradjou T, Anantharaman P (1999) Status of seagrasses of India. Seaweed Research Utility 21: 25-33.
- Manikandan S, Ganesapandian S, Singh M, Kumaraguru AK (2011) Seagrass Diversity and Associated Flora and Fauna in the Coral Reef Ecosystem of the Gulf of Mannar, Southeast Coast of India. Research Journal of Environmental and Earth Sciences 3: 321-326.
- Jagtap TG, Komarpant DS, Rodrigues RS (2003) Status of a seagrass ecosystem: An ecologically sensitive wetland habitat from India. The Society of Wetland Scientists; Wetlands, Wilmington NC, 23: 161-170.
- Mohan RS (1986) Fish and Fisheries of Mandapam. In: Mohan RSL (Editor) Mandapam and its Environs. Souvenir, pp. 32-33.
- Venkataraman K, Wafar M (2005) Coastal and marine biodiversity of India. Indian Jouranal of Marine Scinces 34: 57-75.
- APHA (2005) Standard methods for examination of water and waste water. 21st Edition, Washington DC.
- Strickland JDH, Parsons TR (1972) A practical handbook of seawater analysis. Second Edition, Bulletin 167. Fisheries Research Board of Canada, Ottawa.
- Gardiner JS (1901) The fauna and geography of the Maldive and Laccadive Archipelagoes: Vol. 1. At the University Press, Cambridge.
- Kinsman DJJ (1964) Reef coral tolerance of high temperatures and salinities. Nature 202: 1280-1282.
- Coles SL, Jokiel PL, Lewis CR (1976) Thermal tolerance in tropical versus subtropical Pacific reef corals. Pacific Sciences 30: 159-166.
- Soundarapandian P, Premkumar T, Dinakaran GK (2009) Studies on the physico-chemical characteristic and nutrients in the Uppanar estuary of Cuddalore, South east coast of India. Current Research Journal of Biological Sciences 1: 102-105.
- Hoegh-Guldberg O, Smith JG (1989) The effect of sudden changes in temperature, light and salinity on the population density and export of zooxanthellae from the reef corals Stylophora pistillata Esper and Seriatopora hystrix Dana. Journal of Experimental Marine Biology and Ecology 129: 279-303.
- Sridhar R, Thangaradjou T, Kumar SS, Kannan L (2006) Water quality and phytoplankton characteristics in the Palk Bay, southeast coast of India. Journal of Environmental Biology 27: 561-566.
- Upadhyay S (1988) Physico-chemical characteristics of the Mahanadi estuarine ecosystem, east coast of India. Indian Journal of Marine Sciences 17: 19-23.
- Saravanakumar A, Rajkumar M, Serebiah JS, Thivakaran GA (2008) Seasonal variations in physico-chemical characteristics of water, sediment and soil texture in arid zone mangroves of Kachchh-Gujarat. Journal Environmental Biology 29: 725-732.
- Ramanathan N, Padmavathy P, Francis T, Athithian S, Selvaranjitham N (2005) Manual on polyculture of tiger shrimp and carps in freshwater. Tamil Nadu Veterinary and Animal Sciences University, Fisheries College and Research Institute, Thothukudi, pp. 1-161.
- Hendrinks IE, Olsen YS, Ramajo L, Basso L, Moore TS, et al. (2014) Photosynthestic activity buffers ocean acidification in seagrass meadows. Biogeosciences Discuss, 11: 333-346.
- Frankignoulle M, Disteche A (1984) CO2 chemistry in the water column above a Posidonia seagrass bed and related air-sea exchanges. Oceanologica Acta 7: 209-219.
- Frankingnoulle M, Bouquegneau JM (1990) Daily and yearly variations of total inorganic carbon in a productive coastal area. Estuarine, Coastal and Shelf Science 30: 79-89.
- Invers O, Romero J, Perez M (1997) Effects of pH on seagrass photosynthesis: a laboratory and field assessment. Aquatic Botany 59: 185-194.
- NLWRA (National Land and Water Resources Audit) (2002) Australian catchment, river and estuary assessment. National Land and Water Resources Audit (NLWRA), Vol. 1.
- Marichamy R, Gopinathan CP, Siraimeetan P (1985) Studies on primary and secondary production in relation to hydrography in the inshore waters of Tuticorin. Journal of the Marine Biological Association of India 27: 129-137.
- Arumugam A, Sugritha PK (2014) Evaluation of physico-chemical parameters and nutrients in the Mangrove ecosystem of Manakuty estuary, southwest coast of India. International Journal of Latest Research in Science and Technology 3: 205-209.
- Shrestha S, Kazama F (2007) Assessment of surface water quality using multivariate statistical techniques: A case study of the Fuji river basin. Japan. Environmental Modelling & Software 22: 464-475.
- Bapat SV (1955) A preliminary study of the pelagic fish eggs and larvae of the Gulf of Mannar and the Palk Bay. Indian Journal of Fisheries 2: 231-255.
- Abowei JFN (2010) Salinity, dissolved oxygen, pH and surface water temperature conditions in Nkoro river, Niger delta, Nigeria. Advance Journal of Food Science and Technology 2: 36-40.
Citation: Sundararajan S, Kamalakannan B, Karthikeyan R, Khadanga MK, Jena BK (2018) Diurnal Variation and Water Quality Parameters of Three Different Ecosystems in Gulf of Mannar, Southeast Coast of India. J Marine Sci Res Dev 8: 252. DOI: 10.4172/2155-9910.1000252
Copyright: ©2018 Sundararajan S. et al. This is an open-access article distributed under the terms of the Creative Commons Attribution License, which permits unrestricted use, distribution, and reproduction in any medium, provided the original author and source are credited.
Select your language of interest to view the total content in your interested language
Share This Article
Recommended Journals
Open Access Journals
Article Tools
Article Usage
- Total views: 6234
- [From(publication date): 0-2018 - Dec 13, 2025]
- Breakdown by view type
- HTML page views: 5183
- PDF downloads: 1051