Ecological Study of the Rabigh Lagoon, Eastern Site of the Red Sea, Saudi Arabia with Special Reference to Eutrophication Index
Received: 29-Sep-2017 / Accepted Date: 11-Oct-2017 / Published Date: 16-Oct-2017 DOI: 10.4172/2155-9910.1000242
Abstract
Seasonal variation in plankton community structure (phytoplankton and zooplankton), chlorophyll a and some physico-chemical properties of Rabigh Lagoon were studied during 2015. The study area included seven sites situated between latitudes 22.9978° to 22.8519° and longitudes 38.8339° to 38.9616°E. The ecological parameters comprise some physical and chemical parameters as Temperature, Secchi Disc, pH, DO, S%, Nutrients “Nitrite, NO2-N; Nitrate, NO3-N; Ammonia, NH3-N; total nitrogen, T-N; Reactive phosphate, PO4-P and total phosphorus, T-P”. A total of 103 species belonging to five phytoplanktonic groups were identified. The most leadings group is Bacillariophyceae (45.05%) then Cyanophyceae (33.83%) followed by Dinophyceae (20.99%). On the other hand, Chrysophyceae (0.07%). and Chlorophyceae (0.05) are considered a rare group. Chlorophyll a showed almost the same pattern with the standing crops of the phytoplankton ranged between 12.33 μg l-1 during spring and a lowest value of 5.49 μg l-1 during summer. The most dominant group of zooplankton was Copepoda (89.00%) followed by Protista (7.30%) and Rotifera (3.70%). The maximum peak of Copepoda was recorded during all the investigation period except autumn. The Diversity Index fluctuated between 2.785 during autumn and 3.568 during summer. The calculating of trophic status index according to Secchi Disc methods was found to be better than chlorophyll a and total phosphorus methods. The analysis showed that Rabigh Khore is a mesotrophic ecosystem. Canonical correspondence analysis (CCA) was additionally completed to break down the relations between the physico- Chemical parameters and the plankton. It showed that the most important factors affecting plankton distribution.
Keywords: Rabigh Lagoon; Phytoplankton; Zooplankton; Trophic status index; Diversity index; Canonical corresponding analysis
Introduction
One of the main factors controlling human and animal common health is considered to be the aquatic environment and its water quality. Water contamination is most regularly connected with the release of effluents from sewers or sewage treatment plants, channels and production lines to the water body of either marine or freshwater ecosystems [1]. The marine ecosystem is a particularly superfine environment which is highly susceptible to the effects of human activities [2].
The Red Sea, as a conical shaped inland sea between the Arabian Peninsula of western Asia and the northeastern part of Africa, possesses an uncommon position among the marine basins. It broadens SE-NW between: 12°N, 43°E and 30°N, 32°E and has a surface area of 44000 km2, with a greatest profundity of 3,040 m, and a maximum width of 354 km [3]. It communicates at its northern end with the Mediterranean Sea through the manmade Suez Canal and at its southern end with the Indian Ocean through the strait of Dab el-Mandab.
The Red Sea contains an assortment of marine habitat, with globally perceived protection, logical, economic or for entertaining value [4]. The noteworthiness for preservation and protection arises both from man’s utilization of habitats from the worldwide changes. This sea characterized by rising the salinity values southwards as a result of increasing surface temperature [5-7]. This phenomena lead to making the Red Sea one of the most saline water bodies as well as warmest.
The Red Sea coast of Saudi Arabia characterized by many lagoons such as inlets, embayment’s, khore’s and sharms. The expression “sharm” has been privately used to represent the tidal ponds found on the eastern side of the Red Sea, and they are described by a tight, profound, and lengthened outline. Lagoons ecology is strongly influenced from the local weather conditions such as air and water temperature as well as other physico-chemical properties [8-10]. These lagoons are exceptionally shallow basins that associate with the Red Sea waters by means of thin and shallow channels (mouths), and their Intertidal and supratidal sabkha pads, roughly 4 km wide, are typically limited to some of these lagoons and are possessed by two sorts of communities, mangroves (Avicennia marina) at the intertidal zones and algal mats at the upper intertidal and supratidal areas [11].
The plankton of the Red Sea has been beforehand considered by a few authors, Aleem [12], recorded 16 species of blue green algae and 27 species of Chlorophyta at the area of Obhor, Jeddah. Dowidar and Raheem El-Din [13] carried out a qualitative and quantitative study of neritic phytoplankton populations in the region of Obhor, north of Jeddah, and they recorded 112 diatom and 111 dinoflagellate species, most of them being new records in the Red Sea. In addition, they also recorded the maximum standing crop of phytoplankton during summer months. Shaikh [14] determined the annual cycle of the phytoplankton as a result of seasonal monsoonal influence in the Jeddah area of the Red Sea. Khalil and Ibrahim [15] reported diatoms as the most dominant and numerous phytoplankton and they recorded 124 species of phytoplankton in north of Jeddah. Furthermore, the results of their investigation elucidated an inverse relation between dinoflagellates and diatoms. Recently, Touliabah [16], in a study of succession dynamics of phytoplankton across a range of ecological parameters of some water bodies at the Jeddah Coastline of Saudi Arabia that was carried in 2004, showed that the maximum peak of phytoplankton abundance was during spring while the minor peak was recorded during winter. In addition, they also identified 73 genera and 5 phytoplanktonic groups during the period of their investigation. Nassar [17] recorded the high abundance of Red Sea plankton during autumn due to the high flourishing of diatoms. Qurban [18,19] reported that, the primary productivity of the phytoplankton of the northern Red Sea of Saudi Arabia was affected by nitrogen. Wafar [20] discussed the inorganic nutrients were increased southwards of the Red Sea basin.
Zooplankton of the Red Sea were also studied in several researches, Bottger-Schnac [21] reported decrease in total zooplankton abundance from south to north in central part of the Red Sea and Aden Gulf. He also noticed that 19 species of copepods were highly abundant in the Red Sea. Al-Aidaroos [22] reported that, the increasing the mortality of zooplankton were associated with the high illumination of the sun light especially in oligotrophic basin.
Pearman [22-24] focused in his research about zooplankton communities were associated with coral reefs. On the other hand, Cornils [25], stated that Calanoid copepods were found to dominate subtropical mesozooplankton communities of the northern part of the Red Sea.
Thiennemann [26] and Naumann [27] were the principal researchers to utilize the expression “eutrophic” that implies excess of nutrients, and “eutrophication” that alludes to the procedure by which water bodies developed more profitable, keeping in mind the end goal to describe water bodies frameworks in Sweden. While, Nixon [28] proposed that eutrophication is “an expansion in the rate of supply of natural matter in an ecosystem”. Consequently, physical parameters together with supplement nutrient levels are factors controlling the structure of phytoplankton [29]. Structure study of phytoplankton has for assessing trophic status [30,31]. These autotrophic living beings respond rapidly to changes in the ecosystem, which are reflected by the temporal and spatial changeability in the phytoplankton communities [32,33].
The dangerous impact of eutrophication on the waterfront marine condition worldwide has been previously addressed by Vollenweider [34]. The marine coastal eutrophication has turned out to be more regular over the late years; words like `oligotrophy’, `meso-trophy’ and `eutrophy’ (this terminology was created by limnologists to represent the trophic states of water bodies) have additionally turned out to be more incessant in marine reviews [35,36]. The unsafe impacts of eutrophication on the marine waterbodies vary from one region to another and even within the same region from one site to another. There is a general conformity that oligotrophy implies supplement poor in nutrients whereas eutrophy implies nutrient rich waters. Moncheva [37] attempted to assess the scaling of trophic status index of eutrophication along the Bulgarian Black Sea coastal basin as an indicator of the marine coastal area ecological quality. The eutrophication index was used as a tool to evaluate the water quality of any aquatic water bodies [38].
According to European regulations, environmental data, such as the concentration of total phosphorus (TP), total nitrogen (TN), and chlorophyll a (Chl a) as well as the Secchi depth are basic trophic state indices [39,40]. In addition to these basic ones, there are many other trophic state indices and empirical models that can be treated as measures of the degree of water eutrophication. João [41] revealed that enrichment of waters by nitrogen as well as phosphorus-based supplements drives the process of eutrophication, which thus prompts an increase of algal development, primary productivity and biomass, and in addition it aggravates the adjust of creatures and causes corruption of the water quality. Subsequently, debasement of the biological system wellbeing or potentially the supportable arrangement of merchandise and ventures are two of the primary bothersome results of eutrophication. Gupta [42] discussed a new detailed model of TSI in view of NO2-N with between correlation with TSI in view of Chlorophyll a, and Secchi Disk (SD) for Chilika tidal pond (India) eutrophication status.
Rabigh is a town on the western coast of Saudi Arabia (Red Sea) with a rich history dating back to the ancient Islamic times. The climate of Rabigh is characterized by extreme heat especially during the summer months, but its temperature also rises somewhat during the winter time, and relative humidity, especially in the summer with rare falling rains. Little information is known about the Rabigh Lagoon (aka. Al-Kharrar Lagoon) despite its importance to the Rabigh area. Recent urban and industrial development, mainly due to the campus of Petro-Rabigh that is located on the beach of the lagoon, has begun to exert a significant impact upon the lagoon’s ecology.
A recent study by Al-Dubai [10] reported the common environmental factors such as pH, temperature, salinity, dissolved oxygen (DO), and bathymetry effective on the flora and macro-fauna of the Rabigh Lagoon. Other studies on the Rabigh lagoon were focused on its mineralogical, sedimentological, hydrographic features and geochemical aspects as well as some of the microfossils [43-48].
Last but not least, the Rabigh Lagoon hosts an important mangrove population of Avicenna marina species, which maintains the regulation and optimization relationship of this tropical marine environment. Mangroves area considered a place for keeping the primary producers that provide the base of the complex food web. Regardless of the richness of the mangrove environments with organic matter, such frameworks have a tendency to be supplement insufficient, particularly in nitrogen and phosphorus [49-52].
The objective of this study has several aspects, (1) to elucidate on the dynamic distribution of the plankton community in selected sites of the lagoon; (2) to identify the relationships between phytoplankton succession and their control factors due to environmental parameters; and (3) to analyze the various trophic state indices (Secchi Disc (TSISD), Chlorophyll a (TSICHL) and Total Phosphorus (TSITP) in order to further estimate the eutrophy of the Rabigh Lagoon as well as the diversity index and richness of the phytoplankton community during the period of our investigation.
Materials and Methods
Sampling sites
The Rabigh Lagoon situated around 140 km north of the city of Jeddah on the eastern shore of the Red Sea, with an approximately area of roughly 60 km2. Seven main sites of the Rabigh lagoon (it’s called Rabigh Khore or Al-Kharrar) were chosen to represent the area under investigation. These sites are situated between latitudes 22.9978° to 22.8519° and longitudes 38.8339° to 38.9616°E (Figure 1). The average depth of the lagoon is 4.57 m and it has an elongated shape with the long axis (20.21 Km length) parallel to the Red Sea coast and with an average width of 3.18 Km. The Rabigh Lagoon is linked to the adjacent Red Sea at the northwestern side by a narrow, deep inlet (depth about 22 m) while in the southern part it is connected to the Rabigh area. The two small islands inside the Khore host a mangrove population of Avicenna marina species. During periods of flood or stream, water overloads may enter from any direction around the lagoon. The description of the site description is summarized in Table 1 and Figure 1.
| Site number | Description | Lat | Long | Remarks about sediment |
|---|---|---|---|---|
| Site 1 | In front of Border Guards by 300 m (Al-Kharrar Site) | 22.9729° 22°58'22.74"N |
38.8471° 38°50'49.39"E |
Mostly Brown Gravelly and minor of sand sediments |
| Site 2 | Lye in the southeast of Al-Kharrar site by about 600 m | 22.9636° 22°57'49.08"N |
38.8605° 38°51'37.88"E |
Gray mud with sea grasses |
| Site 3 | Beside the South East elongated First Island named Om El-Ebeel island | 22.9418° 22°56'30.45"N |
38.8734° 38°52'24.19"E |
Black mud with sea grasses |
| Site 4 | Near from Lagoon – east middle of the lagoon- The coomon name is Alsanany | 22.9453° 22°56'43.18"N |
38.9055° 38°54'19.92"E |
Black mud with minor seagrasses |
| Site 5 | North head Om El-Sheek Island | 22.9076° 22°54'27.20"N |
38.9199° 38°55'11.47"E |
Black, Sandy |
| Site 6 | South of Ras El-Sheek Island | 22.8756° 22°52'32.20"N |
38.9431° 38°56'35.13"E |
Gray, Black Mud with Seagrass |
| Site 7 | El-Kaar or Makar Elsabeel | 22.8593° 22°51'33.42"N |
38.9523° 38°57'8.44"E |
Gray Black mud |
Table 1: Description and location of collecting sites.
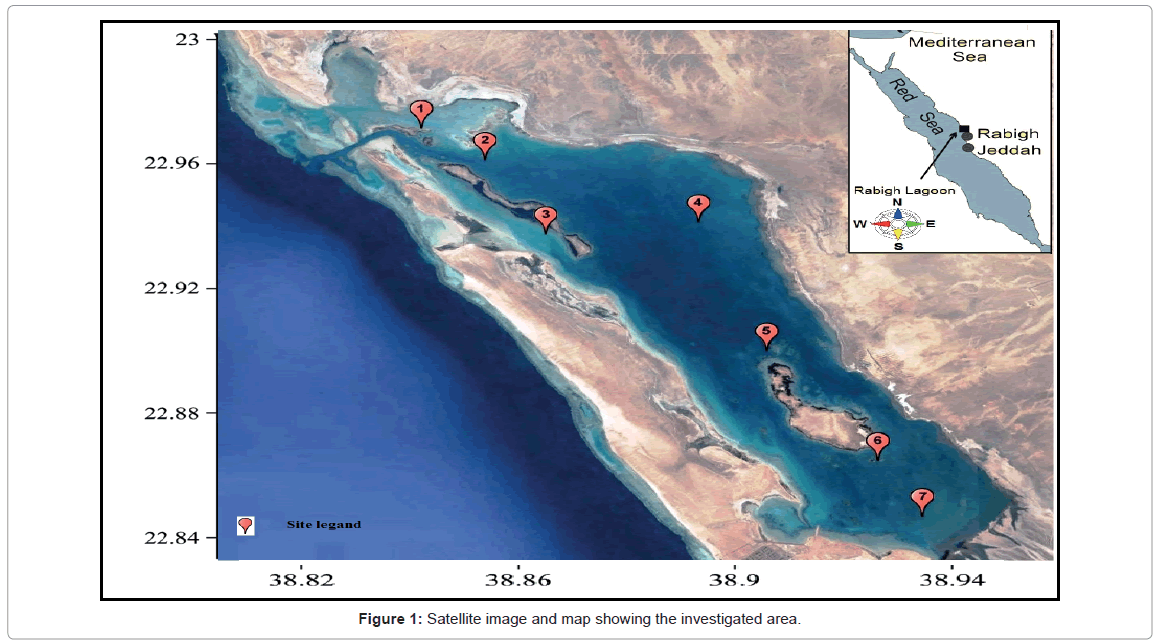
Figure 1: Satellite image and map showing the investigated area.
Physico-chemical measurements
The hydro-chemical parameters such as water depth (measured by Ecosounder-UWTEC), temperature, salinity‰, pH and dissolved oxygen (DO) were measured in situ using a YSI 556 MPS Meter. Transparency (SD) was detected by lowering the Secchi Disc (25 cm in Diameter) colored by black and white surface.
Subsurface water samples were collected seasonally from each sampling site in 2015 using a Polyvinyl Chloride Sampler. Physicochemical parameters were estimated depending on the standard methods of examination of water and wastewater [53]. The measured parameters were Nitrite-Nitrogen (NO2-N), Nitrate-Nitrogen (NO3-N), Ammonia-Nitrogen (NH3-N), Total Nitrogen (TN), Reactive phosphate (PO4-P) and Total Phosphorus (TP).
Plankton
The phytoplankton samples were processed by applying the standard methodology [53-56]. Species identification was performed under an embedded system using an NLCD-301 microscope with a digital camera at x400 and x1000 magnification by using Palmer – Maloney counting chambers. Identification was carried out according to [57-59] protocols.
The chlorophyll a levels were estimated spectrophotometrically [60] by utilizing the equations of Jeffrey [61] and Lorentzen [62].
The zooplankton tests were gathered with tiny plankton net (25 cm diameter and 100 μm mesh size) and immediately fixed with 4% formalin, and the identification to the species level utilizing a binocular microscope. Moreover, species abundance quantification analysis was performed by Dimov’s approach [63].
Statistical analysis
Diversity index: The diversity index, a classical measure of stability, was calculated according to Shannon [64] and Heip [65].
Trophic status index: The trophic state was determined by the Trophic State Index (TSI) using a logarithmic of the chlorophyll a concentration (Chl a), Secchi depth (SD) and total phosphorus (TP) [66], according to the Kratzer [38] modification shown in the following equations:
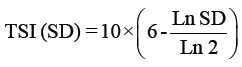
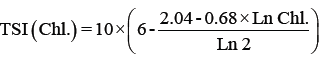
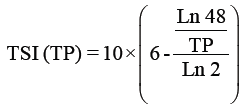
Where
TSI: Trophic Status Index.
SD: Secci Disc Readings by meters.
TP: Total phosphorus readings by μg/l.
Chl.: Chlorophyll a by μg/l.
Cluster analysis: A cluster analysis was performed according to Sørensen [67] in order to divide the studied area into homogenous sites based on the similarities in plankton species’ composition.
Canonical correspondence analysis (CCA): CCAs of the planktonic groups against the obtainable physico-chemical parameters were performed according to the Ter Braak [68,69] method using the MVSP 3.12b multivariate statistical package software [70].
Results And Discussion
Throughout the present study, air and water temperatures took the ordinary cycle for the transient areas with variance between the highest water and air temperature of (32°C-43°C) during summer and the lowest temperature (20°C-26°C) during winter. The profusion of the water temperature was impressively lower than the relating recorded of the air. The regional fluctuation of temperature is presented in Figure 2.
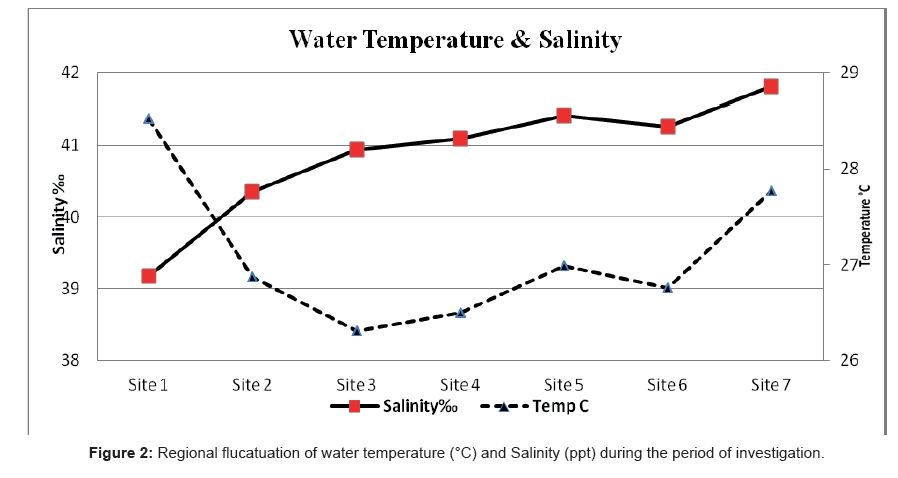
Figure 2: Regional flucatuation of water temperature (°C) and Salinity (ppt) during the period of investigation.
The depth profiles of the study sites showed a considerable decrease toward the south part of the lagoon at site 1 (Al-Kharrar Site), where the maximum depth was 12.65 m. On the other hand the deepest value was recorded at site 7 and it was 0.9 m (El-Kaar or Makar Elsabeel). The regional changes of the bottom profile in relation to the transparency (Secch Disc “SD”) are summarized in Figure 3.
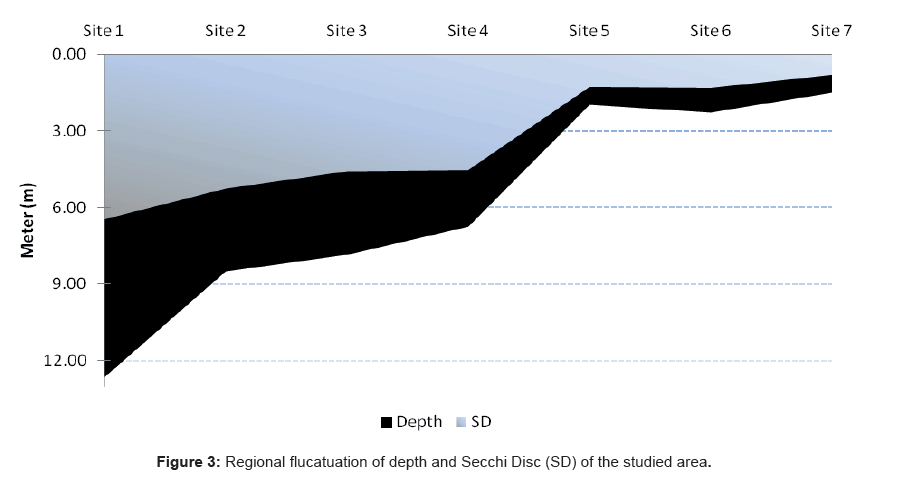
Figure 3: Regional flucatuation of depth and Secchi Disc (SD) of the studied area.
The water transparency decreased gradually towards the southeastern side of the lagoon. The regional average water transparency ranged between 0.8 m at site 7 as a result of flood drainage and the nature of a muddy bottom at this site and 6.45 m at site 1 (Table 1 and Figure 2). The reduction of the transparency due to the slit may be coming from Kharar Elsabeel, on the south-west of the lagoon. It has been previously shown that water transparency can be decreased by either turbidity (suspended matter in the water column that affects the passage of light) or high plankton abundance. Depending on the corresponding analysis, the transparency was correlated positively with Dinophyceae and negatively with Bacillariophyceae. Our results were agreed by the data obtained by Ganai and Parveen [71]. Ganai and Parveen [71] reported that, transparency one of the most important factor affecting on the turbidity as well as on the plankton in in Wular Lake at Lankrishipora, Kashmir. There is an inverse relation between the transparency (SD) and total phytoplankton (r =- 0.81), chlorophyll a (r =- 0.85) and TSI based on SD (r=-0.89). The obtained results agree with a previous report by Hariri and Abu-Zied [72] that showed heavy metal concentrations in the sediments of the Rabigh Lagoon and the brine pool of Salman Bay on the eastern Red Sea coast of Saudi Arabia.
The salinity of the Rabigh Lagoon showed a remarkable increase southwards even during the summer season. This may be attributed to the high evaporation rates. Salinity ranged between 37.41% recorded at Site 1 during winter and 43.00% recorded at Site 5 during summer. The average salinity during the period of investigation was 40.23% ± 2.17% (Figure 2).
The lowest salinity was recorded at site 1 (entrance of the lagoon) and this fact may be attributed to the replace of water between the lagoon and the Red Sea. Similar results were shown by Ahmad and Sultan [73], who reported such water exchange as a response to the multiplicity of meteorological forces (e.g. tide, wind) in the Shuaiba Lagoon (on the Eastern Coast of the Red Sea).
The Red Sea is a special zone in the tropics for several reasons. It is incompletely separated from the open Indian Ocean, there is no stream inflow and powerless precipitation is confined during the period from October to May. It has a high net evaporation rate due to the high temperature and the bright vitality, which consistently leads to high salinities.
The tenth report of the joint panel on oceanographic tables of the UNESCO organization reported that lagoons possess around 15% of the world’s coastal zone [35]. The same report showed that a large number of faunal species incidentally live in tidal lagoons that offer an ideal habitat for proliferation [35].The physico-chemical parameters of the lagoons play an essential factor for the whole aquatic ecosystem. The limited area and shallow waters of lagoons can contribute to the rapid changes in temperature, salinity and other abiotic factors observed in these microenvironments [71,74].
Our pH results confirm alkaline nature of the Rabigh Lagoon. The regional average showed the pH values fluctuated between 8.82 at site 2 to 8.90 at site 5. The average pH value during the period of investigation was 8.86. The pH is a vital water quality parameter that influences the solubility of minerals in the water column. Variations in the pH values can be influenced by the photosynthesis and respiration cycles of plankton growth in eutrophic waters. This suggests that the pH values could be utilized as a marker of phytoplankton development and eutrophication of waters. Here we show an inverse correlation between pH and Bacillariophyceae abundance (r=- 0.67).
DO is the most basic parameter for living biota occupying the aquatic environment. Sources of DO in water include the climatic air circulation and the photosynthetic exercises of the aquatic flora. The values of the dissolved oxygen reported in the present study fluctuated between 5.04 mg l-1 at Site 2 during summer and 7.44 mg l-1 at site 7 during spring. The average value of DO during the entire period of study was 6.54 mg l-1 ± 0.67. These variations may be related to the difference in the photosynthesis processes.
The variations of the dissolved inorganic nitrogen, total nitrogen, orthophosphate and total nitrogen are summarized in Figure 4. The values of nitrate and nitrate observed peaked during spring while ammonia values peaked during winter. Dissolved inorganic nitrogen (DIN = NO3 + NO2 + NH3) concentrations fluctuated between 3.83 ± 0.34 (μg l-1) in the spring and 5.05 ± 0.17 (μg l-1) in the winter. Ammonia was the major constituent during the period of our study. It fluctuated significantly throughout the sampling period (0.93μg l-1 at site 2 during spring and 4.25 μg l-1 at site 3 during autumn and winter). The conveyance of nitrite showed pretty much a comparable dispersion design as ammonia. The seasonal average of total nitrogen fluctuated between a minimum of 0.19 ± 0.01 mg l-1 during spring and a maximum of 0.17 - 0.88 mg l-1 during winter. The lowest value was recorded at site 4 during spring and the maximum one at site 3 during winter. Phosphate concentrations varied from 0.28 μg l-1 at site 2 during autumn to 1.28 μg l-1 at site 3 during winter, with a regional average of 0.84 μg l-1. Similar data were obtained by Touliabah [4] in their article about a number of pools at the Jeddah Corniche.
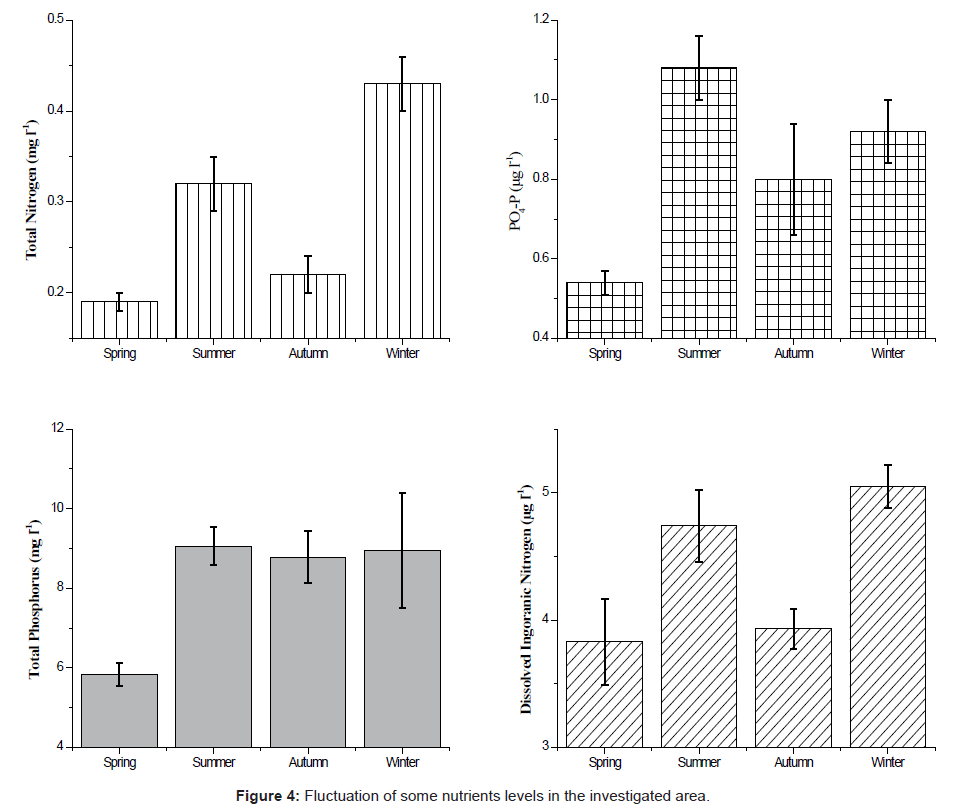
Figure 4: Fluctuation of some nutrients levels in the investigated area.
The total phytoplankton composition of the Rabigh Lagoon during the period of our study is shown in contour Figure 5. A total of 103 species of the phytoplankton community belonging to five phytoplankton groups were identified. These phytoplankton groups are Bacillariophyceae, Dinophyceae, Cyanophyceae, Chlorophyceae and Chrysophyceae depending on the dominancy. The general pattern of phytoplankton crops revealed that, their values at the northern sites gradually decreased up to site 4, then gradually increased at the southern sites. The maximum value of 116.2 × 10³ Cells l-1 phytoplankton was recorded during spring at site 6, while the minimum value 41.52 × 10³ Cells l-1 was recorded at winter. The detailed of the average seasonal variations of the phytoplankton standing crop fluctuated between 57.99 × 10³ Cells l-1 at site 4 and 86.97 × 10³ Cells l-1 at site 6. The total phytoplankton crops ranged from the lowest value 41.93 × 10³ Cells l-1 at site 4 and the highest value 115.10 × 10³ Cells l-1 at site 6 during autumn.
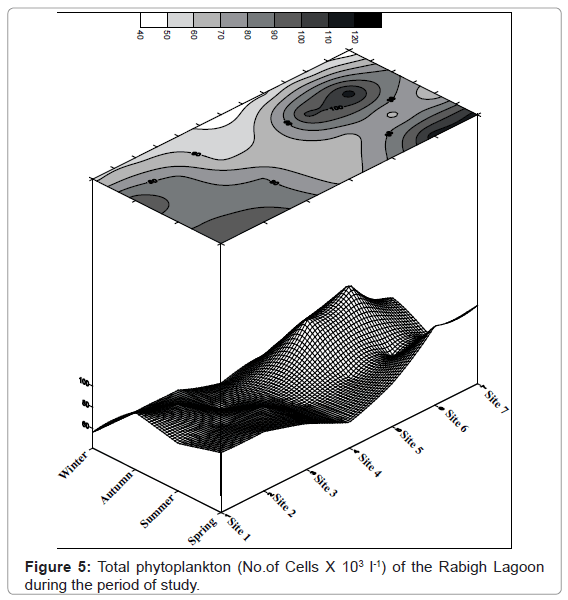
Figure 5: Total phytoplankton (No.of Cells X 103 l-1) of the Rabigh Lagoon during the period of study.
Figure 6 shows the percentage abundances of each class composition of phytoplankton in the studied areas. During the present investigation, the most abundant groups were, Bacillariophyceae, Cyanophyceae and Dinophyceae. They formed 45.05%, 33.83% and 20.99% of the total phytoplankton standing crop, respectively. Chrysophyceae and Chlorophyceae represented rare groups in the studied areas with a percentage frequency of 0.07% and 0.05% of the total phytoplankton respectively.
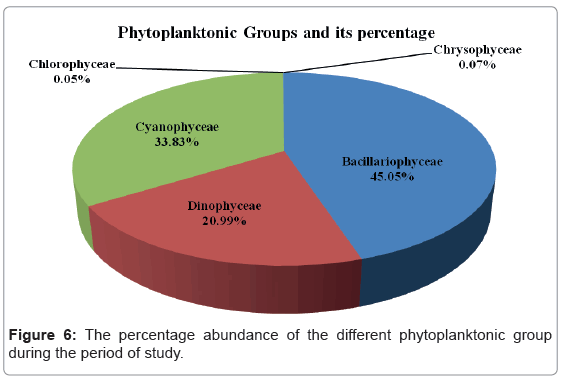
Figure 6: The percentage abundance of the different phytoplanktonic group during the period of study.
The phytoplankton composition is affected by two main important environmental factors. The first one is related to physical processes such as mixing due to turbulence and the second one is associated with the nutrients as well as some of the phytoplanktonic groups. Here we show a direct relation between total phytoplankton and dissolved oxygen (r=0.65), Bacillariophyceae (r=0.83), Cyanophyceae (r=0.66) and the calculated trophic status index dependent on chlorophyll a (r=0.71). On the other hand, total phytoplankton exhibited an inverse relation with NH3-N (r=- 0.64) and pH (r=-0.65). These findings agree with the previous data obtained by Buzzi [75], Touliabah [4,16,76]. Touliabah and Taylor [76] reported that, the phytoplankton blooms in the Bitter Lakes (Egypt) were highly correlated with the environmental properties than any other factor. The clarification of phytoplankton response to these variables is necessary for understanding hydrological differences in such coastal basin [76-78]. Besides their importance as primary producers in food webs and make certain ecological balance, species of phytoplankton can be useful indicators of the water quality [79]. Shaikh [14] determined the annual cycle of phytoplankton species as the result of seasonal monsoonal influences exerted in the general vicinity of Jeddah, and they showed that the biomass and production of the phytoplankton peaked during the winter and summer months (1977-1978).
The standing crop of the Bacillariophyceae reached its highest values during the period of our study, with the exception of the summer season, during which their standing crop was the second highest after Cyanophyceae (Figure 7). Members of Bacillariophyceae were the most predominant during the study period, except for summer period during which they were the second most predominant species. Bacillariophyceae were the most abundant accounting for 45.05% of the total plankton community. A total of 44 diatom species were recognized in the study areas. Depending on the seasonal variation, two peaks were recorded, one during spring (50.38 × 10³ Cells l-1) and another one in autumn (35.04 × 10³ Cells l-1). On the other hand the lowest standing crop of Bacillariophyceae was recorded during summer (21.27 × 10³ Cells l-1).
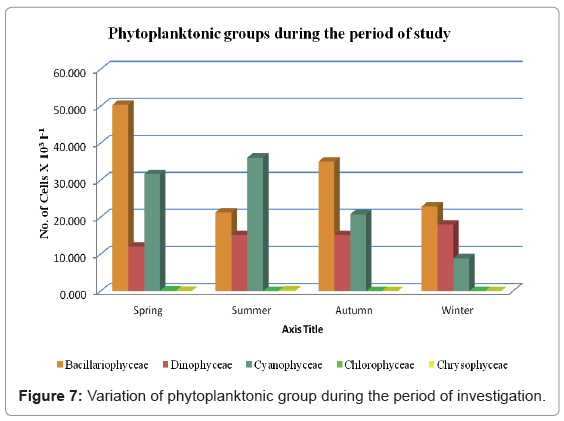
Figure 7: Variation of phytoplanktonic group during the period of investigation.
The highest population density of the Bacillariophyceae was 15.95 × 10³ Cells l-1 and it was recorded at El-Kaar (site 7) in the summer, which comprised 25.76% of the total phytoplankton standing crop. On the other hand, the least diatoms crop of 66.83 × 10³ Cells l-1 was observed at the same location of Al-Khaar (site 7) in the spring, forming 57.88% of the total phytoplankton crop.
Depending on the seasonal average of Bacillariophyceae, the leading diatom species were representing 32.13% of the total Bacillariophyceae. The population densities and percentage abundance of the most leading species are shown in Figure 8.
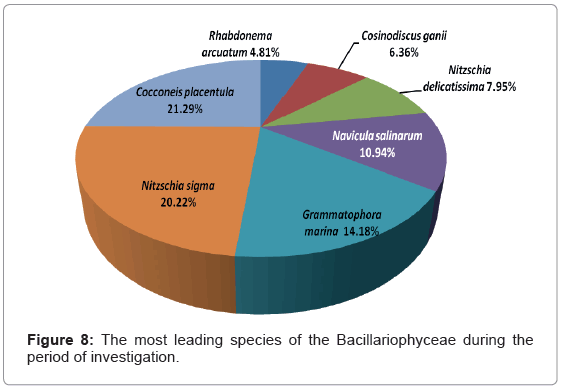
Figure 8: The most leading species of the Bacillariophyceae during the period of investigation.
Our data agree to some extent with the data obtained by Touliabah [4,16] and Sawai [80].Touliabah [16] recorded the Bacillariophyceae as the second dominant group after Dinophyceae. They reported that, the percentage abundance of this group was 27.9% of the total phytoplankton standing crop in Jeddah. In that article, they recorded 39 species of the Bacillariophyceae. Our data revealed that, there are some leading species such as Cocconeis placentula Ehrenberg and Nitzschia sigma (Kutz.) W. Smith that was recorded as the chief species in Touliabah [16]. Touliabah [4] reported the Bacillariophyceae as the second most predominant group (26.01% of the total phytoplankton crop) after the Cyanophyceae group in some saline pools of the coastal area of Jeddah. The chief species were Pseudo-nitzschia delicatissima (Cleve) Heiden, Nitzschia sigma (Kützing) Smith and Nitzschia longissima (Brebission).
Cyanophyceae occupied the second most predominant position, contributing 33.83% of the total plankton community. A total of 29 species were identified in the study areas. The seasonal variations of Cyanophyceae are shown in Figure 7. Here we have recorded two peaks, the minor one was during spring (32.50% of the total Cyanophyceae) while the maximum one was during summer (37.06% of the total Cyanophyceae). Furthermore, the lowest population density of Cyanophyceae was observed during winter (9.11% of the total bluegreen algae).
The total population density of Cyanophyceae fluctuated between a maximum value of 43.85 × 10³ Units l-1 at site 4 in the summer and a minimum value of 7.33 × 10³ Units l-1 at site 2 in the spring. Cyanophyceae were the dominant group during the summer season across the investigation area. The most leading species of the blue-green algae were Merismopedia punctata Meyen, Lyngbya spiralis Geitler, Phormidium fragile (Meneghini) Gomont, Lyngbya epiphytica Hieron and Trichodesmium erythraeum Ehrenberg, which were previously registered as marine species [81].
Our Cyanophyceae data agree with the data obtained by Yerli [82], who reported that the Cyanophyceae blooms in Lake Mogan (Turkey) were present in the summer season, a feature that distinguishes the eutrophic lakes especially in northern temperate regions.
Members of Dinophyceae occupied the third most predominant position, contributing 20.99% of the total plankton during this study (Figure 9). Twenty five species were identified with a total population density of ranging between a maximum of 47.52 × 10³ Cells l-1 at site 6 during autumn and a minimum value of 8.32 × 10³ Cells l-1 at site 3 in the summer (forming 41.29% and 10.31% of the total dinoflagellates, respectively). The population density of this group was remarkably higher during autumn across the investigation area. During the present study, the most leading species of Pyrrophyceae were Gonyaulax sp., Ceratium breve (Ostenfeld and Shhmidt) Shroder, Ceratium lineatum (Ehrenberg) Cleve, Protoperidinium globulum Jorgensen, Protoperidinium bipes Paulsen and Ceratium gracile (Gourret) Jorgensen. Dowidar [83] identified 51 of the Ceratium species, of which 23 species were new records during his study of the seasonal and spatial distribution of Ceratium species in the central and northern Red Sea.
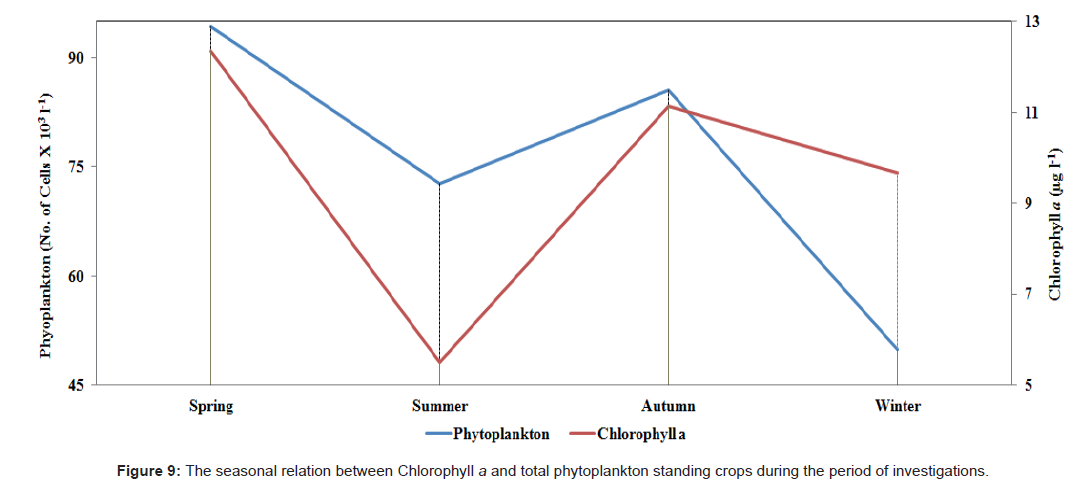
Figure 9: The seasonal relation between Chlorophyll a and total phytoplankton standing crops during the period of investigations.
In addition, we showed that Chlorophyceae (only Dunaliella sp.) and Chrysophyceae (only Dictyocha fibula Ehrenberg) represented rare groups with a percentage frequency of 0.05% and 0.07% of the total phytoplankton respectively.
Chlorophyll a showed almost the same pattern with the standing crops of the phytoplankton, fluctuating between a maximum value of 12.33 μg l-1 during spring and a lowest value of 5.49 μg l-1 during summer. The relationship between concentration of chlorophyll a and phytoplankton standing crop was calculated, and we confirmed their clear correlation (r=0.72). Also, the values of the standing crops of plankton observed during these investigations are analogous to the observed values from previous studies in lakes with similar trophic state [84-86].
Zooplankton
The relative abundances of zooplankton taxa measured during this study were Copepoda which represented 89.00% of the total zooplankton, trailed by Protista (7.30% mainly Tintinnates) and Rotifera (3.70%, Figure 10).
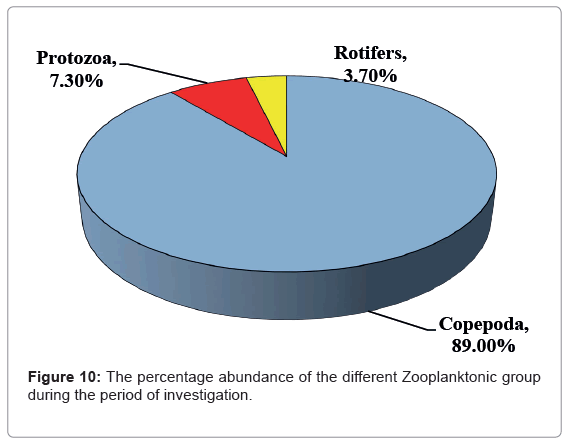
Figure 10: The percentage abundance of the different Zooplanktonic group during the period of investigation.
Figure 10 Shows the most dominant group in this study was Copepoda in all the investigation period except autumn which replace by Protozoa (58.00% and 36.00% of Copepoda of the total zooplankton, respectively). The maximum abundance of copepods, mainly in nauplii and copepodite stages, this accounted for 36.00-61.00% of the total zooplankton community, while adult copepodes were dominated by calanoids of the Rabigh Lagoon. The minor relative abundance of rotifers was 3.70% during the study period. Similar results in relative abundance of zooplankton groups were previously reported in the northern part of the Red Sea [87,88] and insome lakes in Japan [89-91] and in Egypt [92]. Dominance of calanoids agreed with Cornils [93] for the northern part of the Red Sea, he reported that bulk of the mesozooplankton (>70%) have climax of calanoids, cyclopoids and appendicularians.
The zooplankton densities of the Rabigh Lagoon peaked at site 4 while the lowest densities were recorded at site 7 that explains the high abundance of phytoplankton during summer season. In addition, our results show a high abundance of zooplankton (1200 Org. l-1) during autumn at site 4, while the lowest abundance of zooplankton (100 Org l-1) was recorded at site 7 during summer. Furthermore, our study in the Rabigh Khore identified 21 different species belonging to 18 genera with nauplii and copepodite stages being maximum than the adult forms which represented 30.00% and 35.00% of the copepods, respectively. That Result coincides with results of Calbet [94] for the Red Sea. The total copepod density ranged between 600 Org l-1 at site 7 during autumn and 21000 Org l-1 at site 4 during spring.
The low abundance of Copepoda observed in autumn, coincided with the drop in the temperature of the surface layers, given that copepods prefer staying in the deeper layers (approximately 5-10 m) [24,92,95]. Here, we should note that our sampling took place during the day, a period during which copepods tend to migrate to the bottom layers. During our study the low number of nauplii during summer was followed by an increase in the number of copepodites. According to a previous study, a response of a cohort to environmental changes can trigger synchronization of the nauplii to copepodite succession [95]. Figure 11 Summarizes the total zooplankton during the period of our investigation.
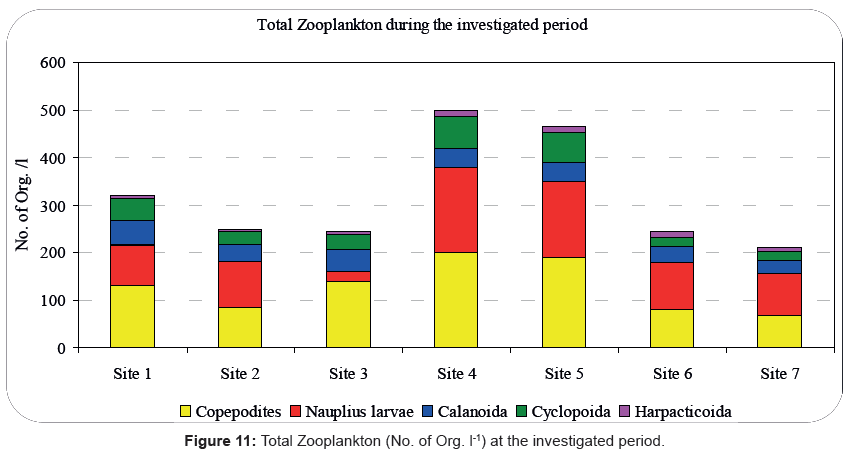
Figure 11: Total Zooplankton (No. of Org. l-1) at the investigated period.
Statistical data
The trends of the diversity index in relation to the number of species were calculated for each site during the period of investigation (Figure 12). The Diversity Index fluctuated between 2.785 at site 1 during autumn and 3.568 at site 4 during summer. On the other hand, the number of species increased southwards up to site 4 then decreased gradually up to site 7. Furthermore, we found no noteworthy seasonal variations in the number of species. The lowest number of species was recorded at site 7 during summer, while the highest number of species was observed at site 4 during summer too.
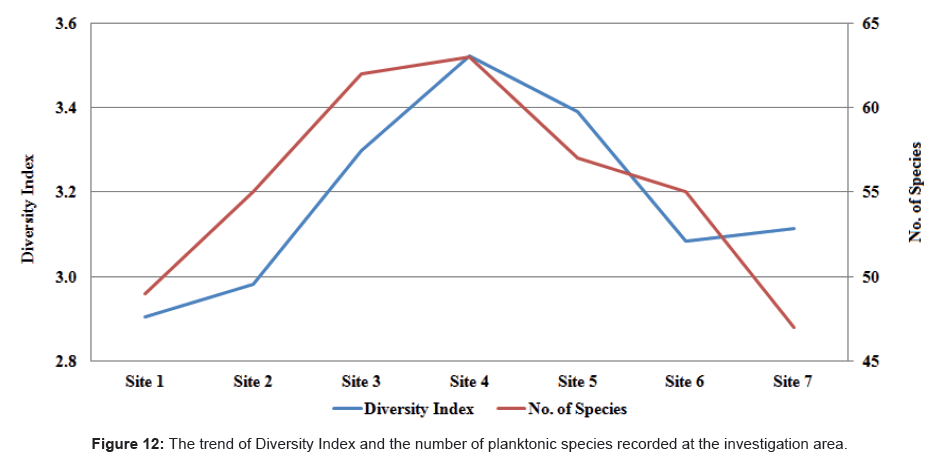
Figure 12: The trend of Diversity Index and the number of planktonic species recorded at the investigation area.
We also noticed a highly positive correlation between the diversity index and the number of species (r = 0.88) during the period of our study. A diversity index value of less than 1 indicated instability while values exceeding 3 indicated stability or clean water [96]. Based on Shannon-Wiener [64] we used the diversity index to assess species dispersion across a number of sites of the studied area.
Trophic status index
The analysis of different trophic state indices, abiotic parameters and distinctive water classifications demonstrated the eutrophic and even the progressed hypereutrophic of the lagoon waters
The trophic status index was calculated according to Secchi Disc Transparency and showed a remarkable increase moving southwards from the entrance of the lagoon up to site 7. The lowest value of TSI (SD) was 33.22 and it was recorded at site 1. In contrast, the highest value of was 66.33 and it was recorded at site 7. Also, according to Carlson [66] equations the trophic status index of the Rabigh Lagoon fluctuated from oligotrophy at the northern sites to eutrophic at the southern sites. The Trophic Status Index is presented in Figure 13.
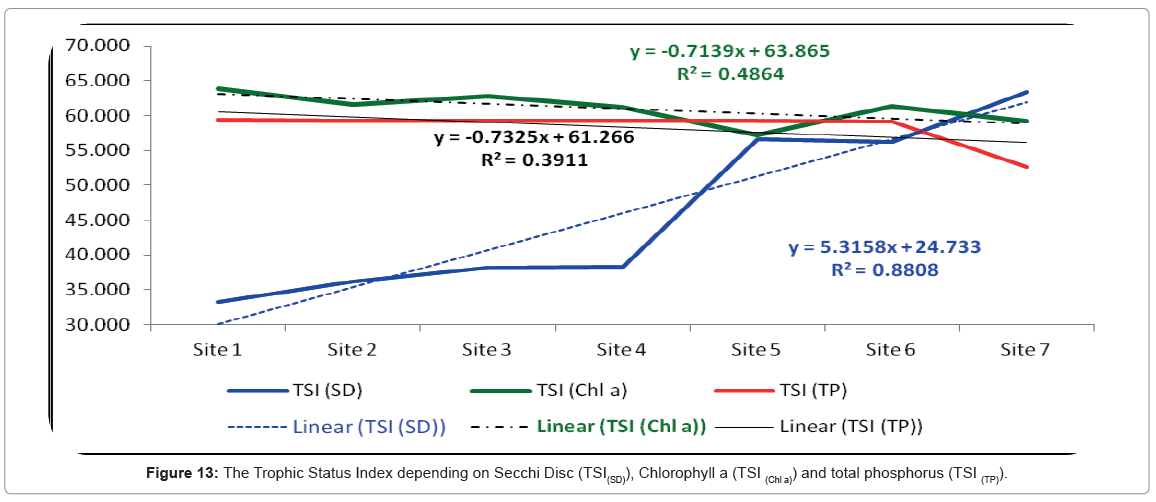
Figure 13: The Trophic Status Index depending on Secchi Disc (TSI(SD)), Chlorophyll a (TSI (Chl a)) and total phosphorus (TSI (TP)).
On another hand, the trophic status index of the Rabigh Lagoon according to the Secci Disc (TSI(SD)) equations was more powerful (r=0.93) than the trophic status index equations based either on chlorophyll a (TSI(Chl a), (r=0.69) or total phosphorus (TSI(TP), r=0.62). This may be due to many factors like the flood does not have a fixed time, and the flood inside the khor comes from everywhere surrounding its lagoon.
TSI values can be used to rank water bodies within sites and between regions. This ranking allows water managers to objectify water bodies that may require restoration or preservation activities as in our case with the Rabigh Lagoon. A close monitoring of the TSI of the lagoon for the next several years will enable us to prevent this area from degradation and conserve its ecological importance. Statistically, the calculating of trophic status index according to Secchi Disc methods was found to be better than chlorophyll a and total phosphorus methods.
Our data agree to some extent to Carlson’s index, which is is one of the most regularly utilized trophic lists worldwide and it is the trophic index used by the United States Environmental Protection Agency. The trophic state is characterized by the collective weight of biomass in a given water body at the season of estimation. Since they are of open concern, the Carlson index utilizes the algal biomass as a goal classifier of the water body’s trophic status. Carlson’s [66] trophic state index (TSI) depends on the algal standing crops, which is dependent on Chlorophyll a, as the basis for trophic state classification. Algal biomass can also be estimated using other variables, such as Secchi depth, and total phosphorus. In some waterbodies total phosphorus and transparency often correlate, thus doubling of the total phosphorus often results to halving of the Secchi depth. Furthermore, the pigments of chlorophyll double every 7 units instead of every 10 units [97]. Despite the fact that the index range has no lower or upper limits, its values usually range from roughly zero to 100. While transparency and phosphorus may co-disagree with the trophic state, as in our case, the changes in transparency are due to changes in algal biomass. Carlson [98] stressed that the averaging of chlorophyll with the calculated chlorophyll based on Secchi depth is equivalent to assuming that is better estimated values. Secchi depth and Chlorophyll a should be used as a replacement, not covariate, of total phosphorus in our case of the Rabigh Lagoon. The obtained data as well as the calculation of the trophic status index agree with previous reports by Trifonova [84] which concluded that, higher nutrient levels in water bodies can lead to an increase in the abundance and biomass of phytoplankton, a progression that also alters the taxonomic composition of the planktonic community. In addition, Reynolds [99] described a set of plankton functional groups that can characterize various types of environments. Here, our data confirm Karydis [100], who reported that, there are many methods to assess the eutrophication index in order to evaluate the environmental impact according to the nutrient concentrations and phytoplankton biomass, and he further divided the coastal waters into oligotrophic, mesotrophic and eutrophic.
Our cluster analysis was able to map the correlation according to the Bray-Curtis methodology [101] and the similarity matrix was used to construct the cluster dendrogram. These results are shown in Figure 14, and they can be summarized as follows.
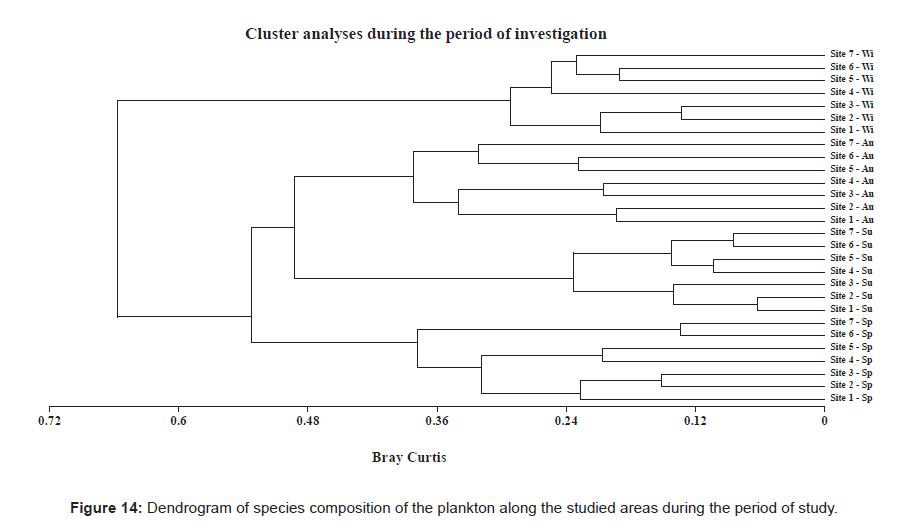
Figure 14: Dendrogram of species composition of the plankton along the studied areas during the period of study.
The highest similarity of plankton species composition was found to be 93.7% for sites 1 and 2, 91.5% for sites 6 and site 7 as well as 89.6% for sites 4 and 5 during summer; 86.7% for sites 2 and 3 and 80.9% for sites 5 and 6 during winter; and 86.9% for sites 6 and 7, 84.9% for sites 2 and 3 and 79.4% for sites 4 and 5 during spring. According to our cluster analysis (Figure 14) the Rabigh Lagoon can be divided into three main groups; the first one containing sites 1, 2 and 3; the second one containing sites 4 and 5 and the last group containing sites 6 and 7.
We further used the CCA to determine the relationships between phytoplankton and environmental variables during our study, since CCA can disseminate gradients from the biotic and the available abiotic factors. The important variables (abiotic) are quantitatively represented in graphical biplots using arrows, where the direction indicates direct or indirect correlations while their length is relative to the importance of the biotic factor (plankton and chlorophyll a).
The CCA was used to look at how plankton groups are distributed (Figure 15). In this analysis, the environmental parameters are represented by arrows, where their length represents the relation power of each variable relatively to the biotic factor within the ordination. The length and direction of each arrow shows the strength of the relation between the different groups of the plankton community during our study.
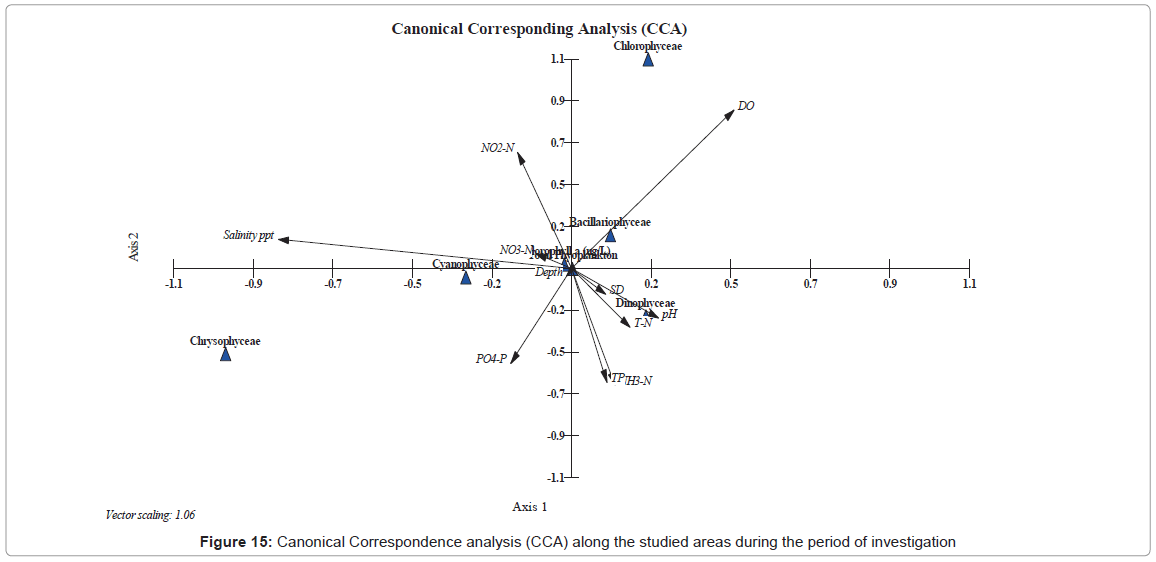
Figure 15: Canonical Correspondence analysis (CCA) along the studied areas during the period of investigation
The ordination of CCA revealed that Cyanophyceae have a positive strong relationship with both salinity and nitrite levels, and a negative relation with reactive protophosphate. These relations are in accordance with previous studies by Millie [102] for the St. Lucie Estuary, Florida (USA), Totti [1] for the North Adriatic Sea; Chen [103] for the South China Sea and Touliabah, [16] for the Northern part of the Jeddah Coast. On the other hand, member of Dinophyceae correlated positively to the pH, total nitrogen, total phosphorus, ammonia and the transparency. Also the Dinoflagellates correlated negatively with the dissolved oxygen. Furthermore, the Bacillariophyceae group was affected directly from the dissolved oxygen and negatively with ammonia, total nitrogen, total phosphorus, pH and the Secchi Disc readings. Finally, the total plankton showed as a hanging parameter, which is readily affected by most abiotic parameters.
Conclusions and Recommendations
In conclusion, the Rabigh lagoon is an oligotrophic ecosystem with some mesotrophic parts and two eutrophic sites at the southern part (Site 6 and Site 7) due to the presence of a mangrove area. Our preliminary study on the Rabigh Lagoon suggests that more extensive ecological studies should be carried out in this ecosystem. Our data showed that the water quality and planktonic dynamics mirrored seasonal hydrologic and salinity regimes across the entire investigated area. Our proposition is to characterize this lagoon as a natural reserve area in order to conserve its rich coral reefs, sponge and fish communities from the potential dangers of the large industrial zone that exists nearby the lagoon.
Towards this goal we recommend:
• A more frequent sampling regime than the one used in the present study for a more realistic interpretation of system-level variability within the coastal waters, particularly in an attempt to understand the response of water quality and plankton to natural and/ or human impacts.
• This study considered a baseline and monitoring studies for future by using TSI as a predictor for the lagoon management and field programs in order to monitor the health of lagoon.
• The establishment of water quality criteria since sea water is used for drinking after desalination.
References
- Totti C, Cangini M, Ferrari C, Kraus R, Pompei M, et al. (2005) Plankton size distribution and community structure in relation to mucilage occurrence in the northern Adriatic Sea. Science of the Total Environment 353: 204-217.
- Mearns AJ, Reish DJ, Oshida PS, Ginn T, Rempel-Hester MA, et al. (2015) Effects of Pollution on Marine Organisms. Water Environ Res 87: 1718-1816.
- Fouda MM, Gerges MA (1994) Implication of climate change in the Red Sea and Gulf of Aden region: An overview. UNEP Regional Seas Reports and Studies.
- Touliabah HE, Elbassat RA, Tourk AJ, Affan MA, Hariri MS, et al. (2016) Plankton and Some Environmental Variables as a Water Quality Indicator for Saline Pools at the Eastern Red Sea (Saudi Arabia). J Coast Zone Manag 19: 417.
- Badawi A (2016) Late Holocene hydrographic settings of the northern Red Sea. The Egyptian Journal of Aquatic Research 42: 41-48.
- Racault MF, Raitsos ML, Berumen RJ, Brewin W, TrevorPlatt S, et al. (2016) Plankton phenology indices in coral reef ecosystems: Application to ocean-color observations in the Red Sea. Remote Sensing of Environment 160: 222-234.
- Abu-Zied RH, Bantan RB, El Mamoney MH (2011a) Present environmental status of the Shuaiba Lagoon, Red Sea Coast, Saudi Arabia. Mar Sci 22: 159-179.
- Abu-Zied RH, Bantan RA (2013) Hypersaline benthic foraminifera: their environmental controls and usefulness in sea level reconstruction at the Shuaiba Lagoon, eastern Red Sea, Saudi Arabia. Mar Micropaleontol 103:51-67.
- Al-Dubai Talha AA, Abu-Zied RH, Basaham AS (2017) Present environmental status of Al-Kharrar Lagoon, central of the eastern Red Sea coast, Saudi Arabia. Arab J Geosci 10: 305.
- Burne RV, Moore LS (1987) Microbialites: Organosedimentary deposits of benthic microbial communities. Palaios 2: 241-254.
- Aleem AA (1978) Contributions to the study of the marine algae of the Red Sea. III- Marine algae from Obhour in the vicinity of Jeddah, Saudi Arabia. Bull Fac Sci KAU Jeddah 2: 99-118.
- Dowidar NM, Raheem El-Din SA (1978) Phytoplankton populations in the region of Obhur (Jeddah, Saudi Arabia). Bull Fac Sci KAU Jeddah 2: 271-292.
- Shaikh AA, Roff JC, Dowidar NM (1986) Phytoplankton ecology and production in the Red Sea off Jeddah, Saudi Arabia. Marine Biology 92: 403-410.
- Khalil AN, Ibrahim AM (1988) A seasonal study of the surface phytoplankton of the Red Sea North of Jeddah. Arab Gulf J Scient Res Agric Biol Sci 6: 189-204.
- Touliabah HE, Abu El-Kheir WS, Kuchari MG, Abdulwassi NIH (2010) Plankton Composition at Jeddah Coast–Red Sea, Saudi Arabia in Relation to some Ecological Factors. JKAU: Sci 22: 115-131.
- Nassar Mohamed Z, Hamdy RM, Hanan MK, Sarah HR (2014) Seasonal fluctuations of plankton community and physico-chemical parameters of the north western part of the Red Sea, Egypt. The Egyptian Journal of Aquatic Research 40: 395-403 .
- Qurban MA, Balala AC, Kumar S, Bhavya PS, Wafar M (2014 a) Primary production in the northern Red Sea. J Mar syst 132: 75-82 .
- Qurban MA, Krishnakumar PK, Joydas TV, Manikandan KP, Ashraf TTM, et al. (2014 b) In-situ observation of deep water corals in the northern Red Sea waters of Saudi Arabia. Deep-Sea Res I Oceanogr Res Pap 89: 35-43.
- Wafar M, Qurban MA, Ashraf M, Manikandan KP, Flandez AV, et al. (2016) Â Patterns of distribution of inorganic nutrients in Red Sea and their implications to primary production. Journal of Marine Systems 156:86-98.
- Bottger-Schnack R (1995) Summer distribution of micro- and small mesozooplankton in the Red Sea and Gulf of Aden, with special reference to non-calanoid copepods. Mar Ecol Prog Ser 118: 81-102.
- Al-Aidaroos AM, El-Sherbiny MMO, Satheesh S, Mantha G, Agust? S, et al. (2014) High Mortality of Red Sea Zooplankton under Ambient Solar Radiation. PLoS ONE 9: e108778.
- Pearman J, El-Sherbiny MM, Lanzén A, Al-Aidaroos AM, Irigoien X (2014): Zooplankton diversity across three Red Sea reefs using pyrosequencing. Frontiers in Marine Science 1:27.
- Pearman JK, Irigoien X (2015) Assessment of Zooplankton Community Composition along a Depth Profile in the Central Red Sea. PLoS ONE 10: e0133487.
- Cornils A, Niehoff C, Richter TAS, Schnack-Schiel B (2007) Seasonal abundance and reproduction of clausocalanid copepods in the northern Gulf of Aqaba (Red Sea). Journal of Plankton Research 29: 57-70.
- Thiennemann A (1918) Untersuchungen über die Beziehungen zwischen dem Sauerstoffgehalt des Wassers und der Zusammensetzung der Fauna in norddeutschen Seen. Archiv für Hydrobiologie 12: 1-65.
- Naumann E (1919) Några synpunkter angående limnoplanktons ökologi med särskild hänsyn till fytoplankton. Svensk Botanisk Tidskrift 13: 129-163.
- Nixon SW (1995) Coastal marine eutrophication: a definition, social causes, and future concerns. Ophelia 41: 199-219.
- Reynolds CS (1980) Phytoplankton assemblages and their periodicity in stratifying lake systems. Holarctic Ecol 3: 141-159.
- Thunmark S (1945) Zur Soziologie des Süβwasserplanktons. Eine methodisch-ökologische Studie. Folia Limnologica Scandinavia 3: 1-66.
- OECD (1982) Eutrophication of Water, Monitoring Assessment and Control. Organization of Economic Co-operation and Development, Paris.
- Kawecka B, Eloranta P (1994) Ecology of freshwater and terrestrial algae- Wyd. PWN, Warsawa.
- Tremel B (1996) Determination of the trophic state by qualitative and quantitative phytoplankton analysis in two gravel pit lakes. Hydrobiologia 323: 97-105.
- Vollenweider RA, Rinaldi A, Montanari G (1992) Eutrophication, structure and dynamics of a marine coastal system: results of ten years monitoring along the Emilia-Romagna coast (Northwest Adriatic Sea), in Marine Coastal Eutrophication. J Science of the Total Environment 63-106.
- UNESCO (1981) Tenth Report of the Joint Panel on Oceanographic Tables and Standards. UNESCO Technical Papers in Marine Sciences.
- Vollenweider RA, Giovanardi F, Montanari G, Rinaldi A (1998) Characterization of the trophic conditions of marine coastal waters, with special reference to the NW Adriatic Sea. Proposal for a trophic scale, turbidity and generalized water quality index. Environmetrics 9: 329-357.
- Moncheva S, Dontcheva V, Shtereva G, Kamburska L, Malej A, et al. (2002) Application of eutrophication indices for assessment of the Bulgarian Black Sea coastal ecosystem ecological quality. Water Science and Technology 46: 19-28.
- Costa JE, Howes BL, Giblin A, Valiela I (1992) Monitoring Nitrogen and indicators of nitrogen to support management action in Buzzards Bay. Ecological Indicators 497-529.
- Kratzer CR, Brezonik PL (1981) A Carlson-type trophic state index for nitrogen in Florida lakes. Water Res Bull 17: 713-715.
- Zdanowski B (1983) Ecological characteristics of lakes in north-eastern Poland versus their trophic gradient, III. Chemistry of the water in 41 lakes. IV. Chemistry of bottom sediments in 37 lakes, V. Chlorophyll content and visibility of Secchi’s disc in 46 lakes. Ekologia Polska, 31: 287-352
- João GF, Jesper HA, Angel B, Suzanne BB, Jordi C, et al. (2011) Overview of eutrophication indicators to assess environmental status within the European Marine Strategy Framework Directive. Estuarine Coastal and Shelf Science 93: 117-131.
- Gupta M (2014) A New Trophic State Index for Lagoons. Journal of Ecosystems 14: 8.
- Al-Barakati AMA, Ahmad F (2012) Water column conditions in a coastal lagoon near Jeddah, Red Sea. Oceanologia 54: 675-685.
- Al-Barakati AMA (2010) Some Hydrographic Features of Rabigh Lagoon along the Eastern Coast of the Red Sea. JKAU 21: 123-132.
- Hariri MB (2008). Effect of Hydrographic Conditions on the Ecology of Benthic Foraminifera in Two Different Hypersaline Lagoons, Eastern Red Sea Coast, Kingdom of Saudi Arabia. JKAU: Mar. Sci 19: 3-13.
- Al-Washmi HA (1999) Sedimentological aspects and environmental conditions recognized from the bottom sediments of Al-Kharrar Lagoon, Eastern Red Sea coastal plain, Saudi Arabia. JKAU 10: 71-87.
- Gheith AM, Abou-ouf MA (1996) Textural characteristics, mineralogy and fauna in the shore zone sediments at Rabigh and Sharm Al-Kharrar, Eastern Red Sea, Saudi Arabia. JKAU 17: 1-2.
- Behairy AKA (1983) Marine transgressions in the west coast of Saudi Arabia between mid-Pleistocene and present. Mar Geol 52: M25-M31.
- Sengupta A, Chaudhuri S (1991) Ecology of heterotrophic nitrogen fixation in the Rhizosphere of mangrove plant community at the Ganges river estuary in India. Oecologia 87: 560-564.
- Holguin G, Guzman MA, Bashan Y (1992) Two new nitrogen- fixing bacteria from the rhizosphere of mangrove trees: Their isolation, identification and in vitro interaction with rhizosphere Staphylococcus sp. FEMS Microbiol Ecol 101: 207-216.
- Holguin G, Vazquez P, Bashan Y (2001) The role of sediment microorganisms in the productivity, conservation, and rehabilitation of mangrove ecosystems: an overview. Biol Fertil Soils 33: 265-278.
- Alongi DM, Christoffersen P, Tirendi F (1993) The influence of forest type on microbial-nutrient relationships in tropical mangrove sediments. J Exp Mar Biol Ecol 171: 201-223.
- APHA (American Public Health Association) (1992) Standard Methods for the Examination of water and wastewater. 18th A.P.H.A., A.W.W.A, W.P.C.F. American Public Health Association, Washington D.C.
- EPA (Environmental Protection Agency) (1979) Plankton-water quality relations in USA Lakes, Part VI: The common plankton genera from Eastern and Southern Lakes. Environmental Monitoring and Support Laboratory, Las Vegas NV.
- Ultermol M (1958) Zur Vervollkommung der Quantitativen Phytoplankton Methodic, Mitt. Int Verein Theor angew Limnol 9: 1-38.
- Garcia-Baptista M (1993) Pasmmic Algae from Paraia Azul, Barazil. Bibliogtheca Phycologica Band 94. J Cramer in der Gebruder Borntraeger Verlagsbuchhandlung Berlin. Suttgart 22: 167.
- Silva SMF, Pienaar RN (2000) Benthic Marine Cyanophyceae from Kwa-Zulu Natal, South Africa. Bibliogtheca Phycologica Band 107 J. Suttgart 20: 455.
- Botes L (2003) Plankton Identification Catalogue. Saldanha Bay, South Africa. Marine and Coastal Management, Private Bag, South Africa.
- Edler L (1979) Recommendation for Marine Biological Studies in the Baltic Sea. Phytoplankton and chlorophyll 65: 165-173.
- Jeffrey SW, Humphrey GF (1975) New Spectrophotometric equations for determining chlorophylls a, b, c1 and c2 in higher plants algae and natural phytoplankton. Biochem Phiziol Pflanzen 36: 264-271.
- Lorenzen CJ (1967) Determination of chlorophyll and pheopigments Spectrophotometric equation. Limnology and oceanography 12: 343-346.
- Dimov I (1959) Improved quantitative zooplankton sampling method. Rep BAS 12: 427-429.
- Shannon CE, Weaver W (1963) The mathematical Theory of Communication. University of Illinois Press.
- Heip C (1974) A new Index measuring evenness. J marine bio Asso UK 54: 555-557.
- Carlson RE 1977 A trophic state index for lakes. Limnology and Oceanography 22: 361-369.
- Sørensen T (1948) A method of establishing groups of equal amplitude in plant sociology based on similarity of species and its application to analyses of the vegetation on Danish commons. Biologiske Skrifter 5: 1-34.
- Ter Braak CJF (1986) Canonical correspondence analysis: a new eigenvector technique for multivariate direct gradient analysis. Ecology 67: 1167-1179.
- Ter Braak CJF (1987) The analysis of vegetation-environment relationships by canonical correspondence analysis. Vegetatio 64: 69-77.
- Kovach (2000) Multivariate Statistical Package v3.12b. Kovach Computing Services.
- Ganai AH, Parveen S (2014) Effect of physico-chemical conditions on the structure and composition of the phytoplankton community in Wular Lake at Lankrishipora, Kashmir. International Journal of Biodiversity and Conservation 6: 71-84.
- Hariri M, Abu-Zied, R.H. (2017) Heavy metal concentrations in the sediments of the hypersaline Al-Kharrar Lagoon and the brine pool of Salman Bay, eastern Red Sea coast, Saudi Arabia. Oceanologia, under publication, personal communication.
- Ahmad F, Sultan SAR (1992) The Effect of Meteorological Forcing on the Flushing of Shuaiba Lagoon on the Eastern Coast of the Red Sea. JKAV Mar Sci 3: 3-9.
- Smith NP (1977) Meteorological and tidal exchange between Corpus Christi Bay, Texas and the north-Western Gulf of Mexico. Estuarine and Coastal Marine Science, 5: 511-520.
- Buzzi F (2002) Long-term ecological changes in Romanian coastal waters of the Black Sea. Marine Pollution Bulletin 32: 32-38.
- Touliabah H, Taylor WD (2004) The phytoplankton of Great Bitter Lake, Egypt, including the impacts of nutrient-laden and heated effluents. Afr J Aquat Sci 29: 259-264.
- Troccoli GL, Herrera-Silveira JA, Com?´n FA (2004) Structural variations of plankton in the coastal seas of Yucatan, Mexico. Hydrobiologia 519: 85-102.
- Alvarez-Gongora C, Herrera-Silveira J (2006) Variations of plankton community structure related to water quality trends in a tropical karstic coastal zone. Marine Pollution Bulletin 52: 48-60.
- Rey M, Sholten J, Stoffers P, Wehner F (2004) Hydrographic structure of brine-filled deeps in the Red Sea- New results from the Shaban, Kebrit, Atlantis II, and Discovery Deep. Marine Geology 144: 311-330.
- Sawai Y, Nagumo T, Namegaya Y, Cisternas MV, Lagos M, et al. (2016) Diatom (Bacillariophyceae) assemblages in salt marshes of south-central Chile: Relations with tidal inundation time and salinity. Phycological Research 65: 29-37.
- Vanhoorne B (2017) World Register of Marine Species. WoRMS Editorial Board.
- Yerli SV, K?vrak E, Gürbüz H, Manav E, Mang?t F, et al. (2012) Phytoplankton Community, Nutrients and Chlorophyll a in Lake Mogan (Turkey); with Comparison Between Current and Old Data. Turk J Fish Aquat Sci 12: 95-104.
- Dowidar NM (1983) The Genus of Ceratium from the Red Sea. Journal of Faculty of Marine Science 3: 1404-1983.
- Trifonova IS (1998) Phytoplankton composition and biomass structure in relation to trophic gradient in some temperate and subarctic lakes of north-western Russia and the Prebaltic. Hydrobiologia, 369: 99-108.
- Peáechata A, Walna B, Peáechaty M, Kaczmarek L, Ossowski P, et al. (2009) Seasonal dynamics of the algae and blue-green assemblage of Góreckie Lake against the background of the physical-chemical prosperities of water and the development of macrophytes. Pozna?–Jeziory 27-42.
- Mencfel R (2013) Relationship among biomass of algae and concentration of Chlorophyll a, against the taxonomic structure of phytoplankton in three lakes on Lublin Polesie Region. Teka Kom Ochr Kszt ?rod Przyr 10: 243-249.
- El-Sherif, Z, Aboul Ezz S (2000) Check List of Plankton of The Northern Red Sea. Pakistan Journal of Marine Sciences 9: 61-78.
- Khalil M, Abd El-Rahman N (1997) Abundance and diversity of surface zooplankton in the Gulf of Aqaba, Red Sea, Egypt. Journal of Plankton Research 19: 927-936.
- Uye S, Shimazu T, Yamamuro M, Ishitobi Y, Kamiya H (2000) Geographical and seasonal variations in mesozooplankton abundance and biomass in relation to environmental parameters in Lake Shinji–Ohashi River–Lake Nakaumi brackish-water system. Japanese Journal of Marine System 26: 193-207.
- Godhantaraman N (2001) Seasonal variations in taxonomic composition, abundance and food web relationship of microzooplankton in estuarine and mangrove waters, Parangipettai region, southeast coast of India. Indian Journal of Marine Science 30: 151-160.
- Godhantaraman N, Uye S (2003) Geographical and seasonal variations in taxonomic composition, abundance and biomass of microzooplankton across a brackish-water lagoonal system of Japan. Journal of Plankton Research 25: 465-482.
- Bassat RA (2008) Composition and abundance of the zooplankton community in the BitterLakes, Egypt, in relation to environmental factors. African Journal of Aquatic Science 33: 233-240.
- Cornils A, Schnack-Schiel SB, Hagen W, Dowidar NM, Stambler O, et al. (2005) Spatial and temporal distribution of mesozooplankton in the Gulf of Aqaba and the northern Red Sea in February/March 1999. Journal of Plankton Research 27: 505-518.
- Calbet A, Agersted MD, Kaartvedt S, Møhl M, Møller EF, et al. (2015) Heterogeneous distribution of plankton within the mixed layer and its implications for bloom formation in tropical seas. Scientific Reports 5: 1-14.
- Bojanic N, Solic M, Krstulovic N, Sestanovic S, Nincevic GZ, et al. (2006) The role of ciliates within microbial food web in the eutrophicated part of Kastela Bay (Middle Adriatic Sea). Sci Mar 70: 431-442.
- Wilhm JL, Doris TC (1966) Species diversity of benthic macroinvertebrates in a stream receiving domestic and oil refinery effluents. Am Midl Nat 76: 427-449.
- Carlson RE (1980) More complications in the chlorophyll-Secchi disk relationship. Limnology and Oceanography 25: 378-382.
- Carlson RE (1983) Discussion on “Using differences among Carlson’s trophic state index values in regional water quality assessment.†Water Resources Bulletin 19: 307-309.
- Reynolds CS, Huszar V, Kruk C, Naselli FL, Melo S (2002) Towards a functional classification of the freshwater phytoplankton. J Plankton Res 24: 417-428.
- Karydis M (2009) Eutrophication Assessment of Coastal Waters Based On Indicators: A Literature Review. Global NEST Journal 11: 373-390.
- Bray JR, Curtis CT (1957) An ordination of the upland forest communities of southern Wisconsin. Ecol Monogr 27: 325-349.
- Millie DF, Carrick HJ, Doering KPH, Steidinger A (2004) Intra-annual variability of water quality and plankton in the North Fork of the St. Lucie River Estuary, Florida (USA): a quantitative assessment. Estuarine Coastal and Shelf Science 61: 137-149.
- Chen LY (2005) Spatial and seasonal variations of nitrate-based new production and primary production in the South China Sea Deep Sea Research Part I. Oceanographic Research Papers 52: 319-340.
Citation: Touliabah HE, Elbassat RA (2017) Ecological Study of the Rabigh Lagoon, Eastern Site of the Red Sea, Saudi Arabia with Special Reference to Eutrophication Index. J Marine Sci Res Dev 7: 242. DOI: 10.4172/2155-9910.1000242
Copyright: © 2017 Touliabah HE, et al. This is an open-access article distributed under the terms of the Creative Commons Attribution License, which permits unrestricted use, distribution, and reproduction in any medium, provided the original author and source are credited.
Select your language of interest to view the total content in your interested language
Share This Article
Recommended Journals
Open Access Journals
Article Tools
Article Usage
- Total views: 10347
- [From(publication date): 0-2017 - Jul 12, 2025]
- Breakdown by view type
- HTML page views: 9315
- PDF downloads: 1032