Effects of Simulated Weightlessness on Metabolizing Enzymes and Zolpidem Pharmacokinetics in SD Rats
Received: 13-Nov-2023 / Manuscript No. CPB-24-119898 / Editor assigned: 15-Nov-2023 / PreQC No. CPB-24-119898 (PQ) / Reviewed: 29-Nov-2023 / QC No. CPB-24-119898 / Revised: 03-Feb-2025 / Manuscript No. CPB-24-119898 (R) / Published Date: 10-Feb-2025
Abstract
Zolpidem is a known hypnotic for astronauts in spaceflight. Up until now, the effect of microgravity on the pharmacokinetics of zolpidem remained unclear. The pharmacokinetics of zolpidem in SD rats were studied under both short-term and long-term simulated weightlessness, laying the foundation for safe administration to astronauts. The plasma concentration-time profile of orally administered zolpidem in normal or tail-suspended SD rats was acquired by LC-MS/MS. The pharmacokinetic parameters AUC and Cmax were the lowest for two-week tail suspension. The Tmax for the tail-suspension groups was higher than for the CON group. The mRNA and protein expression levels of CYP3A1, a zolpidem metabolic enzyme, were measured in a variety of organs by Western blotting and RT-PCR over four suspension times (SUS-7d, SUS-14d, SUS-21d, and SUS-28d). CYP3A1 levels were increased in the liver and kidney after SUS-14d. In contrast, CYP3A1 levels significantly decreased in the duodenum and jejunum at this time point. The simulated microgravity of SD rats exhibited an unequivocal reduction in zolpidem bioavailability and effect on CYP3A1 expression in a variety of tissues.
Keywords: Zolpidem; Simulated weightlessness; Metabolizing enzyme; Pharmacokinetics; Tail-suspension model
Introduction
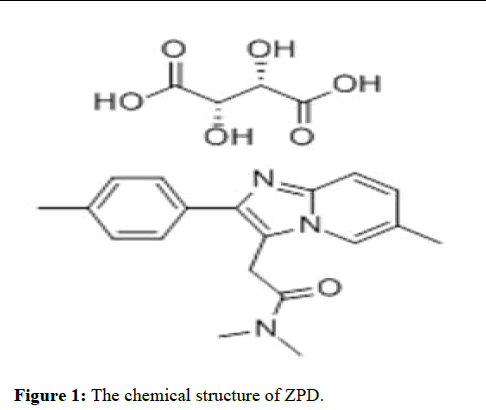
Zolpidem (ZPD) can partially activate the GABA receptor in vivo, which has sedative and hypnotic effects (Figure 1). The incidence of adverse reactions from zolpidem is lower than observed for other sedative and hypnotic drugs [1]. In particular, the incidence of adverse effects on liver and kidney function or cardiovascular disease is very rare [2]. The rebound and withdrawal reactions after cessation of its use are also better than with other sedative and hypnotic drugs. The adverse reactions to this drug are mainly headache and dizziness, dry mouth, and constipation [3]. Therefore, the safety profile for zolpidem makes it the first-line drug for use in aerospace.
Figure 1: The chemical structure of ZPD.
The factors that cause insomnia in astronauts are very complex; however, the most obvious is that the frequency of alternating day and night changes in space is fast, and the function of the Human Melatonin (MT) system gradually degrades because of these frequent changes [4]. A persistent lack of sleep can damage an astronaut’s body, including an impact on the cardiovascular system and immune system and blood glucose regulation, which results in insomniarelated diseases. Therefore, astronauts need to use hypnotics to assist sleep.
The CYP3A gene is located on human chromosome q21.3-22.1 and consists of 13 exons and 12 introns. Among all CYP450 enzymes, CYP3A is of great importance because of its wide range of substrates. About 40–50% of drug metabolism in the human body is catalyzed by CYP3A [5,6]. There are four CYP3A subtypes in the human body (i.e., CYP3A3, CYP3A4, CYP3A5, and CYP3A7) [7]. CYP3A4 is the most important isoenzyme that is mainly expressed in the liver and small intestine. CYP3A4 can catalyze the metabolism of a large number of clinically important drugs [8-10]. Human CYP3A4 corresponds to rat CYP3A1 [11]. Because ZPD is mainly metabolized by the CYP3A4 enzyme in humans, we selected the rat CYP3A1 enzyme for evaluation in the present study [12].
Spaceflight can alter human physiology as a result of fluid shifts, muscle and bone loss, immune system dysregulation, and changes in the gastrointestinal tract and metabolic enzymes. These alterations may affect the pharmacokinetics or pharmacodynamics of medications (i.e., the efficacy and safety of these medications) for the astronauts [13]. ZPD levels in the body change during long-term spaceflight; however, it is not known whether these changes are correlated to changes in ZPD metabolism. Therefore, we investigated whether CYP3A1 altered the pharmacokinetics of ZPD under simulated weightlessness.
Materials and Methods
Chemicals
Zolpidem (ZPD, 99.5%, Z2500000) was provided by Shanghai Guyan Technology Research Co., Ltd. Caffeine (99.9%, 171215-201211) was purchased from the National Institutes for Food and Drug Control as the Internal Standard (IS). Methanol was from Fisher Scientific (Fair Lawn, NJ, USA).
Animals and their treatment
The experiments involving animals were carried out in accordance with the guidelines for the care and use of laboratory animals. The experimental protocol was approved by the institutional animal care and use committee of air force medical university. Healthy, specific pathogen-free 4-week-old male Sprague Dawley (SD) rats weighing 220 ± 20 g were supplied by the experimental animal center of air force medical university (Xi’an, People’s Republic of China). All rats were housed in animal rooms at constant temperature (23°C ± 2°C) and humidity (55% ± 10%). The rooms were kept in a 12 h light/dark cycle, and the rats had unrestricted food and water.
Drug administration and sample collection
To investigate CYP3A1expression in tissues, sixty-four SD rats were randomly divided into four control groups (CON-7d, CON-14d, CON-21d, and CON-28d) and four suspension groups (7-day (SUS-7d), 14-day (SUS-14d), 21-day (SUS-21d). and 28-day (SUS-28d)). Animals in all eight groups underwent fasting during the last 12 h of treatment. At indicated time points, the rats were anesthetized with pentobarbital sodium (40 mg/kg, i.p.) and euthanized by exsanguination via the abdominal aorta. The liver, kidney, lung, duodenum, jejunum, and ileum were harvested, rinsed with physiological saline, and then stored at -80℃ after lyophilization.
In the pharmacokinetics study, forty SD rats were randomly divided into CON, SUS-7d, SUS-14d, SUS-21d, and SUS-28d groups. The suspension groups were tail-suspended to simulate microgravity according to the Morey-Holton model [14]. Medical adhesive tape was attached to the rat tail and fixed on the top of the cage. The tilt angle was about 30° in relation to the horizontal. Rats could freely move in the cage and had free access to food and water. Control and simulated microgravity rats (n=8 per group) were fasted for 12 h with free access to water before dosing. After the oral administration of 1.0416 mg/kg ZPD, blood samples were collected into heparinized tubes at scheduled times (0.083, 0.167, 0.25, 0.333, 0.5, 0.75, 1, 1.5, 2, 3, and 6 h). Blank plasma was collected before dosing. Plasma was collected after centrifugation (12000 rpm for 10 min, 4°C) and stored at -20°C.
Western blotting analysis
Total protein was extracted from tissues with cold RIPA buffer (Beyotime, Shanghai, China) supplemented with phenylmethanesulfonyl fluoride (1 mmol/L; Sigma). Homogenates were centrifuged at 12000 g for 10 min at 4℃, and the supernatants were collected. Protein concentrations of the extracts were determined by the Lowry method. Equal amounts of protein were separated by 10% (v/v) Sodium Dodecyl Sulfate-Polyacrylamide Gel Electrophoresis (SDS-PAGE) and transferred onto Polyvinylidene Difluoride (PVDF) membranes. After washing, the membranes were incubated overnight at 4°C with a rabbit polyclonal antibody against CYP3A1. After washing, the membranes were incubated for 1 h with corresponding horseradish peroxidase-conjugated anti-rabbit IgG secondary antibody (1:10,000; ComWin Biotech Co., Ltd., Beijing, China). Immunoreactive bands were visualized with an enhanced chemiluminescent substrate (Thermo Fisher Scientific, Rockford, IL, USA) using the GE ImageQuant LAS 4000 mini (GE Healthcare, Waukesha, WI, USA). The intensity of the protein bands was quantitated using the Gel Doc XR System (Bio-Rad, Hercules, CA, USA).
RT-PCR analysis
Total RNA was extracted from the tissues using the Trizon Kit (Invitrogen) and measured using ultra-violet spectrophotometry in duplicate. The PCR products were subjected to 1% agarose gel chromatography to confirm purity and concentration. cDNA was synthesized using a reverse transcription kit (Promega, Madison, WI, USA). CYP3A1 and ACTIN primers were designed based on the mRNA sequences available in GenBank. The forward and reverse primers for the CYP3A1 gene were 5'-CCCCTGAAATTAAGCTTAGGAG-3' and 5'-TAATTTGAGGTCTCTGGTGTTCTCA-3', respectively. The forward and reverse primers for the ACTIN gene were 5'- CACCCGCGAGTACAACCTTC-3' and 5'-CCCATACCCACCATCACACC-3', respectively. SYBR Green was used for the fluorescent quantitative PCR. After the reactions were complete, the amplification and solubility curves for the DNA were analyzed, and the data processed using a gel imaging system (Glyko, Novato, CA, USA).
Quantitative analysis of ZPD in plasma
Plasma (100 μL) was mixed with 360 μL of methanol, and the internal standard, caffeine (10 μL of 100 ng/mL in mobile phase), was added. After centrifugation, the supernatants were evaporated to dryness. The residues were dissolved in 100 μL of the mobile phase (methanol/water with 10 mM ammonium acetate) and analyzed using LC-MS/MS. The detection limit of ZPD was 1 ng/mL.
LC-MS/MS analysis
LC-MS/MS analysis was performed using the API LC-MS/MS system. Chromatographic separation was achieved using the Shimadzu LC system with an Agilent C18 column (4.6 × 150 mm, 3.5 μm) at 30℃ and a rate of 0.6 mL/min with phase A (methanol) and phase B (water with 10 mM ammonium acetate) in a ratio of 85:15. The mass spectrometer was operated in the positive ion mode for electrospray ionization. The ionization source variables included a capillary voltage of 0.55 kV, source temperature of 150℃, and desolvation gas temperature of 450℃. The MS/MS transitions (m/z) were 308.0>235.2 for ZPD and 195.2>137.9 for caffeine (IS). The declustering potential values were set at 100 V and 58 V for ZPD and IS, respectively. The collision energy values were set at 47 eV and 28 eV for ZPD and IS, respectively. Data were acquired using Analyst software (Version 1.6, Applied Biosystems/MDSSCIEX).
Preparation of standard solutions
The stock solution of ZPD was prepared in methanol. This stock was diluted in methanol to the following concentrations: 10, 20, 50, 100, 200, 500, 1000, 2000 ng/mL. Caffeine (IS) was prepared in methanol at a concentration of 1000 ng/mL.
Method validation
To validate the developed method, four concentrations corresponding to the Lower Limit of Quantification (LLOQ), Low-Quality Control (LQC), Medium-Quality Control (MQC), and High-Quality Control (HQC) were prepared for each matrix.
Specificity
Specificity was assessed by analyzing blank plasma samples, blank plasma spiked with ZPD or IS, and the plasma samples collected after oral administration of ZPD to confirm the presence or absence of interference.
Linearity and sensitivity, accuracy and precision
Calibration curves were generated by plotting the ratios (Y-axis) of the analyte peak area to that of IS versus the concentration of the standards (X-axis) through weighted regression (1/x) analysis. LLOQ was defined as the lowest concentration on the calibration curve with S/N >10. The accuracy and precision were evaluated in terms of the Relative Error (RE%) and the Relative Standard Deviation (RSD%) for six replicates at the four concentrations on the same day and three consecutive days, respectively.
Extraction recovery and matrix effect
The extraction recovery was defined by comparing the response of the normal extracted analytes at three QC concentrations (six replicates) to that of the spike-after-extract samples (ZPD and IS were added to the supernatants after extraction) at the corresponding concentrations. The matrix effect was assessed by comparing the response of the samples spiked post-extraction to those in nonextracted samples (ZPD and IS were spiked in the mobile phase, n=6) at equivalent concentrations.
Stability
The stability of ZPD in rat plasma was investigated using three replicates at three QC concentrations for post-preparation stability (samples kept in the autosampler at 4℃ for 24 h), short-term storage (room temperature for 12 h), long-term storage (-20℃ for 30 days), and three freeze-thaw cycles.
Pharmacokinetics analysis
The concentrations of ZPD in the plasma at different time points were expressed as the mean ± SD. The plasma concentration versus time curve was plotted. The pharmacokinetic parameters were analyzed using the non-compartmental method with DAS version 3.0 (Drug and Statistics, Mathematical Pharmacology Professional Committee of China, Beijing China). Data were analyzed using GraphPad Prism 6.0 (GraphPad Software, Inc., La Jolla, CA, USA) and expressed as the mean ± SD. Differences between groups were determined using one-way ANOVA analysis. P<0.05 indicated statistical significance.
Results
Effects of microgravity on CYP3A1
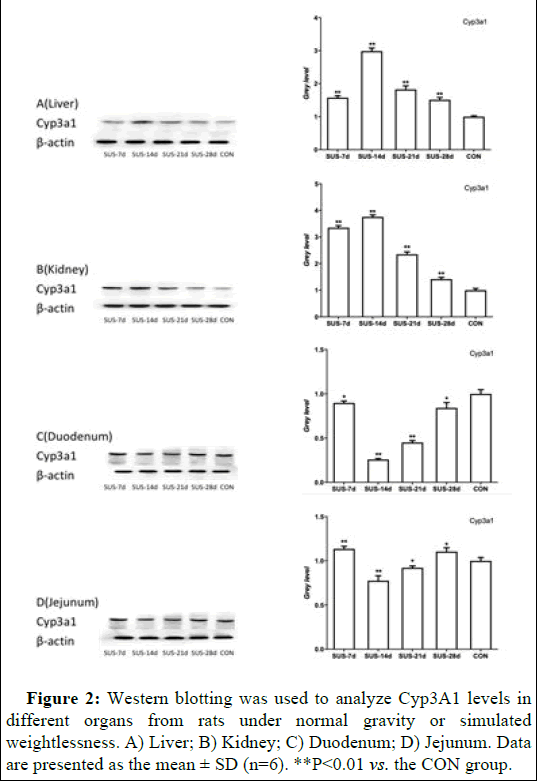
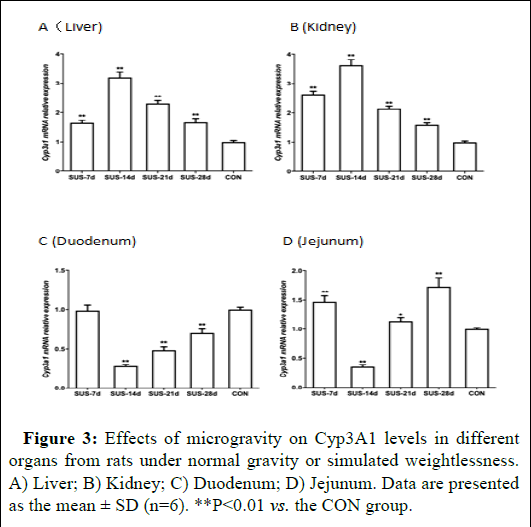
CYP3A1 mRNA expression was examined in the liver, kidney, duodenum, and jejunum of rats subjected to normal gravity or simulated weightlessness. The results showed that microgravity significantly altered CYP3A1 expression in different tissues (Figures 2 and 3). Specifically, there was a significant and sustained decline in both CYP3A1 mRNA and protein expression in the duodenum and jejunum following 7 to 14 days of suspension. The expression reached its lowest level after 14 days of suspension and then increased with 21 to 28 days of suspension. In contrast, CYP3A1 mRNA and protein expression reached its highest levels in liver and kidney after 14 days of suspension, and then the expression levels continuously decreased.
Figure 2: Western blotting was used to analyze Cyp3A1 levels in different organs from rats under normal gravity or simulated weightlessness. A) Liver; B) Kidney; C) Duodenum; D) Jejunum. Data are presented as the mean ± SD (n=6). **P<0.01 vs. the CON group.
Figure 3: Effects of microgravity on Cyp3A1 levels in different organs from rats under normal gravity or simulated weightlessness. A) Liver; B) Kidney; C) Duodenum; D) Jejunum. Data are presented as the mean ± SD (n=6). **P<0.01 vs. the CON group.
Optimization of LC–MS/MS conditions
The declustering potential and collision energy values were optimized for the mass spectrometry method to measure ZPD and IS, and the MRM transitions were monitored. Different compositions and ratios of the mobile phase and flow rate were optimized for the liquid chromatography to raise the resolution of ZPD and IS. First, 0.1% formic acid was added to the aqueous phase lead the peak shape trailing and the response lowly. Ammonium acetate (10 mM) was added into the aqueous phase to improve the peak shape and enhance the response. Finally, the sensitivity, separation, retention time, peak shape, and response were considered to determine the optimal instrumentation and chromatographic conditions. Ethyl acetate was initially used to precipitate blood protein in the plasma samples. However, the test substance could not be detected under these conditions. The use of methanol to precipitate the ZPD plasma samples provided a better extraction recovery rate.
Method validation
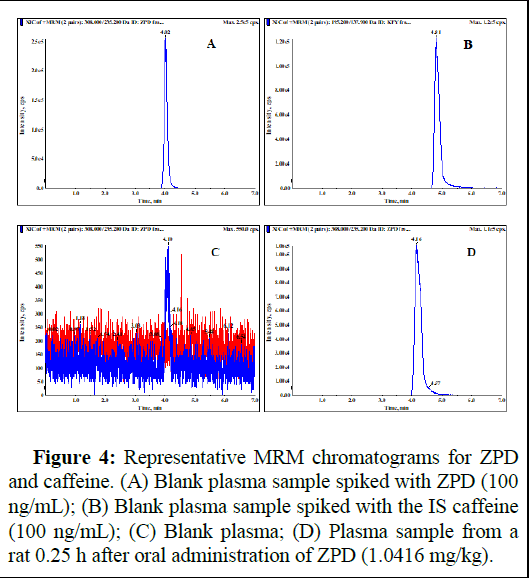
Specificity: As shown in Figure 4, the specificity of the method was verified. There was no interference peak found at the retention times for ZPD (4 min) or caffeine (4.8 min) from the plasma or tissue homogenates.
Figure 4: Representative MRM chromatograms for ZPD and caffeine. (A) Blank plasma sample spiked with ZPD (100 ng/mL); (B) Blank plasma sample spiked with the IS caffeine (100 ng/mL); (C) Blank plasma; (D) Plasma sample from a rat 0.25 h after oral administration of ZPD (1.0416 mg/kg).
Linearity, sensitivity, accuracy, and precision: For ZPD, the calibration curves for all plasma samples showed good linearity over the concentration range (Table 1). The LLOQ for ZPD was 1 ng/mL in plasma. The intra-and inter-day precision and accuracy for ZPD (including the LLOQ) were less than 9.98% (RSD) and within ± 7.83% (RE) in the plasma samples (Table 2), which was within the acceptance of ± 15% (± 20% for LLOQ).
| Matrix | Calibration curve | Linear range ( ng·mL-1 ) | Correlation coefficient (r) |
|---|---|---|---|
| Plasma | y=2.18e-2x+0.0932 | 1~200 | 0.9999 |
Table 1: Calibration curve parameters for ZPD in plasma samples.
| Matrix | Concentration (ng·mL-1 ) |
Intra day RE RSD | Inter day RE RSD | ||
| Accuracy (RE %) |
Precision (RSD %) |
Accuracy (RE %) |
Precision (RSD %) |
||
| Plasma | 1 | 7.46 | 7.95 | 7.83 | 9.98 |
| 2 | -7.16 | 6.65 | -3.92 | 5.44 | |
| 20 | -0.53 | 4.04 | -0.46 | 3.71 | |
| 100 | 0.13 | 1.86 | 0.18 | 0.9 | |
Table 2: Intra and inter-day accuracy and precision for ZPD measurements in rat.
Extraction recovery and matrix effect: The results shown in Table 3 indicate that the extraction recovery of ZPD was within 88.28 to 99.83%.
The matrix effects of ZPD were within 98.91 to 102.69%.
| Matrix | Concentration (ng·mL-1 ) |
Matrix effect (%) | Extraction recovery (%) | ||
| Mean ± SD | RSD | Mean ± SD | RSD | ||
| Plasma | 2 | 102.69 ± 3.39 | 3.3 | 88.28 ± 4.28 | 4.85 |
| 20 | 98.91 ± 6.92 | 7 | 96.60 ± 2.72 | 2.82 | |
| 100 | 99.05 ± 0.99 | 0.99 | 99.83 ± 1.04 | 1.04 | |
Table 3: Matrix effect and extraction recovery for determining the ZPD concentration in rat plasma.
Stability
The stability of ZPD post-preparation or following short-term or long-term storage and three freeze-thaw cycles is listed in Table 4. The mean ranged from 97.09 to 106.84%, and the SD ranged from 2.23 to 6.33%, with no significant loss of ZPD for all matrixes.
| Matrix | Concentration (ng·mL-1 ) |
Three Freeze-thaw cycles (%) | Long-term stability (%) | Short-term stability (%) | Post-preparation stability (%) |
| Mean ± SD (%) | Mean ± SD (%) | Mean ± SD (%) | Mean ± SD (%) | ||
| Plasma | 2 | 101.56 ± 5.20 | 97.09 ± 5.39 | 101.59 ± 10.22 | 104.04 ± 9.28 |
| 20 | 99.80 ± 16.33 | 98.89 ± 9.82 | 102.56 ± 10..00 | 106.84 ± 7.22 | |
| 100 | 98.90 ± 3.39 | 101.22 ± 2.23 | 97.96 ± 2.71 | 101.01 ± 4.38 |
Table 4: The stability of ZPD under different storage conditions.
Pharmcokinetics of ZPD
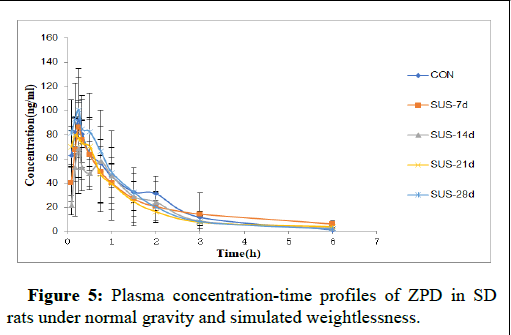
The plasma concentration-time course of ZPD in rats subjected to normal gravity or simulated weightlessness is shown in Figure 5. The Cmax was gradually reduced as the tail-suspension time was prolonged. The Cmax for the SUS-14d group was reduced by 25% compared to the CON group. Tmax was postponed along with the tailsuspension time. The highest Tmax was observed with the SUS-14d group, which was significantly different from that of the CON group.
The pharmacokinetic variables for ZPD are summarized in Table 5. Compared with the control groups, the AUC0-t of the SUS-14d and SUS-21d groups decreased significantly. Furthermore, the t1/2 and CL of the SUS-7d, SUS-14d, and SUS-21d groups were increased significantly. After the first week of tail suspension, the MRT increased sharply and then dropped.
Figure 5: Plasma concentration-time profiles of ZPD in SDrats under normal gravity and simulated weightlessness.
| Pharmacokinetic variables | CON | SUS-7d | SUS-14d | SUS-21d | SUS-28d |
| AUC(0-∞), mg/L*h | 140.72 ± 35.01 | 145.65 ± 33.80 | 120.62 ± 28.38* | 127.20 ± 22.12* | 137.18 ± 30.63 |
| MRT(0-∞), h | 1.48 ± 0.23 | 2.40 ± 0.83* | 1.78 ± 0.37 | 2.04 ± 0.47* | 1.36 ± 0.28 |
| CLz/F, L/h/kg | 7.88 ± 2.38 | 9.59 ± 6.22 | 10.04 ± 4.50 | 9.26 ± 3.30 | 8.25 ± 2.79 |
| Vz/F, L·kg-1 | 11.21 ± 3.57 | 16.54 ± 3.89 | 16.45 ± 3.08 | 18.25 ± 5.60 | 11.13 ± 2.82 |
| Cmax, ng·mL-1 | 92.17 ± 15.78 | 86.20 ± 11.61 | 68.88 ± 17.55* | 80.05 ± 15.41* | 100.45 ± 24.29 |
| AUC(0-t), ng·h·mL-1 | 135.85 ± 15.13 | 133.20 ± 24.49 | 113.48 ± 15.49* | 116.18 ± 37.31* | 133.92 ± 28.83 |
| Tmax, h | 0.24 ± 0.08 | 0.31 ± 0.10 | 0.49 ± 0.33* | 0.28 ± 0.18 | 0.26 ± 0.13 |
| t1/2z, h | 1.02 ± 0.27 | 1.47 ± 0.21* | 1.20 ± 0.12 | 1.42 ± 0.30* | 0.94 ± 0.15 |
| MRT(0-t), h | 1.31 ± 0.24* | 1.67 ± 0.30 | 1.42± 0.48 | 1.37 ± 0.21 | 1.20 ± 0.23 |
| Note: P*<0.05 vs. CON. | |||||
Table 5: Pharmacokinetic variables of ZPD in rats under normal gravity and simulated weightlessness.
Discussion
This study evaluated the impact of microgravity on CYP3A1, the enzyme involved in the metabolism and pharmacokinetics of ZPD, using the tail-suspension model. ZPD, a non-benzodiazepine sedative and hypnotic drug, plays a key role in the space life of astronauts. However, the accumulation of drugs in the body could be altered if the physiological parameters of astronauts change under microgravity [15].
The liver is the main metabolic organ of ZPD. Microgravity had a significant impact on both the mRNA and protein expression of CYP3A1 in different tissues, including the liver. Expression of this enzyme increased significantly and was sustained in the kidney and liver with prolonged tail-suspension time. After fourteen days of tail suspension, changes in the enzyme levels in the rat tissues were obvious compared to rats subjected to normal gravity. In duodenum and jejunum where ZPD is primarily absorbed, the CYP3A1 levels decreased under simulated microgravity, reaching its lowest level after fourteen days of tail suspension [16].
After tail suspension for two weeks, there would be a greater stress response, which could lead to changes in the absorption, distribution, metabolism, and excretion of drugs [17]. As a result, when the weightlessness time reached two weeks in the current study, the C-T curve significantly changed compared to that for rats subjected to normal gravity. After four weeks of tail suspension, the rats adapted to weightlessness, and the stress response in the body was reduced. Thus, the trend of the C-T curve for the SUS-28d rats was similar to that of the CON group.
Exposure to microgravity causes alterations in multiple physiological systems (e.g., cardiovascular degeneration, bone decalcification) [18]. These physiological changes may modify the pharmacokinetics of the drugs administered during the flight, leading to reduced pharmacological activity or the appearance of adverse effects in this study [19]. We found that expression of the ZPDmetabolizing enzyme CYP3A1 changed significantly in tissues under simulated microgravity. Therefore, we investigated how microgravity impacted the pharmacokinetics of ZPD.
ZPD is an important hypnotic drug used during spaceflight. However, under simulated weightlessness, the AUC and Cmax were reduced after two weeks of tail suspension. Thus, microgravity could slow down the absorption of ZPD, decreasing its blood concentration. This hypothesis is consistent with the Tmax data of this study (i.e., Tmax was the highest on day 14). In contrast, simulated weightlessness caused a gradual increase in the CL, suggesting that microgravity might accelerate the excretion of ZPD, further decreasing its blood concentration. Indeed, CYP3A1 expression in the kidney and liver was highest after 14 days of tail suspension, which could accelerate the excretion of ZPD. Based on these results, it is possible to make some dosing recommendations for ZPD during spaceflight; however, more information is necessary to predict with precision all of the human pharmacokinetic variations that may occur during spaceflight.
Conclusions
In conclusion, this study demonstrated that simulated microgravity caused changes in CYP3A1 expression in a variety of tissues. This study is the first to evaluate the pharmacokinetics of ZPD under simulated microgravity. Microgravity severely altered ZPD absorption and bioavailability. Whether the dose of ZPD should be adjusted for astronauts requires further PBPK (physiologically based pharmacokinetic) verification.
Acknowledgments
This research was supported by the 1226 Major Project (Grant Nos. AWS16J018 and BWS17J028).
Conflict of Interest
The authors declare that they have no conflicts of interest.
References
- Allain H, Monti J (1997) General safety profile of zolpidem: Safetyin elderly, over dose and rebound effects. Eur Psychiatry 12: 21-29.
[Crossref] [Google Scholar] [PubMed]
- MacFarlane J, Morin CM, Montplaisir J (2014) Hypnotics in insomnia: The experience of zolpidem. Clin Ther 36: 1676-1701.
[Crossref] [Google Scholar] [PubMed]
- Perrault GH, Morel EL, Sanger DJ, Zivkovic BR (1992) Lack of tolerance and physical dependence upon repeated treatment with the novel hypnotic zolpidem. J Pharmacol Exp Ther 263: 298-303.
[Google Scholar] [PubMed]
- Doljansky J, Kannety H, Dagan Y (2005) working under daylight intensity lamp: An occupational risk for developing circadian rhythm sleep disorder? Chronobiol Int 22: 597-605.
[Crossref] [Google Scholar] [PubMed]
- Lu SK, Bai S, Javeri K, Brunner LJ (2002) Altered cytochrome P450 and P-glycoprotein levels in rats during simulated weightlessness. Aviat Space Environ Med 73: 112-118.
[Google Scholar] [PubMed]
- Bu HZ (2006) A literature review of enzyme kinetic parameters for CYP3A4-mediated metabolic reactions of 113 drugs in human liver microsomes: Structure-kinetics relationship assessment. Curr Drug Metab 7: 231-249.
[Crossref] [Google Scholar] [PubMed]
- Krusekopf S, Roots I, Kleeberg U (2003) Differential drug-induced mRNA expression of human CYP3A4 compared to CYP3A5, CYP3A7 and CYP3A43. Eur J Pharmacol 466: 7-12.
[Crossref] [Google Scholar] [PubMed]
- Spatzenegger M, Jaeger W (1995) Clinical importance of hepatic cytochrome P450 in drug metabolism. Drug Metab Rev 23: 397-417.
[Crossref] [Google Scholar] [PubMed]
- Forrester LM, Henderson CJ, Glancey MJ, Back DJ, Park BK, et al. (1992) Relative expression of cytochrome P450 isoenzymes in human liver and association with the metabolism of drugs and xenobiotics. Biochem J 281: 359-368.
[Crossref] [Google Scholar] [PubMed]
- Kenworthy KE, Bloomer JC, Clarke SE, Houston JB, et al. (1999) CYP3A4 drug interactions: Correlation of 10 in vitro probe substrates. Br J Clin Pharmacol 48: 716-727.
[Crossref] [Google Scholar] [PubMed]
- Wienkers LC, Heath TG (2005) Predicting in vivo drug interactions from in vitro drug discovery data. Nat Rev Drug Discov 4: 825-833.
[Crossref] [Google Scholar] [PubMed]
- Pichard L, Gillet G, Bonfils C, Domergue J, Thenot JP, et al. (1995) Oxidative metabolism of zolpidem by human liver cytochrome P450S. Drug Metab Dispos 23: 1253-1262.
[Google Scholar] [PubMed]
- Kast J, Yu Y, Seubert CN, Wotring VE, Derendorf H (2017) Drugs in space: Pharmacokinetics and pharmacodynamics in astronauts. Eur J Pharm Sci 109: S2-S8.
[Crossref] [Google Scholar] [PubMed]
- Globus RK, Morey-Holton E (2016) Hindlimb unloading: Rodent analog for microgravity. J Appl Physiol 120: 1196-1206.
[Crossref] [Google Scholar] [PubMed]
- Zwart SR, Kloeris VL, Perchonok MH, Braby L, Smith SM (2009) Assessment of nutrient stability in foods from the space food system after long‐duration spaceflight on the ISS. J Food Sci. 74: H209-H217.
[Crossref] [Google Scholar] [PubMed]
- Greenblatt DJ, Harmatz JS, Roth T, Singh NN, Moline ML, et al. (2013) Comparison of pharmacokinetic profiles of zolpidem buffered sublingual tablet and zolpidem oral immediate-release tablet: Results from a single-center, single-dose, randomized, open-label crossover study in healthy adults. Clin Ther 35: 604-611.
[Crossref] [Google Scholar] [PubMed]
- Merrill AH Jr, Hoel M, Wang E, Mullins RE, Hargrove JL, et al. (1990) Altered carbohydrate, lipid, and xenobiotic metabolism by liver from rats flown on Cosmos 1887. FASEB J 4: 95-100.
[Crossref] [Google Scholar] [PubMed]
- Mulavara AP, Peters BT, Miller CA, Kofman IS, Reschke MF, et al. (2018) Physiological and Functional Alterations after Spaceflight and Bed Rest. Med Sci Sports Exerc 50: 1961-1980.
[Crossref] [Google Scholar] [PubMed]
- Gandia P, Saivin S, Lavit M, Houin G (2004) Influence of simulated weightlessness on the pharmacokinetics of acetaminophen administered by the oral route: A study in the rat. Fundam Clin Pharmacol 18: 57-64.
[Crossref] [Google Scholar] [PubMed]
Citation: Liu X, Zhang Y, Liang J, Jing J, Zhao J, et al. (2025) Effects of Simulated Weightlessness on Metabolizing Enzymes and Zolpidem Pharmacokinetics in SD Rats. Clin Pharmacol Biopharm 14: 539.
Copyright: © 2025 Liu X, et al. This is an open-access article distributed under the terms of the Creative Commons Attribution License, which permits unrestricted use, distribution and reproduction in any medium, provided the original author and source are credited.
Select your language of interest to view the total content in your interested language
Share This Article
Recommended Journals
Open Access Journals
Article Usage
- Total views: 451
- [From(publication date): 0-0 - Dec 11, 2025]
- Breakdown by view type
- HTML page views: 361
- PDF downloads: 90

