Empirical Analysis on Contribution Rate of Factors of Production on China Oil and Gas Industry - Based on Provincial Panel Data
Received: 02-Jul-2018 / Accepted Date: 17-Aug-2018 / Published Date: 24-Aug-2018 DOI: 10.4172/2472-0518.1000153
Keywords: Oil and gas industry; Factors of production; Output elasticity; Contribution rate
Introduction and Literature Review
The importance of oil and gas in a country’s national economy is beyond reproach. The foreign cooperation of China’s offshore oil and gas industry has gone through forty years. In recent years, inland provinces in China such as Xinjiang have also gradually begun their foreign cooperation in oil and gas industry. Foreign cooperation has promoted the rapid development of China’s oil and gas industry. The introduction of technology and FDI has become a decisive impetus for the development of China’s oil and gas industry.
In the research field of the petroleum oil and natural gas exploitation industry (hereinafter referred to as the oil and gas industry), Chinese scholars have studied much of macro-strategy, technical performance and demand and prices rather than enterprises, economic parameters and investment of supply and production factors. In particular, the oil and gas industry, as a typical administrative monopoly industry in China, its production performance is always a topic of concern. In this paper, we use the Solow residual value method and the Cobb-Douglas production function, to study the impact of domestic capital, foreign direct investment, labor, consumption, proven reserves of oil and gas, and total factor productivity on the economic growth of oil and gas industry from the aspects of output elasticity and contribution rates, so as to provide some theoretical support for China’s further introduction of FDI and the improvement of the oil and gas industry technology.
The Neoclassical Growth Theory takes the labor and the capital as endogenous variables and takes technology as an exogenous variable to establish the Cobb Douglas production function to evaluate the contribution of such production factors as labor and capital on economic output. The Solow residual method further infers the contribution rate of technological progress. Since the Douglas production function was explicitly put forward, many international scholars have used this model to study the growth momentum and factor contribution rate for different countries, industries, and even the micro-enterprises. The research results are different due to different research objects. Using the Douglas production function and its extended models, Chinese scholars have conducted extensive research on the macro economy, regional economies, and individual industries.
Focusing on the contribution factors of China’s economic growth, some scholars have studied the contribution of capital and labor on economic growth. For example, Xiaolu [1] suggested that after the reform and opening up, the contribution of material capital growth on economic growth is 5.1 percentage points, and the contribution of labor force growth on economic growth is 0.8 percentage points. Among researchers on the impact of foreign direct investment (FDI) on economic growth, some scholars Yang [2], Dexue and Zhiping [3], Tingjun [4], Junhong and Xiaohong et al. believe that the contribution rate of FDI on China’s economic growth has increased substantially after the reform and opening up, and the introduction of FDI has a positive spillover effect on China’s technological advance. However, at the same time, other scholars believe that the Chinese strategy of “Trading Domestic Market for Technology” does not work well because transnational corporations always keep their secrets of core technologies. Liu Jianmin and Lu Lihong et al. have conducted similar researches and have reached similar conclusions that the domestic capital has the greatest impact on the GDP growth rate, followed by the growth rate of labor input, and then the growth rate of FDI. Liu Jianmin also concludes that the contribution of FDI on economic growth varies from region to region [5,6]. The contribution rate of FDI on the economic growth in the eastern region of China is significantly greater than that in the central and western regions. That is, for every one percentage point increase in FDI across the country, the GDP of China can grow by 0.07 percentage points, in which the GDP growth in the eastern region accounts for 0.02 percentage points. Some scholars Zhang Erzhen and Dai Xiang, Pei Changhong, et al. believe that the factor of human input has played a pivotal role in China’s long-term and rapid economic development since its reform and opening up, especially after it joined the WTO. In these decades, China has made full use of its cheap human capital advantages with the help of an open economic system in the world and the international division of labor [7].
In terms of regions, Lihong and Yajun analyzed the contribution rate of domestic capital, FDI, and labor force on the economic growth in Shaanxi Province through an empirical study, using the Douglas production function as the theoretical basis [8]. They concluded that the domestic investment acts more in promoting the economic growth, while the FDI, although the scale is small, has much greater unit contribution rate on economy than the domestic capital, which is roughly a five-fold relationship. Xiaoqing studied the technological level of the manufacturing industry in Guangdong Province through a DEA (data envelopment analysis) model and believes that the introduction of FDI can promote the improvement of the technological level in various industries.
Lifeng and Jiaying studied the investment and output issues in the energy industry with their focus on the oil and gas industry. They believe that the investment in the oil and gas industry has seen rapid increase in recent years, but the increase in investment has not led to a significant increase in production; the relatively stable oil production implies that there is an inconsistency between the industry investment and output. The main reason for this phenomenon is that the investment output in the oil and gas industry is featured with a time lag, and the exploration cost is high. The research of Keqiang et al. goes even further. While considering the factors of scale economies and technological advances, they incorporated the resource depletion, the lags in investment output, and the demand factor into the econometric model, and concluded that the two year lag is the optimal lag order of investment in the oil and gas industry. The resource depletion and the lagging factors of capital input and output have a significant impact on TFP (total factor productivity), and the average growth rate of the oil and gas industry TFP in 2003~2010 is 3.88%. Feng and Zhaozi found that the improvement of internal efficiency is an important reason for economic growth in the oil and gas industry. Xiaoling measured the impact of resource mis-allocation on the TFP of oil and gas industry through a HK model and an empirical study [9]. She proposes that the resource mis-allocation is the main reason of TFP loss, and the loss of TFP from resource mis-allocation is much greater than that from the output distortion and labor mis-allocation.
According to the above-mentioned literatures, we can barely find any research on the contribution rates of production factors closely related to China’s oil and gas industry. In particular, there is no such research that can clearly define the output elasticity of the factor input in China’s oil and gas industry by incorporating the domestic capital and FDI into the same production function model.
Methods and Econometric Model
This paper establishes an econometric model based on the Cobb- Douglas production function Y=AKaLb to analyze the contribution rates of factors on production that affect oil and gas output [10]. According to the research needs, in order to distinguish the different effects of domestic capital and FDI on output, this paper divides the capital into the domestic capital and the foreign direct investment (FDI) and uses two variables related to domestic capital, namely the total fixed assets (Asset) and the annual fixed assets investment (k) in consideration of the specific characteristics of the oil and gas industry. Among the two variables, the total fixed assets represent the previous asset stock, and the fixed assets investment represents the current fixed assets investment [11]. Meanwhile, this paper also introduces such variables as the annual production value of oil and gas, described as Y (or gdpoil), the annual employment population of oil and gas industry (Labor), the annual consumption of oil and gas (Con), and the proven reserves of oil and gas (Sto).
This paper assumes that the domestic capital and the foreign capital are homogeneous and there is a scale economy effect in the oil and gas industry. A basic input and output model of oil and gas industry is established according to the theory of Cobb-Douglas production function by taking the logarithm on both sides of the production function; the basic model is described as the following equation:
Y=LnA+β1Lnaset+β2Lnk+β3Lnfdi+β4Lnlabor (1)
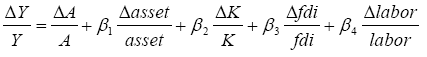
According to Solow’s economic growth equation, the contribution rates of FDI and other factors on economic growth can be defined by taking the derivate of both sides of the basic model. The result is:
 (2)
(2)
In which  indicates the economic growth rate,
  indicates the economic growth rate related to the technological progress, and
  indicates the economic growth rate related to FDI; same for other variables.
Sample Data Description and Data Processing
Data source
In this paper, we collected relevant data about oil and gas industry from 19 oil and gas producing provinces (some of them are municipalities and autonomous regions) in China. The nineteen provinces are Shandong, Liaoning, Hebei, Shanghai, Guangdong, Tianjin, Jiangsu, Hainan, Inner Mongolia, Jilin, Heilongjiang, Henan, Hubei, Chongqing, Sichuan, Shaanxi, Gansu, Qinghai, and Xinjiang, of which the first 8 provinces are coastal provinces, and the latter 11 provinces are inland provinces. Due to limited available data, only the data in 2000~2015 in these 19 provinces is obtained for the variables of gdpoil, asset, k, fdi, and labor.
The data in this paper mainly comes from the China Industry Statistical Yearbook [data including the gross industrial output value of the oil and gas industry (gdpoil, described in RMB 100 million), the average annual employment population of oil and gas industry (labor, described in 10 thousand people), the total fixed assets of the oil and gas industry (asset, described in RMB 100 million)] and the National Bureau of Statistics of China [data including the gross domestic product (GDP, described in RMB 100 million), the total investment of fixed assets in the oil and gas industry (k, described in RMB 100 million), and the total amount of investment by foreign-invested enterprises (described in USD 1 million)].
For the missing data of some years in the Statistical Yearbook, we have conducted a survey and made some inquiries under the help of the system working personnel of the National Bureau of Statistics on its intranet, and have supplemented the missing data.
For the oil and gas industry, since there is no statistical data on FDI at the provincial level, we assumes that the utilization rate of FDI in the oil and gas industry is the average level of all other industries in each province. The following method is used for data substitution:

The reason why we used the total amount of investment by foreign-invested enterprises in each province rather than the fixed assets investment (described in RMB 100 million) is that we believe that a large part of the foreign investment introduced into the oil and gas industry is the investment in exploration and drilling services. The use of the fixed assets investment data cannot fully reflect the industry characteristics of oil and gas industry. At the same time, according to the our working experiences, we believe that the current fixed assets investment has a relatively small impact on the output of the oil and gas industry, while the impact of total fixed assets on the output is more obvious. Therefore, this paper introduces two variables asset and k, which are related to the domestic capital to analyze their impact on oil and gas output.
Data processing
For the five variables in the paper, we use labor directly; we eliminated the effect of deflator on provincial GDP effect of producer price index on gdpoil the effect of price index of fixed assets investment on asset and k, and the effect of exchange rate changes and price index of fixed assets investment on fdi. All the sample data from 2000~2015 were processed according to the price index based on 1999. Due to the requirement of taking logarithm, for the k and labor whose value is zero in a year for a province, their values are taken as 0.0001 and 0.005, respectively.
Empirical Results
Results of output elasticity of variables in basic models
First of all, we can see positive correlation of five variables (gdpoil, asset, k, fdi and labor) by plotting the sequential line diagram of the data set by metrology software (Figure 1).

Figure 1: Association between disability and post-operative Oxford hip score.
Take panel data of 19 provinces as samples. For eqn. (1), Lngdpoil is taken as dependent variable, while Inasset, Lnk, Lnfdi and Lnlabor are taken as independent variables, After Hausman Test, the fixed effect model is used and Cross-section Weights (Panel EGLS) is adopted to eliminate heteroscedasticity effect of panel data for regression, and then regression results are obtained, as shown in Table 1.
| Variable | Coefficient | Std. Error | T-Statistic | Prob. | |
|---|---|---|---|---|---|
| LNFDI | 0.521548 | 0.020722 | 25.16849 | 0 | |
| LNASSET | 0.154967 | 0.015803 | 9.806442 | 0 | |
| LNK | 0.032144 | 0.00865 | 3.716064 | 0.0002 | |
| LNLABOR | 0.106296 | 0.018413 | 5.772731 | 0 | |
| C | 1.645592 | 0.111601 | 14.74538 | 0 | |
| Effects Specification | |||||
| Cross-section fixed (dummy Variable) | |||||
| Weighted Statistics | |||||
| R-squared | 0.992646 | Mean dependent var | 10.48554 | ||
| Adjusted R-squared | 0.992034 | S.D dependent var | 7.253028 | ||
| S.E. of regression | 0.345583 | Sum squared resid | 31.52886 | ||
| F-statistic | 1619.836 | Durbin-watson stat | 1.028294 | ||
| Prob(F-statistic) | 0 | ||||
| Unweighted Statics | |||||
| R-squared | 0.944619 | Mean dependent | 4.248732 | ||
| Sum squaered res | 34.98049 | Durbin-watsomOn start | 0.733582 | ||
Table 1: Results of regression analysis of basic models.
Results of multivariate linear regression equation are as follows:
LNGDPOIL=1.6456+0.5216LNFDI+0.1550LNASSET+0.032LNK +0.1063LNLABOR (3)
It can be seen from the above analysis that the model has passed the economic test and statistical test, and the R2 value is large, which indicates a high goodness of fit; the statistical value of F is large enough. The low DW value indicates that there may be an autocorrelation problem in the cross-section group. The lagging-one-year explained variable AR (1) is introduced into Model (1) as a new explanatory variable, and the model changed as follows:
Y=LnA+β1Lnasset+β2Lnk+β3Lnfdi+β4Lnlabor+AR(1) (4)
After regression analysis of panel data with Eviews, the DW value (1.464601) has been improved obviously and can meet experience requirement. The regression results are shown in Table 2 and results of regression equation are shown in eqn. (5):
| Variable | Coefficient | Std. Error | T-Statistic | Prob. | |
|---|---|---|---|---|---|
| LNFDI | 0.370845 | 0.026372 | 14.06206 | 0.0000 | |
| LNASSET | 0.067935 | 0.013783 | 4.929060 | 0.0000 | |
| LNGDPOIL 2 | 0.387644 | 0.043839 | 8.842382 | 0.0000 | |
| LNK | 0.025938 | 0.009083 | 2.855820 | 0.0047 | |
| LNLABOR | 0.079173 | 0.021905 | 3.614349 | 0.0004 | |
| C | 0.981174 | 0.143578 | 6.833737 | 0.0000 | |
| Effects Specification | |||||
| Cross-section fixed (dummy Variable) | |||||
| Weighted Statistics | |||||
| R-squared | 0.993162 | Mean dependent var | 8.366889 | ||
| Adjusted R-squared | 0.992522 | S.D dependentvar | 4.851514 | ||
| S.E. of regression | 0.282888 | Sum squared resid | 19.68627 | ||
| F-statistic | 1553.345 | Durbin-watson stat | 1.464601 | ||
| Prob(F-statistic) | 0.000000 | ||||
| Unweighted Statistics | |||||
| R-squared | 0.960278 | Mean dependent | 4.267564 | ||
| Sum squaered res | 24.00174 | Durbin-watsomOn start | 1.339939 | ||
| Dependent Variable:LNGDPOIL | |||||
| Method:PanelEGLS (Cross-section weights) | |||||
| Date:06/10/17 Time:10:10 | |||||
| Sample:2000 2015 | |||||
| Periods include:16 | |||||
| Cross-section included:19 | |||||
| Total panel(unbalanced)observation:270 | |||||
| Linear estimation after one-step weighting matrix | |||||
Table 2: Regression results after introduction of the lagging-one-year explained variable.
LNGPOIL=0.9812+0.3708*LNFDI+0.0679*LNASSET+0.0259*LN K+0.0792*LNLABOR+0.3876*LNGPOIL(-1) (5).
It can be seen from eqn. (5) that output elasticity of FDI is 0.3708, indicating that every 1% increase of FDI will drive output growth by 0.3708%; output elasticity of total fixed assets, fixed assets annual investment and labor force respectively are 0.0679, 0.0259 and 0.0792. Constant terms illustrate the impact of technological progress on output.
The 19 provinces are divided into two groups, 8 coastal provinces and 11 inland provinces, and regression analysis is carried out by the same method. Hausman test results show that analysis results of two groups using fixed effect model are still better. See Table 3 for results of group regression.
| Provinces | Effect | Variable | Coefficient | t-Statistic | R-squared | F-statistic | D-W |
|---|---|---|---|---|---|---|---|
| 8 coastal provinces | Fixed Effect | LNK | 0.019142 | 3.075566 | 0.996058 | 2252.78 | 1.288864 |
| LNLABOR | 0.124488 | 6.11029 | |||||
| LNFDI | 0.338631 | 15.00622 | |||||
| LNASSET | 0.065367 | 5.2007 | |||||
| LNGDPOIL (-1) | 0.168994 | 5.657229 | |||||
| C | 1.790438 | 17.71416 | |||||
| 11 inland provinces | Fixed Effect | LNK | 0.022495 | 1.804993 | 0.976359 | 410.2489 | 1.539237 |
| LNLABOR | 0.008894 | 0.038402 | |||||
| LNFDI | 0.518696 | 12.75103 | |||||
| LNASSET | 0.108594 | 4.071405 | |||||
| LNGDPOIL (-1) | 0.389078 | 7.431602 | |||||
| C | 0.583013 | 3.129587 |
Table 3: Comparison of regression results between coastal and inland provinces.
Grouping regression results show that the influence of labor and fixed assets investment (k) on oil and gas output value is not obvious in inland provinces, but more obvious in coastal provinces; in terms of labor output elasticity, 8 coastal provinces are larger than 11 inland provinces. The population of inland provinces has a weak impact on oil and gas output; in terms of output elasticity of foreign investment, inland provinces are higher than coastal provinces; coastal provinces are greater than inland provinces when it comes to the impact of technological progress on output.
By analyzing inconsistency of marginal output elasticity between coastal provinces and inland provinces in terms of oil and gas industry, the main reasons can be understood as: (1) the offshore oil and gas production accounts for a certain proportion of oil and gas production in coastal provinces, and commonly seen cooperation with foreign countries in offshore oil and gas industry attracts more foreign investment, more technology input and less labor input, thus, per capital oil and gas output is greater and technological progress has a significant impact on output. (2) Due to the state-owned background and historical factors, the oil and gas fields in inland provinces have more employees and lower output elasticity of labor; less foreign capital is introduced, and output elasticity of foreign investment is higher; and the impact of technological progress on inland oil and gas fields is relatively less than that in coastal provinces.
Calculation of contribution degree of economic growth of various factors
This paper uses result eqn. (5) of empirical analysis and result eqn. (2) of contribution rate after introducing the explained variables to calculate economic growth contribution rate of domestic investment, foreign investment, labor investment and technological progress in the oil and gas industry nationwide.
Table 4 below is the data on oil and gas output, total fixed assets, fixed assets investment, utilization of foreign capital and employed population of China’s oil and gas industry from 2003 to 2015. Except for labor, other data are processed exponentially based on the 2003 price level.
| Year | gdpoil | k | fdi | asset | Labour (10 thousand persons) |
|---|---|---|---|---|---|
| 2003 | 3483.12 | 916.07 | 14.96 | 3608.67 | 72.68 |
| 2004 | 3820.58 | 1030.61 | 11.34 | 4269.43 | 96.12 |
| 2005 | 4039.45 | 1345.57 | 9.27 | 4628.68 | 85.58 |
| 2006 | 4056.43 | 1616.89 | 28.21 | 5507.61 | 93.33 |
| 2007 | 4272.97 | 1864.98 | 50.97 | 6268.49 | 90.67 |
| 2008 | 4018.58 | 2042.92 | 64.07 | 6621.58 | 112.76 |
| 2009 | 4797.45 | 2183.27 | 68.98 | 9336.36 | 102.38 |
| 2010 | 4573.67 | 2274.05 | 38.05 | 13397.79 | 106.06 |
| 2011 | 4779.33 | 2154.26 | 60.57 | 9580.97 | 110.98 |
| 2012 | 4432.65 | 2178.41 | 56.42 | 8585.02 | 80 |
| 2013 | 4406.53 | 2721.41 | 57.75 | 8689.5 | 77.52 |
| 2014 | 4690.3 | 2813.55 | 51.64 | 11110.03 | 76.93 |
| 2015 | 5158.19 | 2510.51 | 33.16 | 11315.17 | 73.52 |
Note: 1. Labor and asset are from China Industry Statistical Yearbook, with the same statistical caliber as above; the rest of the data is from the National Bureau of Statistics of China. 2. fdi is investment in fixed assets of foreign-invested enterprises (including Hong Kong, Macao and Taiwan); K is the investment in fixed assets.
Table 4: Related data of China's oil and gas industry from 2003 to 2015 Unit: RMB 100 million.
In order to unify the comparison standard and facilitate accuracy of growth rate calculation, this paper adopts extreme value method and carries out standardized processing and growth rate computation to data in Table 2. The standardized value is shown in Table 4 and growth rate calculation is shown in Table 5. The standardized formula is as follows:
X=(Xi-min(Xi))/(max(Xi)-min(Xi)) (6)
| year | gdpoil | k | fdi | asset | labor |
|---|---|---|---|---|---|
| 2003 | 0 | 0 | 0.09524 | 0 | 0 |
| 2004 | 0.201459 | 0.060362 | 0.034684 | 0.0675 | 0.58483 |
| 2005 | 0.332126 | 0.226354 | 0 | 0.104198 | 0.321856 |
| 2006 | 0.342259 | 0.369344 | 0.317168 | 0.193985 | 0.51522 |
| 2007 | 0.471535 | 0.500089 | 0.698392 | 0.271712 | 0.448852 |
| 2008 | 0.319662 | 0.593868 | 0.917897 | 0.307781 | 1 |
| 2009 | 0.78464 | 0.667834 | 1 | 0.585108 | 0.741018 |
| 2010 | 0.651048 | 0.715676 | 0.481915 | 1 | 0.832834 |
| 2011 | 0.773826 | 0.652542 | 0.859152 | 0.610096 | 0.955589 |
| 2012 | 0.566862 | 0.66527 | 0.789733 | 0.508355 | 0.182635 |
| 2013 | 0.551269 | 0.951439 | 0.81203 | 0.519028 | 0.120758 |
| 2014 | 0.720674 | 1 | 0.709576 | 0.766296 | 0.106038 |
| 2015 | 1 | 0.840294 | 0.400167 | 0.787252 | 0.020958 |
Table 5: Values Standardized based on extreme value theory for data in Table 2.
For the normalized value equal to 0, the denominator for growth rate of the next period is zero, so the calculation of the growth rate is insignificant. In this paper, variation of original data of the next period and the period following the next period and the growth rate calculated according to standardized value in the period following the next period are used to calculate the growth rate of the next period through equivalent conversion.
Based on eqn. (5) and data in Table 6, growth share and growth contribution rate of various factors can be calculated, as shown in Table 7.
| year | gdpoil | k | fdi | asset | labor |
|---|---|---|---|---|---|
| 2003 | NA | NA | NA | NA | NA |
| 2004 | 1.057288693 | 1.30561342 | -0.635821457 | 1.084143767 | 0.890345402 |
| 2005 | 0.648603848 | 2.7499378 | -0.601019235 | 0.54368468 | -0.449658703 |
| 2006 | 0.030511278 | 0.631707765 | 1.806812941 | 0.861692254 | 0.600775194 |
| 2007 | 0.377713337 | 0.353992337 | 1.201958879 | 0.400688031 | -0.128813559 |
| 2008 | -0.322082083 | 0.187525696 | 0.314300237 | 0.132746255 | 1.227904391 |
| 2009 | 1.454591396 | 0.124550072 | 0.089447371 | 0.901053311 | -0.258982036 |
| 2010 | -0.170259204 | 0.071636746 | -0.518085436 | 0.709084997 | 0.123905724 |
| 2011 | 0.188585594 | -0.088215577 | 0.782789308 | -0.389903766 | 0.147393649 |
| 2012 | -0.267455395 | 0.019505128 | -0.080799141 | -0.166762698 | -0.808877285 |
| 2013 | -0.027507871 | 0.430154861 | 0.028232879 | 0.020995345 | -0.338797814 |
| 2014 | 0.307298924 | 0.051039551 | -0.126170492 | 0.476405913 | -0.121900826 |
| 2015 | 0.387590547 | -0.159705662 | -0.436047187 | 0.027347495 | -0.802352941 |
| Average | 0.305406631 | 0.405683049 | 0.152133222 | 0.383431299 | 0.0067451 |
Table 6: Calculation results of standardized numerical growth rate.
| Oil and gas output value | Total fixed assets | Investment in fixed assets | Foreign direct investment | Labor force | Technological progress | |
|---|---|---|---|---|---|---|
| Average growth rate | 0.305407 | 0.383431 | 0.405683 | 0.152133 | 0.006745 | N/A |
| Output elasticity | N/A | 0.067936 | 0.025938 | 0.370845 | 0.079173 | N/A |
| Growth share | N/A | 0.026049 | 0.010523 | 0.056418 | 0.000534 | 0.211883 |
| Contribution rate | 1 | 0.085292 | 0.034454 | 0.18473 | 0.001749 | 0.693775 |
Note: Growth share=average growth rate × output elasticity; contribution rate=growth share/average growth rate of oil and gas output value.
Table 7: Analysis of growth factors of oil and gas industry from 2003 to 2015.
Conclusion and Recommendations
Conclusion
Through panel data model, we analyzed the input factor data of oil and gas industry in 19 major oil producing provinces in China. Results show that technological progress makes the greatest contribution to the industry, followed by foreign direct investment, and contribution rate of fixed assets is not obvious, and contribution rate of labor force is the smallest. Specifically, contribution rates of technological progress, foreign investment, total fixed assets, annual fixed assets investment and labor force are respectively 0.69, 0.18, 0.09, 0.03 and 0.002.
By analyzing statistical data from 2000 to 2015, we can also see that the employed population of oil and gas industry in most provinces has shown a trend of increasing at first and then decreasing, which shows that China’s oil and gas industry has begun to undergo kinetic energy conversion, downsize workforce and increase efficiency. Increasing human input is no longer taken as the main growth mode. Meanwhile, after excluding the price factor, the amount of foreign capital introduced by each province shows a decreasing trend year by year, which is related to progress of China’s oil and gas production technology and the increasing self-production rate year by year.
After grouping regression of China’s coastal and inland provinces, the results show that labor input in inland provinces has no obvious influence on the output of oil and gas industry, and contribution rate of foreign capital to output is higher than that in coastal areas, which indicates that oil and gas industry in inland areas is in need of more foreign capital. From the constant term C-value and output elasticity of various factors, we can see that the technological progress in eastern coastal areas has a significant influence on oil and gas output and has a great contribution, which indicates that oil and gas industry in eastern areas has achieved optimized intensive development; The employment over-population is seen in oil and gas mining industry in inland areas and introduction of domestic and foreign capital still play a significant role in promoting oil and gas output in this area. Due to industry characteristics and impact of national stable production policy, oil and gas output of the previous period has a great impact on the output of current period.
Recommendations
In the new era, global energy industry is facing the following major difficulties. First, traditional energy reserves remain high, and global reserves of oil and natural gas have not decreased. However, new energy sources are emerging one after another, and human beings pay more attention to new energy sources because of their emphasis on environmental protection. Traditional energy industry is facing great pressure of survival and development, and needs to improve production efficiency to compete with new energy sources. Second, there is less prospect for terrestrial energy exploration, but there are huge oil and gas reserves in vast marine areas, which are difficult and costly to exploit, and require constant improvement in the level of exploitation and international cooperation in order to achieve environmental protection and low-cost exploitation.
Third, for China’s oil and gas demand, there are three main ways of safe supply, that is, domestic exploitation, international procurement and overseas investment exploitation. Whether domestic exploitation or international investment, technological progress will act as the leading force to promote future development of oil and gas industry.
According to results of this paper and in combination with the situation of China’s oil and gas industry development, the following recommendations can be put forward:
(1) Foreign investment is still a beneficial factor to promote the development of oil and gas industry. While going abroad to invest and develop foreign oil and gas resources, China still needs to continue to intensify its efforts to attract foreign investment, absorb foreign management experience, and utilize foreign technology and equipment, so as to promote rapid development and accumulation of China’s oil and gas extraction industry and to lay a solid foundation for speeding up the pace of going abroad in the future. In particular, foreign cooperation in offshore oil and gas, joint development of disputed areas in the South China Sea, and newly developed oil fields in the western region should all maintain continuity and coherency in the foreign capital introduction policy. In this regard, China’s Ministry of Commerce classified oil and gas exploration as an encouraging industrial project in Catalogue for the Guidance of Industries for Foreign Investment 2017, which is the embodiment of this recommendation.
(2) Technological progress has a decisive impact on development of oil and gas industry. Technological progress can reduce production costs, improve production efficiency, increase new reserves and discover new energy sources. Chinese oil and gas enterprises should increase their investment in technology research and development, improve their ability of technological innovation, and pay attention to absorbing and learning their technologies and management experience in the course of cooperation with foreign investors.
References
- Wang Xiaolu (2000) Sustainability and Institutional Reform of China's Economic Growth [J]. Economic Research Journal 7: 3-16.
- Yang Y, Lu L, Yajun G (2009) The Positive Analysis of the Influence of FDI upon the Economic Growth in Shanxi Province [J]. Journal of Socialist Theory Guide 12: 79-82.
- Dexue L, Zhiping F (2000) Model and Its Application for Evaluating the Contribution of Foreign Resources to Economic Growth [J]. Journal of Northeastern University(Natural Science) 21: 214-217.
- Tingjun Z, Liu J (2008) Empirical Analysis on Economic Effects of Foreign Investment Introduction into China [M]. Beijing: People's Publishing House.
- Min Y (2007) Empirical Analysis on Contribution Effect of FDI on China Technology Progress [J]. Modern Economic Science 29: 74-78.
- Lifeng Z, Cui J (2009) The Econometric Model Research of the Energy Industry Investment and the Energy Product of China [J]. Technoeconomics & Management Research 3: 3-5.
- Keqiang W, Wu Y, Liu H (2013) Measurement Framework and Empirical Study on Total Factor Productivity of Energy Mining Industry in China [J]. Economic Research Journal 6: 127-140.
- Xiangping S (2005) Demonstration analysis of foreign direct investment's contribution to China's economic growth [J]. Special Zone Economy 4: 37-39.
- Feng W, Zhaozi R (2013) Growth of Internal Efficiency and Loss of External Efficiency of China's State-owned Monopolized Industries [J].Journal of Anhui University (Philosophy and Social Sciences) 1: 149-156.
- Xiaoling Y (2016) Recourse Misallocation and Total Factor Productivity in Chinese Energy Industry [J]. Journal of Hunan University (Social Sciences)3: 77-84.
- Junhong B (2014) Independent R&D, Cooperative Innovation and Foreign Investment Introduction [J]. Finance & Trade Economics 11: 89-100.
Citation: Yang Q, Jian L, Dai G (2018) Empirical Analysis on Contribution Rate of Factors of Production on China Oil and Gas Industry - Based on Provincial Panel Data. Oil Gas Res 4: 153. DOI: 10.4172/2472-0518.1000153
Copyright: © 2018 Yang Q, et al. This is an open-access article distributed under the terms of the Creative Commons Attribution License, which permits unrestricted use, distribution, and reproduction in any medium, provided the original author and source are credited.
Select your language of interest to view the total content in your interested language
Share This Article
Recommended Journals
Open Access Journals
Article Tools
Article Usage
- Total views: 3324
- [From(publication date): 0-2018 - Dec 04, 2025]
- Breakdown by view type
- HTML page views: 2431
- PDF downloads: 893