Engineering Properties and Shrinkage Limit of Swelling Soils in Greece
Received: 16-Mar-2015 / Accepted Date: 08-Jun-2015 / Published Date: 18-Jun-2015 DOI: 10.4172/2157-7617.1000279
Abstract
The engineering problems of swelling soil have arisen in Greece as well as in other parts of the world when a combination of unsaturated clay soils and uneven distribution of rainfall can occur. Expansive soil cause significant damage to structure and roadways by cyclic shrink-swell within the active zone of soil. This is one laboratory way to identify the shrinkage potential of clay soil in Greece. Laboratory tests were performed to examine the effectiveness of various methods in alleviating the adverse results of seasonal swelling – shrinking in connection with roads and buildings foundation, giving special attention to shrinkage limit test using the mercury apparatus, suggested by the Transport and Road Research Laboratory.
Keywords: Expansive soils; Soils engineering properties; Shrinkage limit
11400Introduction
The significance of swelling soils in relation to geotechnical problems is now widely recognised. Geotechnical problems arising from expansive unsaturated soils are well demonstrated by many case histories all over the world, especially in geographical zones having arid, semi-arid and tropical climatological conditions.
The existence of specific expansive minerals in the clay soil related to the climatological conditions, seasonable variation of rainfall precipitation (wet and dry periods) and fluctuation of water table in Mediterranean countries, has resulted to induce unexpected shrinkage and swelling movements with all the unfavourable consequences. It was observed that light industrial structures and small buildings suffer from heaving, road pavements to develop shrinkage cracks, canal lining and low embankments resting on swelling soil or embankments constructed with swelling soil, suffer distortion and cracking.
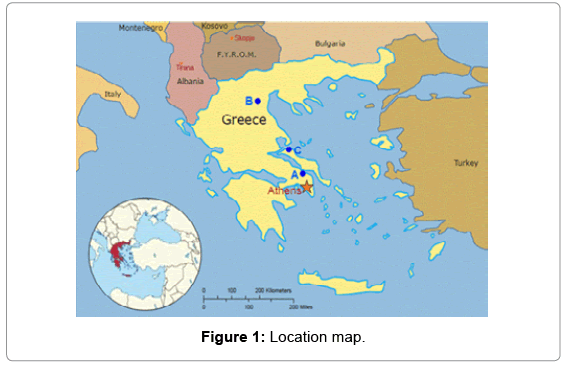
A great variety of problems related to swelling soils and structural damage have been reported over the recent years. About ten years ago it became apparent that throughout most of the Greek mainland and some islands, due to swelling soils, structural damages occurred in the form of wide cracks in the wall, distortion of floor, heaving of beds in canal, rutting of roads, especially in large drainage basins where sediments accumulated during the Neocene era. Experiences from swelling soils in Greece were published previously by Christodoulias and Gassios [1], Stamatopoulos, Christodoulias and Giannaros [2]. Each research was conducted to explore the behavior of expansive soils for a specific civil structure in a certain area (Figure 1).
Origin and distribution
The expansive soils in Greece are mainly distributed in large Neocene Epoch plains, with some occurrences of terraces up to 10 m high. In these plains the sediments are of lacustrine origin but also alluvial, pluvial and alluvial deposits enriched the areas. The material sources are from the weathering of various types of rocks such as basic and ultra-basic igneous rocks, limestone, and mudstone containing silicate minerals. These minerals through oxidation and chemical reaction leaching and ion exchange, convert into clay minerals such as chlorite, montmorillonite, illite and kaolonite, which influence the engineering properties of expansive soils due to active physicochemical properties. On the other hand in Greece has an arid to semi-arid climate conditions, with substantial rains and fluds in the autumn, which follow the regular dry and hot climate cycles of the summer.Such a climate creates a favorable environment for the formation and reaction of expansive soils. For the purpose of this investigation three areas have been chosen. The first one is named location A (near village Sximatari) and is about 90 km North of the capital, the second is named location B (near village Exohi) and is 500 km North, to N-E of Athens and the third is named location C (Agia Anna of Evia) and is in the N-E part of one island about 200 km of Athens (Table 1).
| Properties | Location A | Location B | Location C |
|---|---|---|---|
| Liquid limit (%) Plasticity index (%) Natural water content (%) Swelling pressure (kPa) Consistency indexIc Free swell (%) Bar Linear Shrinkage (%) Clay content (%) Dry unit weight (kN/m³) Compressibility index Shrinkage limit % |
45-64 26-51 10.6-24.0 60-310 0.95-1.26 50-110 9.6-23 18-58 1.52-1.64 0.272-0.350 6-20 |
46-57 24-35 11,7-24.0 30-158 0.91-1.18 55-80 11-17.1 20-48 1.51-1.88 0.165-0.185 9.5-13.5 |
51-65 29-46 16-32 40-100 0.7-1.16 50-85 12-17 28-50 1.40-1.65 0.173-0.230 10.5-11.0 |
Table 1: Summary of measured properties from random selected areas.
Identification tests: The first laboratory-based evidence of swelling potential was given by grain size analyses and Atterberg limits [3-6]. The material passing the US sieve No 200 varied between 70% and 100%, having a clay fraction between 23-52%, average 34.6% and SD=9.3. For the grain size analysis of the clay fraction smaller than 2 μm, sodium phosphate solution was used as dispersant. From the Liquid Limit (LL) results (ASTM D4318) the samples yield liquid limit values between 45-65% and mean value 54.6. From the plasticity index test (PI) results the samples revealed plasticity index values varying between 24-51% and average 30.1. Such clays belong to the CL and CH groups of the unified classification system. Further indications of swelling potential came from X-ray analyses, bar linear shrinkage, shrinkage limits using the mercury apparatus suggested by the Transport and Road Research Laboratory [7], free swell tests in suspension [3].
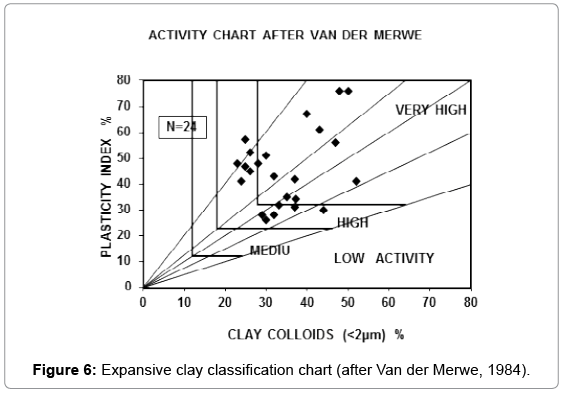
The Van der Merwe [4] activity chart of Figure 2 indicates that the soil samples have high and very high activity. Swell pressure in the oedometer under an external pressure of 7 kPa (approximately 1 psi) were measured on undisturbed soil samples taken out by Shelby. Finally the cation exchange capacity (CEC) measurement of representative soil samples in comparison with x-ray analyses and the activity charts supported the investigation in order to classify areas having high, medium and low swell potential.
The Mineralogical Analysis of Clay Fraction
The crystalline mineralogical components of the clay soils were identified by the powder method of X ray diffraction analysis. The clay samples were tested with a Philips diffractometer, using copper radiation with nikel filter (CuKa). Before testing a U.S. No 40 sieve was used to remove the non-clay minerals, the hydrometer method [8] was also used to isolate the silt and clay fraction. The oxygen peroxide method [8] was used to purify each sample from organic content. In some clay samples was noticed that the three main clay minerals, montmorillonite, kaolinite, chlorite, were giving not clear peaks. In that case, Wilson’s suggestions was used and the samples were special treated with glycerin and heated up to 120°C, in order to distinguish the montmorillonitic peak.
The mineralogical composition in clay samples (Table 2), was determined by X-ray diffraction analyses, and the quantitative analyses was obtained by the method described by Bayliss [9] and Zangalis [10]. From the quantitative X-ray analysis the following minerals were found to be present and the results from three locations are shown on Table 2.
| Sample | Montmorillonite | Illite | Chlorite | Quartz | Fe- allucite |
|---|---|---|---|---|---|
| Location A | 33 | 10 | 10 | 15 | 0 |
| Location B | 19 | 5 | 5 | 20 | 10 |
| Location C | 43 | 11 | 0 | 20 | 0 |
Table 2: Clay mineralogy by X-ray diffraction (percentage composition).
Cation exchange capacity
The precise definition of cation exchange capacity (CEC) of the soil samples was measured with the method of ammonium acetate and the determination of exchangeable ions was measured with a cornflame photometer. For these, three soil samples were collected and tested for CEC. As it was identified, the CEC varied between 34 meq/100 gr to 58.9 meq/100 gr. Also it was important to measure the pH in the vicinity of each of the above mention soil samples and the soil pH determination was measured according to BS 1377: Part 3 [8]. The results of the measurements from soil samples vary between pH=7.50 and 9.46. On Table 3 we can see for each location the results of CEC, Montmorilonite, Liquid limit and Plastic limit.
| Location A | Location B | Location C | |
|---|---|---|---|
| Montmorilonite % | 33 | 19 | 43 |
| Liquid limit % | 56 | 42 | 51 |
| Plastic limit % | 40 | 20 | 41 |
| C.E.C.meq/100g | 58.9 | 34.0 | 56,9 |
Table 3: Correlation between mineralogy and CEC.
Scanning electron microscope
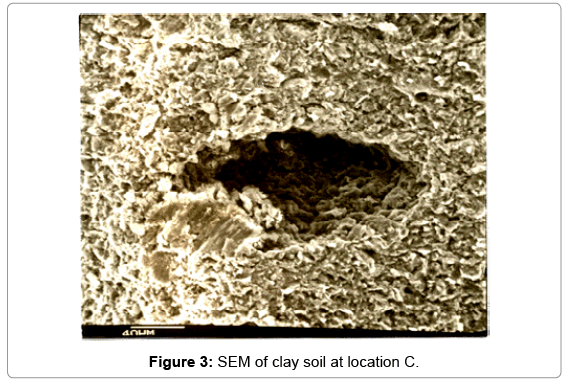
An attempt was made to identify the texture of soil (clay fraction), by using a PHILIPS SEM 505. Small pieces of soil were affixed to alluminium stubs with epoxy cement. The mounted samples were coated with a gold layer in order to reflect the light. Photograph 1 (location C) is revealing all particles have a strong orientation of the crystals, and look like have suffered a shear stress.
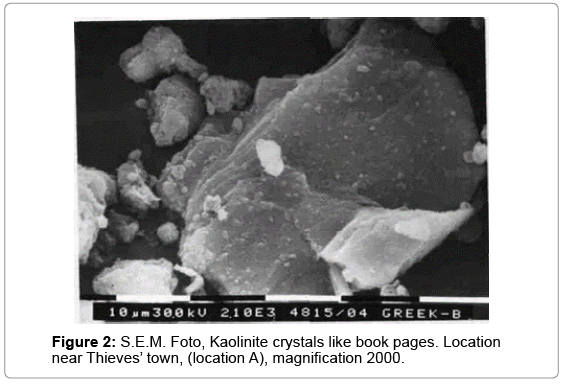
Additionally we can see a microstructure well graded, quartz base and on top flakes of clay minerals mixed with sand particles. Also we can see one empty vane included among the crystals, (SEM photo 1, 400X). Photograph 2 (location A) reveals the crystal of kaolin having book page shape, (SEM photo 2, 2000X) (Figure 3).
Determination of Bar Linear Shrinkage
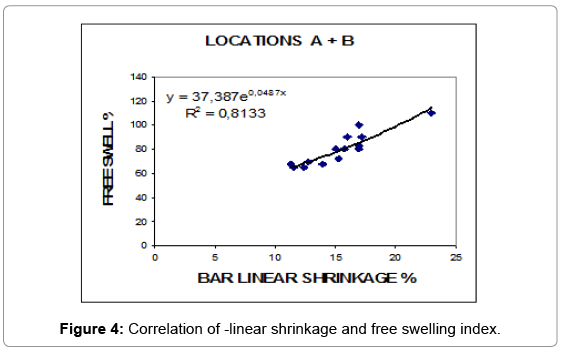
The determination of bar-linear shrinkage was made according to BS1377, Part 2:1990 [8] remoulded clay soil samples from liquid limit test. As it was determined, the samples revealed linear shrinkage larger than 8. The statistics elaboration revealed minimum value 9.6, maximum 23% and the average value was 15.2%. Several soil samples gave values higher than 20. According to Altmeyer's list, were classified as having critical swelling potential. Also from the correlation graph between bar-linear shrinkage and free swelling index it was concluded that there is one good relation having the type of exponential curve of type Y=axβ and coefficient R2=0.813.
Determination of free swell
Free swell tests in suspension were performed according to the Holtz and Gibbs [3] test method. For this, disturbed soil samples were tested and it was found that free swell values vary between minimum 50% and maximum 110%, with average value 74.7%.
Determination of the shrinkage limit
The shrinkage limit is used in soil classification as considered in relation to the natural moisture content of soil in the field, indicates the moisture content at which no further shrinkage of the specimen occurs. The methods used for finding the shrinkage limit of the Greek soil samples, were those suggested by TRRL mercury device test method [8], and involved the measurement of the total volume of each specimen as it was dried out. A total number of disturbed soil samples were tested and the Shrinkage limits results were between 6.0 and 20%.
Van der Merve chart
The heave to be expected under any light structure may be estimated using the expansive clay classification chart, based on the results of Atterberg limits and particle size determination [4]. In order to report the activity of the swelling soil, soil samples were placed in the chart (Figure 2) and the plot shows that the majority of the samples revealed activity between 0.75 and 2, which is high and very high.
Consistency index (Ic)
Since the consistency index depends on the moisture content of the soil and the swelling pressure increases proportional to the reduction of the initial moisture content, became apparent to examine if there is any relation between swelling pressure and consistency index.
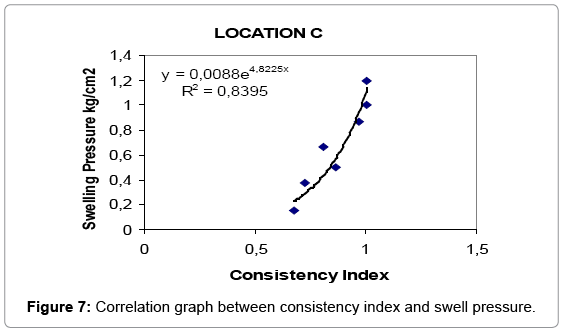
The consistency index value was calculated according the soil mechanics textbooks, taking in account from the same soil sample, liquid limit, plasticity index, natural moisture content and swelling pressure of each undisturbed soil sample. The graph was plotted having the swelling pressure and the equivalent Consistency Index (Ic) for each specific pressure. From Figures 4 and 5, it is apparent that there is a strong relation having the type Y=axβ of exponential curve and correlation factor R2 equal to 0.839 for Location C, correlation factor R2 equal to 0.718 for Location A, and R2 equal to 0.650 for Location B. From this graph we can conclude that the drier the soil sample, which means high consistency index, it is able to absorb more water so, if the mineralogy permits it, will give higher swelling pressure. This property depends on the chemical composition, the physicochemical characteristics and the individual moisture conditions of each area.
Swelling characteristics: The swelling characteristics of clays were studied by carrying out swell consolidation tests of ASTM type (D-4546- 1993) and all soil samples were undisturbed collected from borehole inside Shelby. Starting with a surcharge of 7 kPa, the successive loads were added and maintained for 48 hours to each increment in order to reach constant values of height. More specific:
Location A was found to have to a swell pressure of 3.35 kg/cm2 (max) and 0.38 kg/cm2 (min), with a standard deviation of σ=1.031. Location B yielded values of swelling pressure varying between 0.30 kg/cm2 (min) and 1.58 kg/cm2 (max), with a standard deviation of σ=0.469. Location C reached pressure values of 1.20 kg/cm2 (max) and 0.20 kg/cm2 (min), with a standard deviation of σ=0.367.
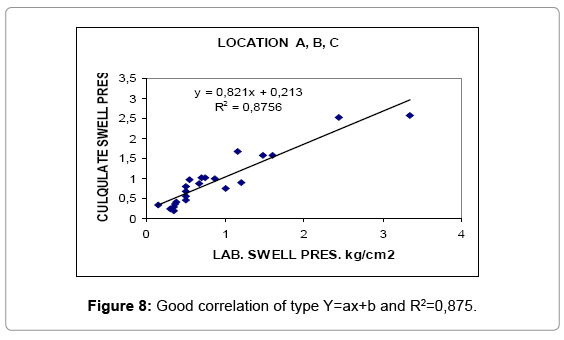
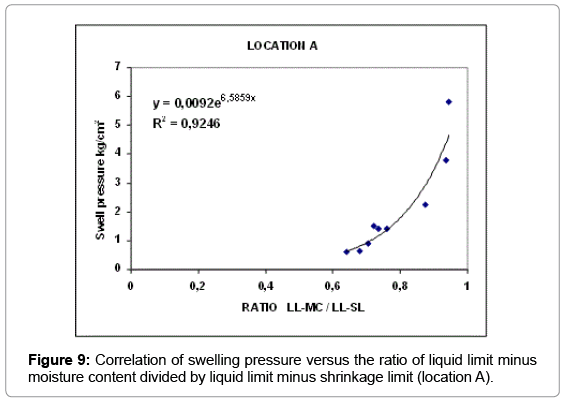
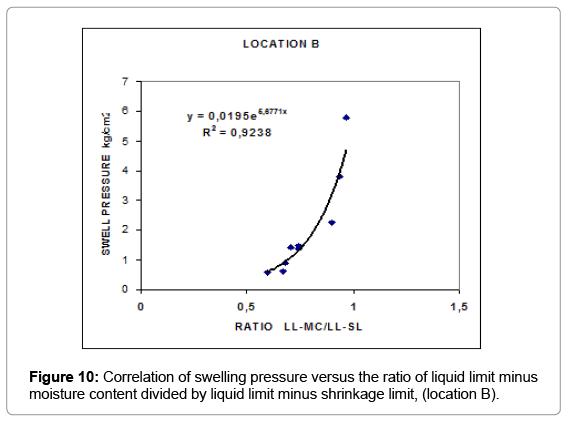
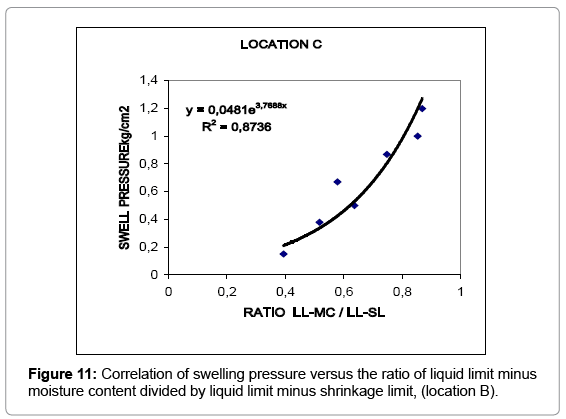
Swelling pressure and shrinkage limit: Chen [11] observed that there was no conclusive evidence of correlation between swelling potential and shrinkage limit and Sridharan [6] also said that shrinkage limit is not satisfactory used to predict swell potential. Since there is no empirical expression utilizing shrinkage limit and swelling pressure to predict swelling potential, an effort was made to correlate swelling pressure (SP) and shrinkage limit results from the three tested locations, but the coefficient of correlation was not acceptable. After a second attempt, the correlation between swelling pressure, liquid limit (LL), moisture content, shrinkage limit, indicated that if we compare the quotient of liquid limit minus moisture content divided by liquid limit minus shrinkage limit with the swelling pressure, we have one very good coefficient of correlation R2=0.92 for location A, R2=0.9238 for location B, R2=0.8736 for location C. We have named this fraction, shrinkage limit ratio and as we can see from the two following graphs between swelling pressure and shrinkage limit ratio there is a good relation (Figures 6-8).
Multiple regression analyses
From the literature [3,4,11], it is well known that some physical properties of the soil such as liquid limit, plasticity index, clay content, free swell index, linear shrinkage, can predict the swell potential of a clay soil.
Since there is no empirical expression from Greek swelling clay soils to predict swelling potential or swelling pressure, an effort was made via regression analyses to correlate swelling pressure (SP), liquid limit (LL), clay content (2 μm), free swell index (FS), bar linear shrinkage (LS), water content (w). N=number of equation and R²=coefficient of correlation. Table 4 shows some values measured in this study, from undisturbed soil samples, which were collected from three locations A, B, C, for the statistical analysis.
| Location A | Location B | Location C | |||||||||||||
|---|---|---|---|---|---|---|---|---|---|---|---|---|---|---|---|
| LL | PI | 0.002 | LS | SWEL | LL | PI | 0,002 | LS | SWEL | LL | PI | 0.002 | LS | SWEL | |
| % | % | % | % | PRES | % | % | % | % | PRES | % | % | % | % | PRES | |
| Kg/cm2 | Kg/cm2 | Kg/cm2 | |||||||||||||
| Minimum | 45 | 26 | 18 | 9.6 | 0,38 | 46 | 24 | 20 | 11 | 0,30 | 51 | 29 | 28 | 12 | 0,20 |
| Maximum | 64 | 51 | 58 | 23 | 3,35 | 57 | 35 | 48 | 17 | 1,58 | 65 | 46 | 50 | 17 | 1,20 |
| Average | 53 | 41 | 50,2 | 13,7 | ----- | 51,6 | 29 | 35,5 | 13,7 | ------ | 58 | 34 | 37 | 14 | ------ |
| Std.dev | 23,2 | 16,5 | 9,75 | 1,97 | 1,031 | 4,32 | 4,6 | 13,4 | 2,4 | 0,471 | 8,1 | 5,1 | 8,6 | 2,5 | 0,372 |
Table 4: Some descriptive statistics of the soil used.
Multiple linear regression analyses were carried out to relate the measured natural and engineering properties, using the statistical computer package. For this purpose, an investigation was made into the possible relationship between swelling pressure and the various swell governing factors.
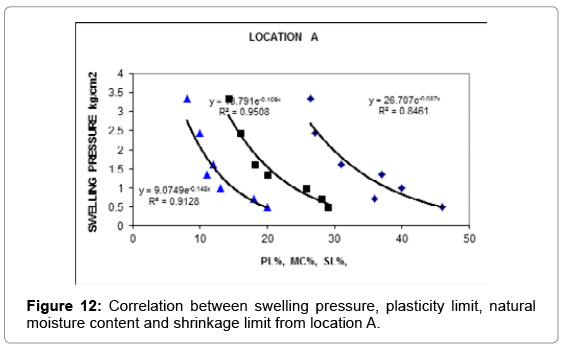
The value of correlation coefficient relating with the investigated properties was used to assess the quality of the particular correlation model, higher values being an indicator of a more appropriate model. For each individually investigated area the multiple regression analysis showed good correlations in all the combinations studied. Table 5 shows the resulting equations, where the correlation coefficient varies from R2=0.86 up to R2=0.99. Also it was observed that correlation of dry density (γd), compressibility index (Cc), consistency index (Ic) and consolidation index with the rest of the reported parameters gave not acceptable correlation coefficient, probably because the swelling properties depends on many other parameters, such as mineralogy, moisture content, cation exchange capacity etc, which differs from area to area. Finally these correlations should be considered as tentative and used as guide for more research (Figures 9-12).
| Location | Equasions | Parameters | Ν | Coeficient R² |
|---|---|---|---|---|
| Area A | FS=37.93+1.80 LL-2.86 LS-0.27 2μm SP=10.48+0.27 LL-0.17 MC-0.13 FS-0.48LS- |
FS,LL, LS,2μm SP,LL,MC,FS,LS, , |
7 7 |
0,98 0,93 |
| AreaB | 0.044 2μm FS=23.84+0.87 LL+0.07 LS-0.08 2μm SP=16.08+0.03LL-0.26MC-0.11FS-0.15LS+0.01 2μm FS=-19.69+1.05 LL+1.89 LS+0.004 2mm |
2μm FS,LL, LS,2μm SP,LL,MC,FS,LS |
8 8 |
0.98 0,99 |
| AreaC | SP=-2.355+0.01 LL-0.04 MC+0.08 FS-0.08 LS-0.04 2mm | 2μm FS,LL, LS,2μm SP,LL,MC,FS,LS, 2μm |
8 8 |
0.88 0.99 |
Table 5: Multiple regression analyses for SP and FS.
Results
From the above mentioned laboratory investigation the following results are reported for the investigation of swelling soils in Greece. :
The clay material can exhibit a large-scale plasticity index, starting from low (24%) to high values (51%), with colloid content from 23-52% and SD=9.3. Liquid limit values from 45-65% and mean value 54.6. Plasticity index between 24% -51%, and average 30.1 (Table 1). According to the Van der Merwe graph (1964), the clay material shows high and very high swell potential.
The bar linear shrinkage values varied between min. 9.6.% and max. 23%, and the average value was 15.2%. which indicates very high swell potential [11].
The free swell determination revealed values varying from 50% up to 110%, indicating clay soils with very high swelling potential [3,12].
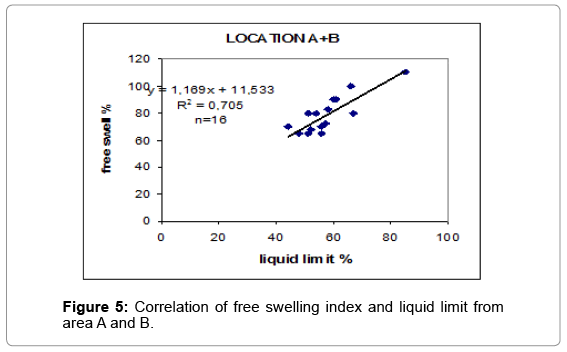
The correlation graph between free swell and liquid limit, gave a linear regression of the type Y= ax+b, with coefficient of correlation R2=0.705. Also the correlation graph between free swell and bar linear shrinkage gave a regression line of the type Y=axβ with coefficient of correlation R2=0.8133 (Figures 4 and 5).
The cation exchange capacity was tested on soil samples collected from 3 locations. As measured the CEC, varies between 34 meq 100 gr to 58.9 meq/100 gr. The soil pH determination revealed values ranging between pH=7.5 and pH=9.46. Sridharan [6] have reported similar values. Also Kumar et al. [13] reports that pH for sub surface soils ranges from 7.89 up to 10.15 .
The Van der Merwe [4] expansive clay classification chart plotting PI against clay fraction, indicates that swell potential matches perfect for the Greek of tested clay material and the soil samples are classified as high (50% of samples) and very high the rest 50% of the tested soil samples (Figure 6).
From the correlation graph between consistency index and swelling pressure (Figure 7), it was concluded that in the three areas, there is one relation having the type of exponential curve Y=axβ and good coefficient of correlation R2. More specific for location A coefficient of correlation is R2=0.726, for location B coefficient of correlation R2=0.833 and for location C coefficient of correlation is R2=0.839.
The swelling characteristics of clays were studied by carrying out swell consolidation tests and all soil samples were undisturbed collected from borehole inside Shelby. More specific: Location A was found to have to a swell pressure of 3.35 kg/cm2 (max) and 0.38 kg/cm2 (min), with a standard deviation of σ=1,031. Location B yielded values of swelling pressure varying between 0.30 kg/cm2 (min) and 1.58 kg/ cm2 (max), with a standard deviation of σ=0.469. Location C reached pressure values of 1.20 kg/cm2 (max) and 0.20 kg/cm2 (min), with a standard deviation of σ=0.367.
The correlation between swelling pressure and the quotient (ratio) of liquid limit minus moisture content divided by liquid limit minus shrinkage limit, (Figures 8-10) revealed one relation having the type of exponential curve
Y=axβ and one acceptable coefficient of correlation R2 for the three areas. Location A has a high coefficient of correlation R2=0.919, location B has a moderate coefficient of correlation R2=0.754, and location C gave also a high coefficient of correlation R2=0.869.
The Multiple regression analyses between swelling pressure and free swell with the rest five water depended variableς, liquid limit (LL), clay content (2 μm), free swell index (FS), bar linear shrinkage (LS), water content (WC) (Table 5), have showed very good correlations in all the combinations studied with the correlation coefficient to range for location A, from R2=0.98 up to R2=0.93. For location B from R2=0.98 up to R2=0.99, and for location C, from R2=0.88 up to R2=0.99. On Table 5 it is observed that swell pressure and free swell index are equally predicted using the considered factors [14-27].
Conclusion
Although Chen [11] observed that there was no conclusive evidence of correlation between swelling potential and shrinkage limit, and Srindharan and Prakash [6] have also shown that the shrinkage limit cannot be satisfactory used to predict the swell potential of a soil, the Author believes that the above correlation is good enough to predict swelling soil. Of course these correlations may be considered tentative at the moment, but indicate strongly one relation between shrinkage limit and the prediction of swelling pressure.
The Author feels that the above described research has clearly indicated that index properties of a clay soil, such as liquid limit, plasticity index, natural moisture content, free swell index, shrinkage limit, related with swell pressure, can satisfactory predict that a soil contains expansive clay, even if we don’t know the mineralogy of soil.
Expansive soils cause billions of dollars of damage to homes and property each year. If the propensity of a soil to shrink and swell is known before construction, shrinkage limit results can give information to design engineers, because if it is known the ability of soil to shrink or swell before construction, damage can be avoided.
Implications
The Author feels that the above described research has clearly indicated that index properties of a clay soil, such as liquid limit, plasticity index, natural moisture content, free swell index, shrinkage limit, related with swell pressure, can satisfactory predict that a soil contains expansive clay, even if we don’t know the mineralogy of soil, and we highly recommend multi regression analyses for prediction purposes. Also more studies similar to the one presented in this paper will be necessary to strengthen this assessment.
Acknowledgements
The Author wishes to thank all the staff from the soil mechanics laboratory (Ministry of Public Works) in Athens, for their assistance to fulfill this paper.
References
- Christodoulias J, Gassios E (1987) Investigation on Motorway damage due to expansive soils in Greece. 6thInt Conference on expansive soils, New Delhi, India.
- Stamatopoulos A, Christodoulias J, Giannaros H (1992) Treatment of expansive soils for reducing swell potential and increasing strength. Quar J EngGeol 25: 301-312.
- Holtz WG, Gibbs HJ (1956) Engineering properties of expansiveclays. Trans ASCE 121: 641-663.
- Van der Merwe (1984) The prediction of heave from plasticity index andthe percentage clay fraction of soils. The Civil Engineering, South African Institution of Civil Engineers 6: 103-107.
- Seed HB, Woodward RJ Jr., Lundgren R (1962) Predictions of swelling potential for compacted clays.J ASCE SMFD 88: 53-87.
- Sridharan A, Prakash K (2000) Classification procedures for expansive soils. ProcInstnCivEngrsGeotechEng 143: 235-240.
- Transport and Road Research Laboratory (TRRL)(1952). Soil Mechanics for Road Engineers. Determination of the Shrinkage limit of soil, UK.
- BS (1990) BS 1377:1990, Methods of testing Soils for civil engineering purposes, London, UK.
- Bayliss P (1986) Quantitative analysis of sedimentary minerals by power diffraction.Powder Diffraction 1: 37-39, USA.
- Zangalis K (1998)Â Standarless quantitative mineralogical analysis of rocks. Powder Diffraction 13Â : 74-84.
- Chen FH (1976) Foundations on Expansive Soils. Elsevier, New York, USA.
- Rao R, Rao K (1998) A case study of cracked building with designguidelines on Expansive soils, Problematic Soils. Editors,Yanagisawa, Moroto, Mitachi, Balkema, Rotterdam.
- Kumar S, Krishnan G, Saha SK (2008) Measuring salinity with WET sensor and characterization of salt affected soil. Indian Institude of Remote Sensing, Agropedol 18: 124-128.
- ASTMÂ (1993)Â Method D4546-90, Standard Test method for one dimensional swell or settlement potential of cohesive soils. Annual book of ASTM Standards.
- ASTM (2000) D4829-08. Standard Test Method for Expansion Index of soils. Geotechnical Engineering Standards, USA.
- Bell FC (1993) Engineering treatment of soils. Chapman and Hall,London, UK.
- Shi B, Jiang H, Liu Z, Fang HY (2002) Engineering geological characteristics of expansive soils in China. EngGeol 67: 63-71.
- Christodoulias J, Giannaros H (1988) Failure of a Railway Embankment. 2ndIntConf on Case histories in Geotechnical Engineering, June 1-5, 1988, Univ. Missouri-Rolla, USA.
- Christodoulias J, Giannaros H (1989) Methods of design earthworks on Expansive soils in Greece. IntConf on Foundations and Tunnels, pp 19-21, Sept. 1989, London University, UK.
- Delwar H, Imbrahim MM, Sadaqah B (1997) Swellingcharacteristics of Madinah clays. QJEG GeolSoc30:205-220.
- Gomez C, Oltra-Carrió R, Bacha S, Lagacherie P, Briottet X (2015)Evaluating the sensitivity of clay content prediction to atmosphericeffects and degradation of image spatial resolution using HyperspectralVNIR/SWIR imagery. Remote Sensing Environ 164: 1-15.
- Komornick A, David D (1969)Â Prediction of swelling pressure of clays.Proc ASCE J SMFD 1: 209-224.
- Mitchell JK (1993) Fundamentals of Soil Behavior(2ndedn.) Wiley, New York.
- QJEG (1990) Testing and sampling of tropical residual soils. Engineering Working Party Report 23: 52-65.
- Sridharan A (1999) Problematic Soils. Volume change behaviourof expansive soils, Editors, Yanagisawa, Moroto, Mitachi, Balkema, Rotterdam, pp. 833-840.
- Stamatopoulos A, Christodoulias J, Gassios E, Giannaros H (1989) Recent experiences with swelling soils. 12thIntConf on SMFE, Rio de Janeiro, August 2: 655.
- Velmurugan A, KrishanG,Dadhwal VK, Kumar S, Swarnam TP, et al. (2009) Harmonizing soil organic carbon estimates in historical and current data. Indian Institute of Remote Sensing, ISRO, Dehradun, India. Curr Sci 97: 25.
Citation: Christodoulias J (2015) Engineering Properties and Shrinkage Limit of Swelling Soils in Greece. J Earth Sci Clim Change 6: 279. DOI: 10.4172/2157-7617.1000279
Copyright: ©2015 Christodoulias J. This is an open-access article distributed under the terms of the Creative Commons Attribution License, which permits unrestricted use, distribution, and reproduction in any medium, provided the original author and source are credited.
Select your language of interest to view the total content in your interested language
Share This Article
Recommended Journals
Open Access Journals
Article Tools
Article Usage
- Total views: 29060
- [From(publication date): 6-2015 - Aug 17, 2025]
- Breakdown by view type
- HTML page views: 23992
- PDF downloads: 5068

