Enhanced Degradation of Benzo[α]Pyrene in Coal Tar Contaminated Soils Using Biodiesel
Received: 14-Nov-2017 / Accepted Date: 12-Jan-2018 / Published Date: 16-Jan-2018 DOI: 10.4172/2155-6199.1000426
Abstract
The biodegradation of the potent carcinogen, benzo[a]pyrene (BaP), and other priority pollutants was investigated in un-weathered coal tar contaminated soil over a period of 150 days. Results from the laboratory microcosm experiments showed that after 60 days, the concentrations of BaP were significantly reduced by 81%, in the biodiesel amended samples compared to the 26% and 34% depletion in the control and nutrient-only amended microcosms, respectively. The 3-ring PAH anthracene was also almost completely biodegraded in the presence of biodiesel. However, phenanthrene degradation was significantly inhibited in these samples as only 3% reduction occurred as opposed to the 80% depletion observed in the control. A stepwise treatment approach conducted on the coal tar spiked soil also revealed a higher reduction in BaP (98%) in the biodiesel amended microcosms compared to the control (29%) and further enhanced the depletion of phenanthrene by 51% after 60 days of adding biodiesel to soil initially treated with nutrients. Toxicity assays showed that biodiesel amended microcosms stimulated phosphatase enzyme activity and exhibited a lower toxic response to Microtox Vibrio fischeri. Overall, the pattern observed in the removal of the PAHs using biodiesel, suggests the co-metabolic action of ligninolytic fungi, probably via lignin peroxidases, as also evidenced from the visible growth of moulds after 14 days of amendment. The enhanced removal of carcinogenic PAH and the reduced toxicity observed in soil after biodiesel amendment, indicates that this bioremediation technique has potential for full scale field trials.
Keywords: Biodiesel; Biodegradation; Coal tar; Toxicity; Soil; Nutrient; Benzo(a)pyrene
Introduction
Coal tar remains a notable feedstock for the production of many important aromatic chemicals, accounting for 10-15% of benzene, toluene, ethylbenzene and xylene (BTEX) production and more than 90% of other heavy chemicals [1]. It is formed by the pyrolysis of coal, a process which consists of two distinct phases: the splitting of the weaker C-C bonds between the aromatic units and further reactions of cracking, hydrogenation and assemblage of the primary aromatic units to form the resultant products [2]. However, one major concern of coal utilization is the PAH content. PAHs occur naturally in coals and are most significantly present in coal tar and creosote as compared to other known sources [3].
Among the over 100 known PAHs, a list of 16 priority pollutants have been identified by the United States Environmental Protection Agency (USEPA) as sources of environmental concern due to their persistent nature and carcinogenic potential hence, most cleanup efforts are geared towards reducing these pollutants to safe environmental limits [4]. The persistence of PAHs is dependent on environmental factors as well as the chemical structure, concentration and level of their bioavailability; these factors also contribute to the level of their toxicity [5]. PAHs are naturally removed from the environment by microbial degradation, a biological process which is being extensively employed in the bioremediation treatments of PAH contaminated sites [6].
Benzo[a]pyrene (BaP) is the most studied of the PAHs and is considered a target analyte in environmental studies [7] thus, its levels in the environment are employed as the basis for the formulation of regulations and clean up endpoints [8]. During degradation, BaP cannot serve solely as a growth substrate for bacteria therefore, significant mineralisation of this pollutant requires the presence of cosubstrates as alternate carbon sources [8]. These co-substrates which include low molecular weight PAHs induce competitive and synergistic (cometabolic) effects that are capable of enhancing the degradation of a wide range of PAHs by defined strains [6,9].
Studies have shown that biodiesel can facilitate the degradation of PAHs by cometabolic transformation, and this has been attributed to its high degradability and ability to increase pollutant solubilization [10-12]. However, the possibility of induced toxicity may result after treatment, as hinted by Taylor and Jones [12], thereby necessitating the inclusion of ecotoxicological analyses in assessing hydrocarbon endpoints during remediation treatments [13-15]. In this study, a soil enzyme activity test (phosphatase assay) and the Microtox® bioassay were used to ascertain the level of toxicity after soil treatment.
Phosphatases are enzymes that mobilise organic phosphorus by hydrolysing esters and anhydrides of phosphoric acids into soluble inorganic forms needed for bacteria metabolism [16]. The presence of hydrocarbon pollutants in soil can affect the hydrolytic function of phosphatases and other enzymes involved in the nutrient (N, P, C) cycles [17] thus, their activity can function as a biological indicator to determine ecological stress in polluted soils. The Microtox® bioassay has been identified as one of the most sensitive among other bacterial assays in detecting toxicity for a wide range of organic and inorganic substances [18]. It is a bioluminescence-based assay which measures the reduction in the light output of the Vibrio fischeri bacteria in proportion to the concentration of the toxicant on exposure [19].
The purpose of this study was to further investigate the ability of biodiesel in enhancing the degradation of BaP in un-weathered coal tar as was revealed in previous work with weathered tar. In addition, a stepwise biodiesel amendment technique was explored and comparatively evaluated.
Experimental
The viscous un-weathered coal tar was obtained from Monckton Coke and Chemical Co. Ltd. The soil was taken from an organic crop field in agricultural land (Nafferton Farm) in Stocksfield, Northumberland. The location, supported by chemical analysis conducted on a sample of it, indicated that there was no previous history of major organic chemical contamination. Prior to use, the soil was passed through a 2 mm sieve to remove materials such as leaves, roots and stones. Biodiesel (rape seed methyl ester, RME- B100) was provided by Dl Oil Plc and the slow release fertiliser (Westland Feed- All slow release plant food, NPK 14-5-28) was obtained from Homebase Ltd, Newcastle upon Tyne.
Laboratory degradation experiments
Three sets of treatments; TC (un-amended control), TNT (nutrient amended) and TBN (biodiesel amended) were prepared in triplicates as follows: Aliquots of tar (250 mg) dissolved in dichloromethane (1 mL) were spiked on 20 g of air-dried soil samples and left in the fume cupboard overnight to allow for solvent evaporation. The spiked soil samples were transferred to 250 mL brown glass jars containing 30 g of wet soil. 10 g of biodiesel was added to one set of glass jars. 3 g of slow release fertiliser was weighed into each jar except the set of control. The water content was finally adjusted to 50% of the soil’s water holding capacity and each treatment was mixed thoroughly. All brown jars were covered with aluminium foil perforated with holes to allow for aeration and stored in cupboards at room temperature. De-ionised water was added weekly to compensate for water loss and samples were stirred every 2 weeks. Treatments were freeze-dried, extracted and analysed after incubation periods of 0 and 60 and 90 days.
Stepwise amendment technique
This approach involved the addition of biodiesel to the unweathered coal tar experiments after 60 days of nutrient supplementation. In other words, the soil micro-organisms were first allowed to utilise the slow release fertiliser to degrade PAHs for duration of 60 days before 10 g of biodiesel was added to the treatments. The biodiesel amended samples were then incubated for additional 60 and 90 days, i.e., sampling was done after a total of 120 and 150 days of incubation, respectively. Also allowed to run simultaneously, were the control and nutrient amended sets prepared as earlier described. These were also analysed after 120-day and 150- day incubation periods.
Biodiesel composition analysis
The composition of the rapeseed biodiesel was determined to identify and quantify the individual fatty acid methyl esters (FAME) present in the sample as follows: An aliquot (50 mg) of biodiesel was weighed into a clean glass vial and 500 μg of squalane was added. A spatula full of alumina was added to the sample and mixed. The sample then passed through a silica gel/alumina column by eluting with 70 mL petroleum ether and 70 mL dichloromethane: petroleum ether solvent mixture (50:50, v/v) into a 250 mL round bottom flask. The eluted fraction was concentrated to 10 mL by rotary evaporation. An aliquot (1 mL) was transferred to a glass GC vial and 50 μg of internal standard (n-heptadecylcyclohexane) was added for quantitative analysis by GC and GC-MS. A procedural blank was also run. Triplicate measurements were conducted for this analysis.
Extraction method
The contents of each brown jar was transferred to pre-extracted thimbles with solvent washings (dichloromethane) and spiked with surrogate standard (squalane, Fluka Chemika; 1,1'-1,1’-Binaphthyl, Kodak, UK). Extraction was performed using Soxhlet method with dichloromethane and methanol (93:7) as the solvent mixture for a minimum of 16 h. Extracts were concentrated to 30 mL by rotary evaporation and an aliquot (1 mL) was transferred to pre-weighed glass vial and evaporated to dryness under stream of nitrogen to constant weight to quantify the extractable organic matter (EOM). After further concentration, extracts were made up to 20 mL in dichloromethane (DCM) and an aliquot (2 mL) was transferred to a glass vial for separation by column chromatography.
Soxhlet extracts of the biodiesel amended soil samples were saponified before column separation in order to reduce the possible interferences of fatty acid methyl esters in the identification and quantification of the hydrocarbons fractions. An aliquot (1 mL) was transferred to 100 mL round bottomed flask containing toluene (6 mL), methanol (6 mL) and refluxed for 1 h in 3 M KOH solution. After cooling, the content was decanted into a separating funnel with solvent washings (5 mL of methanol, 5 mL mixture of methanol: toluene - 50:50 v/v, and 10 mL of toluene). Hexane (15 mL) was added and the separating funnel was shaken and left to stand to allow the separation of the upper organic layer from the lower aqueous layer. The organic layer was then transferred using a pipette to a 100 mL round bottom flask. The process was repeated after two further washings with hexane to complete removal of the organic layer and the content of the flask was dried over granular anhydrous Na2SO4. The content was concentrated to ~2 mL and transferred to a 10 mL glass vial prior to separation on a chromatographic column.
Sample fractionation
Total petroleum hydrocarbons were separated from the EOM aliquots by column chromatography using activated (120°C, 2-3 h) alumina (Merck, UK; 2 g) and silica gel (chromatography grade, Merck, UK; 7 g) as adsorbents and elution with 70 mL petroleum ether (BP 40-60°C) and 70 mL dichloromethane: petroleum ether solvent mixture (50:50, v/v). A procedural blank column was also run. Prior to analysis of the fractions by gas chromatography-mass spectrometry (GC-MS), internal standards (p-terphenyl, Fisher Scientific, UK, and the Supelco, deuterated internal standard mix, comprising acenaphthene-d10, chrysene-d12, 1,4 dichlorobenzene-d4, naphthalene-d8, perylene-d12, and phenanthrene-d10) was added to an aliquot for quantification.
Toxicity assessment of un-weathered coal tar treatments: Soil phosphatase activity
Soil phosphatase activity was measured by the method developed by Tabatabai and Bremner [20] using p-nitrophenyl phosphate as substrate. This colorimetric method is based on the yellow colour formation of alkaline solutions of p-nitrophenol formed as a product of phosphatase activity which is then measured at 400 nm.
Microtox acute toxicity assay
The Microtox toxicity test was carried out using the SDI Model 500 Analyser as specified in the Microtox basic test protocol [21,22]. Prior to analysis, the tar sample extracts (EOM) were solvent- exchanged into 1 mL of DMSO which is less toxic than the dichloromethane: methanol extractant. Aliquots of 1 μL were then diluted with 10 mL of Microtox diluent before analysis. The concentrations of the solutions ranged between 2 mg/L to 35 mg/L.
Analytical equipment
The GC-MS analysis was performed on a Hewlett-Packard 6890 instrument fitted with a split/splitless injector (280°C) and linked to a Hewlett-Packard 5973 MSD which was set with an electron voltage of 70 ev, source temperature 230°C, quadrupole temperature 150°C, multiplier voltage 1800 V and interface temperature 310°C. An aliquot (1 μL) of sample dissolved in DCM was injected by an HP7683 autosampler and separation was performed on a fused silica capillary column (30 m × 0.25 mm i.d) coated with 0.25 μm thick 5% phenylmethyl polysiloxane stationary phase, using helium as the carrier gas (flow 1 mL/min, pressure of 50 kPa, split at 30 mls/min). The GC oven temperature was programmed at 50°C for 2 min and ramped at 4°C/min to a final temperature of 300°C held for 20 min. Data acquisition was controlled by a HP PC using Chemstation software and TPH fraction analyses were made in selected ion mode (SIM) for greater sensitivity.
Statistical analysis
Data were tested statistically using MINITAB 16.0 software. Comparison of means was conducted using the One-Way Analysis of Variance (ANOVA) test at 95% confidence level followed by the Dunnet’s multiple comparison test set at 5% family error rate. The student t-test was also used to compare different means at 5% level of significance.
Results And Discussion
Microbial growth in biodiesel amended laboratory microcosms
Figure 1 presents different durations from 1 week (7 days) to 90 days of the growth pattern of microorganisms (white moulds) observed in the biodiesel amended samples in the un-weathered coal tar (TBN) experiments. It was also evident that when soil was turned after 2 weeks in order to allow for adequate aeration, growth was enhanced with the appearance of dense white-green coloured microbes at the entire surface of the aerated soil after just a week’s interval, as shown in images of the biodiesel amended samples taken after 2 weeks, i.e., from week 3 to 90 days.
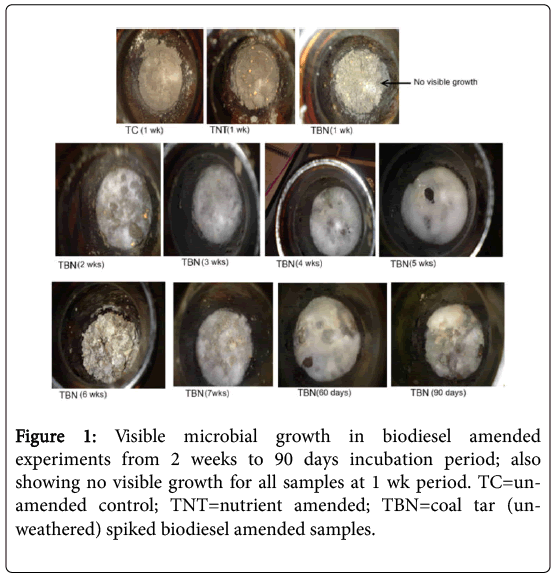
Figure 1: Visible microbial growth in biodiesel amended experiments from 2 weeks to 90 days incubation period; also showing no visible growth for all samples at 1 wk period. TC=unamended control; TNT=nutrient amended; TBN=coal tar (unweathered) spiked biodiesel amended samples.
Extractable Organic Matter (EOM) concentrations
After 60 days incubation, the EOM levels in the biodiesel amended (TBN) microcosms were reduced by 80% compared to 39 and 25% depletions seen in the un-amended control (TC) and nutrient amended (TNT) microcosms, respectively (Figure 2). This large percentage reduction is mainly attributed to the high degradability of the FAMEs of the biodiesel component, is very similar to the rate of degradation (81%) seen in previous work for weathered coal tar after 60 days of incubation with biodiesel. After 90 days, the EOM levels in the TBN microcosms were reduced by 84% (a further 4%). The TC samples did not show further reductions (-3%), while TNT treatments were decreased by 54% (a further 19%).
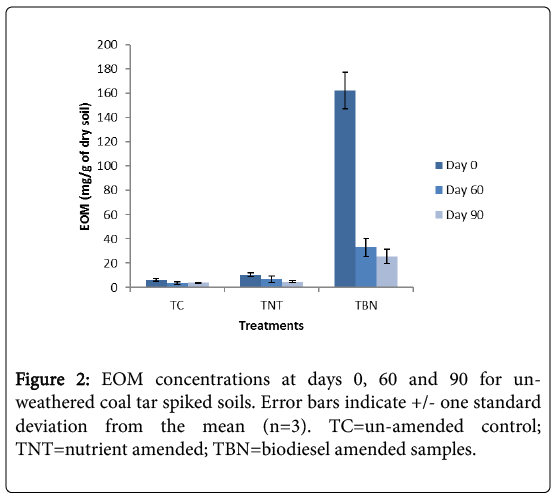
Figure 2: EOM concentrations at days 0, 60 and 90 for unweathered coal tar spiked soils. Error bars indicate +/- one standard deviation from the mean (n=3). TC=un-amended control; TNT=nutrient amended; TBN=biodiesel amended samples.
Biodiesel composition
Figure 3 shows the chromatogram of the rapeseed biodiesel used in this study, while Table 1 reports the percentage chemical composition of the fatty acid methyl esters which was compared with a typical rapeseed oil-based biodiesel reported by Stauffer and Byron [23].
| Fatty acid methyl esters of rapeseed biodiesel (RME) | Concentration (%) by mass | |
|---|---|---|
| RME analysed | RME (Stauffer & Byron, 2007) | |
| C14:0 | 0.1 | 0.1 |
| C16:0 | 5.7 | 4.8 |
| C16:1 | 0.2 | 0.2 |
| C18:0 | 2.3 | 0.4 |
| C18:1 | 84.3 | 61.6 |
| C18:2 | 4.1 | 20.6 |
| C18:3 | N/A | 9.2 |
| C20:0 | 0.8 | 0.6 |
| C20:1 | 1.4 | 1.4 |
| C22:0 | 0.4 | 0.4 |
| C22:1 | 0 | 0.3 |
| C24:0 | 0.1 | 0.1 |
| C24:1 | 0.1 | N/A |
Table 1: Chemical composition of the rapeseed biodiesel used for this study in comparison with typical oil-based rapeseed biodiesel reported by Stauffer & Byron [23]. Abbreviated names for the fatty acids are represented by ‘C’ followed by the total number of carbon atoms (including the carboxylic group) present in the chain, and a colon with the number of carbon to carbon double bonds present in the chain.
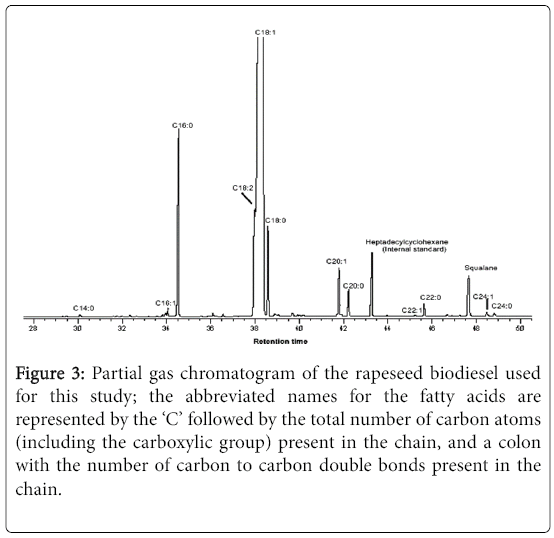
Figure 3: Partial gas chromatogram of the rapeseed biodiesel used for this study; the abbreviated names for the fatty acids are represented by the ‘C’ followed by the total number of carbon atoms (including the carboxylic group) present in the chain, and a colon with the number of carbon to carbon double bonds present in the chain.
In both cases, the totals do not add up to 100% due to the noninclusion of compounds of very small proportions. The most abundant compound of the rapeseed biodiesel analysed is shown to be methyl octadecenoate, i.e., the methyl ester of oleic acid (C18:1; 84.3%) followed by methyl esters of palmitic, linoleic, stearic and gadoleic acids (C16:0, C18:2, C18:0 and C20:1, respectively) in decreasing order of abundance (Table 1). Some other FAMEs of <1% composition are also shown in the chromatogram below. The saturated FAMEs constituted only 9.4% of the calculated total of 99.5% (Figure 4).
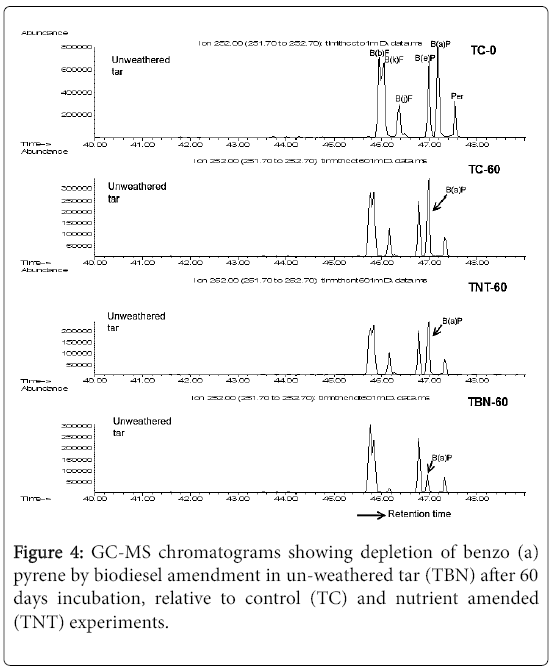
Figure 4: GC-MS chromatograms showing depletion of benzo (a) pyrene by biodiesel amendment in un-weathered tar (TBN) after 60 days incubation, relative to control (TC) and nutrient amended (TNT) experiments.
Anthracene (Anth) was also almost completely degraded in the presence of biodiesel by 97% relative to 44 and 31% decrease in the unamended and nutrient microcosms, respectively (p=0.025). Phenanthrene (Phe) was only reduced by 3% in the TBN microcosms, while 80% depletion was seen in the TC samples (p=0.001, Figure 5). No depletion of Phe was, however, observed in the TNT treatments. Since the removal of LMW PAHs was successfully achieved in the unamended soil samples, it shows that the depletion of Phe was not enhanced by the addition of nutrients.
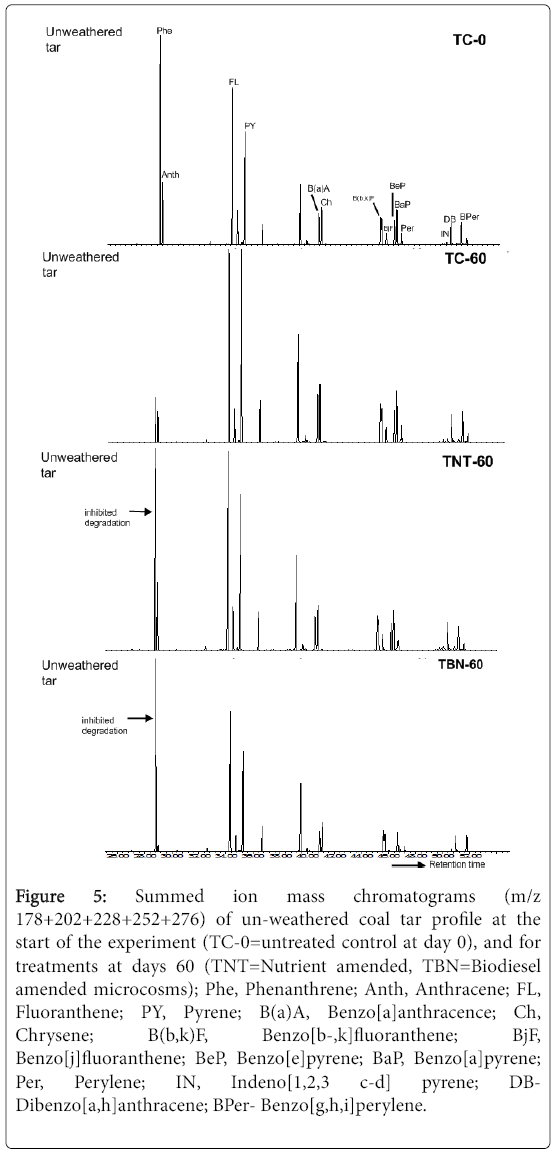
Figure 5: Summed ion mass chromatograms (m/z 178+202+228+252+276) of un-weathered coal tar profile at the start of the experiment (TC-0=untreated control at day 0), and for treatments at days 60 (TNT=Nutrient amended, TBN=Biodiesel amended microcosms); Phe, Phenanthrene; Anth, Anthracene; FL, Fluoranthene; PY, Pyrene; B(a)A, Benzo[a]anthracence; Ch, Chrysene; B(b,k)F, Benzo[b-,k]fluoranthene; BjF, Benzo[j]fluoranthene; BeP, Benzo[e]pyrene; BaP, Benzo[a]pyrene; Per, Perylene; IN, Indeno[1,2,3 c-d] pyrene; DBDibenzo[ a,h]anthracene; BPer- Benzo[g,h,i]perylene.
In this study, the inhibitory effect on Phe degradation observed in the nutrient amended microcosms (TNT) may have occurred due to a possible nutrient-induced microbial shift for the degradation of naphthalene which appeared to be the most dominant of the PAHs in the hydrocarbon pollutant. Occurrences of nutrient-induced changes to microbial populations in hydrocarbon polluted sites during bioremediation have been reported by other researchers [24-26]. The possibility of naphthalene toxicity could also have occurred in the nutrient amended treatments. A study carried out by Bouchez, Blanchet [27] reported the inhibitory effect of naphthalene (500 ppm) on the growth of the phenanthrene degrading Pseudomonas sp. strain, S Phe Na 1, an occurrence which was, however, relieved when naphthalene was consumed by the Pseudomonas stutzeri strain, S Nap Ka 1, that was later added to the medium. Stringfellow and Aitken [28] also corroborated these findings in their work when they showed that naphthalene and other 2-ring PAHs, 2-methylnaphthalene and 1- methylnaphthalene, strongly interfered with Phe degradation. The inhibition of Phe degradation by naphthalene, even at very low concentrations (5 ppm), has also been reported by Shuttleworth and Cerniglia [29].
In the TC samples, naphthalene was almost completely removed as the initial concentration was reduced by 99%. Since inhibition of Phe degradation was not observed in the TC samples, it could be inferred that the volatilisation and/or degradation of naphthalene may have occurred more rapidly compared to the nutrient amended microcosms, thereby preventing any form of inhibitory action on the degradation of other LMW PAHs. It is also possible that losses recorded for Phe in these un-amended samples may have also occurred by volatilization [30]. In the TBN treatments, the mean concentration of naphthalene after 60 days incubation was, however, significantly (p<0.01) higher than the control and Phe inhibition was also observed. It suggests that losses of naphthalene by volatilisation or degradation may have been reduced by the presence of biodiesel, which in turn, inhibited the degradation of other LMW PAHs especially Phe, during the 60 day incubation period.
The results (Table 2) also show that the amendment techniques did not positively affect the rate of degradation of other 3-ring PAHs. Acenaphthylene (Acy) and acenaphthene (Acn) showed significantly (p≤0.02) higher depletions in the TC samples (88 and 94%, respectively) compared to TNT (42 and 50%, respectively) and TBN microcosms (22 and 32%, respectively). Fluorene (Fl) was also significantly (p=0.001) reduced by 89% in the un-amended samples compared to 36 and 7% depletions observed in the nutrient and biodiesel amended microcosms, respectively. Although volatilisation is probably also contributory to the losses observed in the un-amended samples [31], the degrading activities of the indigenous microbes cannot be ruled out. It has been demonstrated previously that autochthonous microorganisms have high degradation potential for three ring PAHs (Fl and Phe) during natural attenuation, as reported for contaminated mangrove sediments [32]. Bacterial strains (Sphingomonas sp.) that are capable of growing solely on Ace and Acn as carbon sources, independent of fertiliser amendments, have also been isolated from former cokeworks sites [33].
| Concentrations of PAHs (µg/g) | ||||||||||||||||||||
|---|---|---|---|---|---|---|---|---|---|---|---|---|---|---|---|---|---|---|---|---|
| TC | TNT | TBN | ||||||||||||||||||
| Day 0 | Day 60 | Day 90 | Day 0 | Day 60 | Day 90 | Day 0 | Day 60 | Day 90 | ||||||||||||
| Mean | S.d | Mean | S.d | Mean | S.d | Mean | S.d | Mean | S.d | Mean | S.d | Mean | S.d | Mean | S.d | Mean | S.d | |||
| Naphthalene | 299.50 | 51.7 | 1.99 | 1.1 | 1.43 | 0.4 | 222.69 | 6.3 | 6.57 | 2.2 | 2.00 | 0.4 | 21.87 | 13.4 | 44.53 | 10.5 | 9.68 | 14.6 | ||
| Acenaphthylene | 191.47 | 41.8 | 22.05 | 31.4 | 4.61 | 2.4 | 124.36 | 7.1 | 72.28 | 17.5 | 64.63 | 10.5 | 97.83 | 23.8 | 76.26 | 2.2 | 32.19 | 19.8 | ||
| Acenaphthene | 14.06 | 14.1 | 0.85 | 1.4 | 0.14 | 0.1 | 5.22 | 1.0 | 2.59 | 0.4 | 2.10 | 0.2 | 4.78 | 1.1 | 3.24 | 0.1 | 1.63 | 0.9 | ||
| Fluorene | 88.00 | 14.3 | 9.81 | 13.1 | 2.97 | 1.9 | 71.46 | 5.1 | 45.33 | 7.0 | 39.83 | 10.6 | 62.08 | 26.4 | 57.72 | 0.8 | 36.00 | 21.8 | ||
| Phenanthrene | 220.63 | 45.8 | 43.51 | 42.2 | 27.79 | 17.1 | 170.02 | 14.2 | 193.94 | 17.5 | 141.99 | 108.0 | 190.72 | 8.4 | 184.47 | 13.1 | 160.64 | 95.7 | ||
| Anthracene | 54.01 | 7.7 | 30.26 | 24.3 | 3.93 | 2.4 | 45.53 | 5.5 | 31.19 | 11.8 | 7.86 | 2.9 | 41.76 | 7.1 | 1.17 | 0.3 | 1.46 | 1.6 | ||
| Fluoranthene | 162.40 | 28.2 | 131.61 | 71.4 | 87.78 | 44.7 | 129.36 | 12.3 | 173.05 | 8.7 | 184.81 | 19.2 | 140.00 | 3.6 | 149.67 | 4.9 | 117.58 | 55.9 | ||
| Pyrene | 122.31 | 25.3 | 124.20 | 30.0 | 103.31 | 44.7 | 99.80 | 0.4 | 125.77 | 2.5 | 129.20 | 10.5 | 101.15 | 3.1 | 100.68 | 2.3 | 78.19 | 44.1 | ||
| Benzo[a]anthracene | 74.16 | 12.6 | 54.80 | 18.4 | 39.74 | 11.9 | 62.47 | 7.1 | 41.93 | 9.0 | 48.17 | 5.3 | 59.66 | 8.6 | 34.19 | 1.9 | 21.45 | 11.9 | ||
| Chrysene | 59.53 | 8.8 | 46.71 | 12.9 | 40.25 | 9.4 | 49.23 | 3.9 | 35.04 | 9.8 | 45.00 | 3.1 | 52.62 | 6.8 | 42.76 | 1.1 | 25.36 | 14.2 | ||
| Benzo[b]fluoranthene | 60.78 | 9.2 | 53.17 | 10.6 | 53.00 | 9.5 | 52.92 | 12.5 | 37.08 | 16.9 | 37.49 | 3.4 | 54.66 | 15.0 | 49.68 | 6.0 | 24.04 | 13.7 | ||
| Benzo[k]fluoranthene | 60.18 | 11.5 | 30.40 | 11.5 | 28.25 | 5.5 | 51.33 | 3.5 | 30.18 | 1.3 | 40.84 | 2.8 | 48.55 | 5.1 | 20.18 | 1.8 | 18.18 | 9.8 | ||
| Benzo[a]pyrene | 63.60 | 8.4 | 46.77 | 12.6 | 35.00 | 8.7 | 54.75 | 6.5 | 36.04 | 11.2 | 34.68 | 2.7 | 42.89 | 7.9 | 8.06 | 2.2 | 4.96 | 2.5 | ||
| Indeno[1,2,3-cd]pyrene | 10.03 | 3.7 | 5.59 | 1.5 | 5.78 | 1.0 | 8.77 | 3.4 | 4.98 | 1.6 | 5.23 | 1.0 | 7.91 | 2.3 | 3.81 | 0.3 | 2.20 | 1.1 | ||
| Dibenzo[a,h]anthracene | 42.11 | 8.7 | 27.35 | 6.3 | 26.50 | 4.1 | 36.16 | 5.9 | 23.75 | 5.4 | 25.31 | 5.0 | 34.23 | 6.3 | 20.77 | 2.0 | 12.16 | 5.8 | ||
| Benzo[g,h,i]perylene | 46.72 | 8.4 | 28.27 | 8.4 | 27.34 | 4.5 | 40.15 | 7.1 | 24.69 | 5.6 | 26.36 | 5.0 | 38.41 | 7.0 | 21.02 | 2.1 | 13.09 | 6.5 | ||
Table 2: Concentrations and standard deviations of the 16 EPA priority PAHs in the un-weathered coal tar spiked soil at days 0, 60 and 90. TC=untreated control, TNT=nutrient-amended and TBN=biodiesel amended microcosm.
Also, no degradation was observed for the 4-ring PAHs, fluoranthene (FL) and pyrene (PY) in the TBN and TNT microcosms. The TC samples showed depletion for FL (19%), while PY was not degraded as well (Table 2). The decrease in benzo[a]anthracene – B[a]A and chrysene (Ch) in the treatments was also not significantly (p>0.05) different from the un-amended control although depletion of B(a)A was more in the TBN microcosms (43%) compared to TNT (32%) and TC (26%). Degradation of the other five ring PAHs, (benzofluoranthenes) was also not significant (p>0.05) in all the experiments, results showed an enhanced depletion of benzo[k]fluoranthene in the presence of biodiesel (58%) compared to the TNT (41%) and TC (49%) samples.
Biodiesel amendment also promoted the degradation of the other five and six-ring PAHs, indeno [1,2,3-cd] pyrene (IndPY; 52%), dibenzo [a,h] anthracene (DBAnth; 39%) and benzo [g,h,i] perylene (BPer; 45%) compared to TNT (43, 34 and 39%, respectively) and TC (44, 35 and 39%, respectively). According to these results, the rate of disappearance of these recalcitrant PAHs was unaffected by the addition of nutrients only. However, their bioavailability to degradation was increased by the addition of biodiesel.
After 90 days of incubation, the percentage reductions for the 2-3 ring PAHs were still low in the amended experiments (TBN and TNT) compared to the un-amended control, with exception of naphthalene which had been almost completely removed after 60 days of incubation in the nutrient amended and control samples (Table 2). Phe was reduced to 16% in the nutrient and biodiesel amended experiments, while 87% depletion occurred in the control. The 4-ring PAHs, FL and PY were still not degraded in the TNT samples. However, reductions occurred in the TBN samples by 16 and 23%, respectively, although not significant, compared to the TC experiments where compounds were degraded by 46 and 16%, respectively (p>0.05).
The results (Table 2) also showed that the degradation of the 5-6 ring PAHs were significantly (p ≤ 0.03) enhanced in the biodiesel amended samples compared to the control after 90 days. Benzo [b] and [k] fluoranthene were depleted by 56 and 63%, respectively, compared to 13 and 53%, respectively, in the control. BaP was further reduced to 88% in the TBN microcosms, while 45% depletion was seen in the TC samples. IndPY, DBAnth and BPer were reduced by 72, 64 and 66%, respectively, compared to 35-44% depletions revealed in the TC microcosms. In the TNT samples no further reductions occurred for these recalcitrant PAHs apart from BaP which was further reduced by 2%.
Stepwise degradation of PAHs using biodiesel
Growth of microorganisms: On close inspection, microbial growth became visible in the biodiesel amended samples (TBN60) after 3 weeks of biodiesel application i.e., Day 81 (Figure 6).
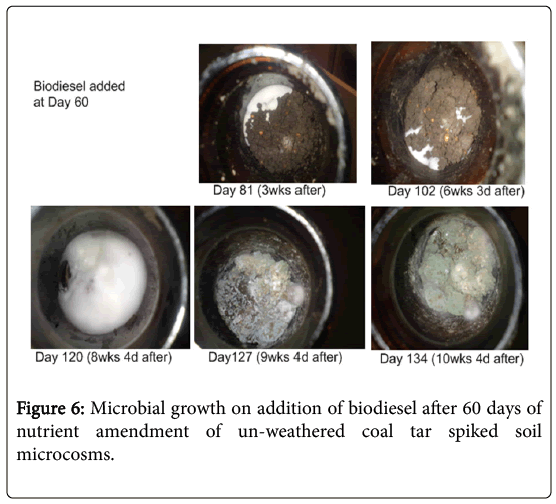
Figure 6: Microbial growth on addition of biodiesel after 60 days of nutrient amendment of un-weathered coal tar spiked soil microcosms.
Growth (white-coloured biomass) appeared to concentrate at one side of the soil surface before gradually spreading across the entire soil after about 8 weeks. Growth continued with the appearance of dense green coloured microbes after 60 days of biodiesel addition (Day 120).
Analysis of EOM levels at the end of incubation periods
Sixty days after biodiesel addition, a decrease of 25% in EOM concentration was recorded for the amended microcosms (TBN60) i.e., day 120 samples (Figure 7).
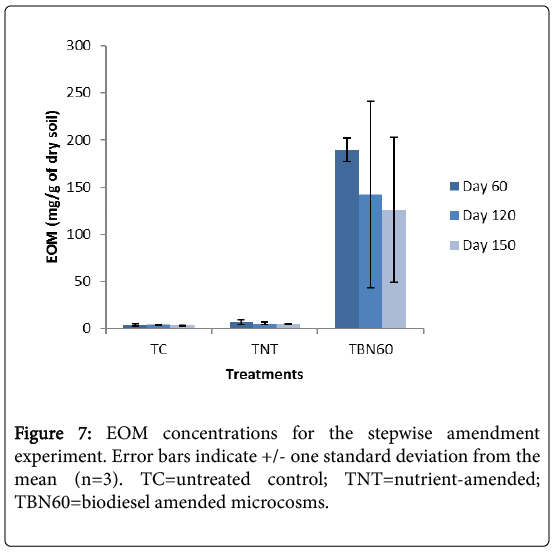
Figure 7: EOM concentrations for the stepwise amendment experiment. Error bars indicate +/- one standard deviation from the mean (n=3). TC=untreated control; TNT=nutrient-amended; TBN60=biodiesel amended microcosms.
This was observed to be considerably lower compared to previous experiments where depletion was 80% (Figure 2), when biodiesel was added at the start of the experiment and left for the same 60 days before treatment analysis. One possible reason for this could be that there was a prolonged adaptation of the indigenous microorganisms to the newly introduced carbon source (FAMEs) which is evident in the initial slow growth of microbes (Figure 6) Also, the slow degradability of biodiesel may have resulted from low nutrient availability. An earlier report by Gong et al. [34] showed, through soil respiration curves, that nutrient supply and aeration were major determinants of the degradability of polyunsaturated fatty acids in sunflower oil, which was employed in the solubilization and removal of PAHs.
At the end of 150 days incubation period, a further 9% reduction was observed in the TBN60 microcosms. For the TC samples, no further reduction was observed in their EOM concentrations during the 120 days incubation period. However, a 7% reduction was noticed after 150 days. The TNT treatments showed a further reduction of 24%, a rate almost similar to the TBN60 experiments. A further 2% decrease was, however, recorded after 150 days (Figure 7).
Increased degradation of benzo[a]pyrene (BaP) in biodiesel amended microcosms by stepwise amendment
As shown in Figure 8 and Table 3, BaP was significantly (p=0.007) reduced by 98% in the TBN60 samples after 120 days following the stepwise amendment technique compared to the control (TC) and nutrient amended microcosms.
| Concentrations of PAHs (µg/g) | |||||||||||||||||||||
|---|---|---|---|---|---|---|---|---|---|---|---|---|---|---|---|---|---|---|---|---|---|
| TC | TNT | TBN | TBN60 | ||||||||||||||||||
| Day 0 | Day 120 | Day 150 | Day 0 | Day 120 | Day 150 | Day 0 | Day 120 | Day 150 | |||||||||||||
| Mean | S.d | Mean | S.d | Mean | S.d | Mean | S.d | Mean | S.d | Mean | S.d | Mean | S.d | Mean | S.d | Mean | S.d | ||||
| Naphthalene | 299.5 | 51.7 | 1.65 | 0.3 | 0.97 | 0.1 | 222.69 | 6.3 | 1.42 | 0.2 | 1.59 | 0.3 | 21.87 | 13.4 | 1.13 | 0.4 | 0.87 | 0.7 | |||
| Acenaphthylene | 191.47 | 41.8 | 8.2 | 1.6 | 3.28 | 0.2 | 124.36 | 7.1 | 31.95 | 6 | 39.75 | 14.5 | 97.83 | 23.8 | 5.65 | 4.4 | 6.42 | 4.6 | |||
| Acenaphthene | 14.06 | 14.1 | 0.25 | 0 | 0.04 | 0 | 5.22 | 1 | 1.38 | 0.3 | 1.5 | 0.2 | 4.78 | 1.1 | 0.53 | 0.3 | 0.53 | 0.3 | |||
| Fluorene | 88 | 14.3 | 4.2 | 0.6 | 0.68 | 0.1 | 71.46 | 5.1 | 13.4 | 8.2 | 20.72 | 10.3 | 62.08 | 26.4 | 11.62 | 6.7 | 11.23 | 6.9 | |||
| Phenanthrene | 220.63 | 45.8 | 29.75 | 5 | 5.23 | 0.6 | 170.02 | 14.2 | 47.71 | 22.3 | 60.17 | 30.7 | 190.72 | 8.4 | 93.68 | 78 | 118.93 | 82.2 | |||
| Anthracene | 54.01 | 7.7 | 1.99 | 0.7 | 4.8 | 0.6 | 45.53 | 5.5 | 4.66 | 2.3 | 19.05 | 7.7 | 41.76 | 7.1 | 0 | 0 | 0 | 0 | |||
| Fluoranthene | 162.4 | 28.2 | 94.06 | 28.1 | 45.65 | 2 | 129.36 | 12.3 | 199.62 | 9 | 227.43 | 6.6 | 140 | 3.6 | 124.2 | 67.2 | 135.12 | 61.9 | |||
| Pyrene | 122.31 | 25.3 | 90.1 | 17 | 60.11 | 5.3 | 99.8 | 0.4 | 139.56 | 1.7 | 168.85 | 5.3 | 101.15 | 3.1 | 70.09 | 36.5 | 94.43 | 48.6 | |||
| Benzo[a]anthracene | 74.16 | 12.6 | 41.73 | 9 | 31.04 | 1 | 62.47 | 7.1 | 33.7 | 2.6 | 53.32 | 1.9 | 59.66 | 8.6 | 13.55 | 8 | 13.48 | 7.6 | |||
| Chrysene | 59.53 | 8.8 | 45.2 | 9.3 | 32.18 | 0.9 | 49.23 | 3.9 | 32.87 | 2.1 | 47.76 | 1.7 | 52.62 | 6.8 | 32.62 | 15.2 | 24.11 | 12.5 | |||
| Benzo[b]fluoranthene | 60.78 | 9.2 | 57.79 | 18.8 | 53.81 | 2 | 52.92 | 12.5 | 38.22 | 2.7 | 57.46 | 1.3 | 54.66 | 15 | 29.51 | 14.5 | 25.47 | 15.3 | |||
| Benzo[k]fluoranthene | 60.18 | 11.5 | 36.85 | 3.1 | 26.54 | 2.2 | 51.33 | 3.5 | 20.74 | 2.4 | 30.47 | 1.1 | 48.55 | 5.1 | 21.48 | 10.4 | 14.89 | 5.7 | |||
| Benzo[a]pyrene | 63.6 | 8.4 | 45.45 | 10 | 39.53 | 1.4 | 54.75 | 6.5 | 27.31 | 3.1 | 42.86 | 2.3 | 42.89 | 7.9 | 1.07 | 1.7 | 0.65 | 0.5 | |||
| Indeno[1,2,3-cd]pyrene | 10.03 | 3.7 | 6.61 | 1.3 | 6.55 | 0.3 | 8.77 | 3.4 | 4.29 | 0.1 | 5.93 | 0.9 | 7.91 | 2.3 | 2.69 | 1.4 | 2.09 | 1.1 | |||
| Dibenzo[a,h]anthracene | 42.11 | 8.7 | 30 | 5 | 29.14 | 2.2 | 36.16 | 5.9 | 19.54 | 0.4 | 30.26 | 1.5 | 34.23 | 6.3 | 13.62 | 7.1 | 10.83 | 5.1 | |||
| Benzo[g,h,i]perylene | 46.72 | 8.4 | 31.07 | 5 | 31.53 | 2.6 | 40.15 | 7.1 | 21.21 | 0.7 | 33.25 | 0.8 | 38.41 | 7 | 14.23 | 7.5 | 12.48 | 6.2 | |||
Table 3: Concentrations and standard deviations of the 16 EPA priority PAHs in the un-weathered coal tar spiked soil at days 0, 120 and 150. TC=untreated control, TNT=nutrient-mended and TBN60=biodiesel amended (after 60 days of nutrient treatment) microcosms.
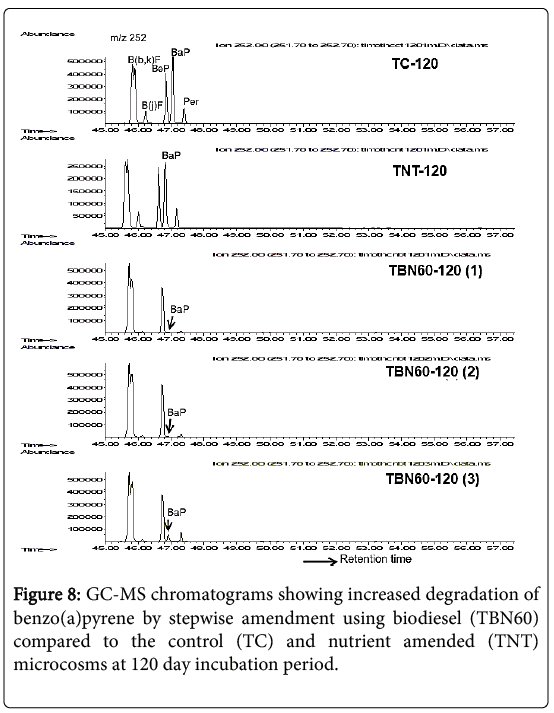
Figure 8: GC-MS chromatograms showing increased degradation of benzo(a)pyrene by stepwise amendment using biodiesel (TBN60) compared to the control (TC) and nutrient amended (TNT) microcosms at 120 day incubation period.
The chromatograms of each of the triplicate samples (TBN60-120 [1], TBN60-120 [2], TBN60-120 [3]; Figure 8) showed a consistently high degradation for this potent carcinogen when treatments were amended with biodiesel after 60 days of nutrient supplementation. The TC samples did not show any further reductions for BaP after the 45% decrease seen in the 90 day samples. However, a 50% decrease was revealed in the TNT microcosms after the 120 days of incubation.
After 150 days, i.e., at the end of the experiment, degradation of BaP further increased by 1% (i.e., a total of 99% decrease) for the TBN60 microcosms with 0.65 ppm mean concentration, while no further degradation was observed in the TNT and TC samples and their final mean concentrations showed 42.86 μg/g and 39.53 μg/g, respectively, (Table 3).
Improved degradation of phenanthrene in biodiesel amended microcosms by stepwise amendment
Contrary to previous experiments where inhibitory effects on phenanthrene (Phe) degradation was observed for the biodiesel amended samples, a 51% reduction in this 3-ring PAH was revealed in the TBN60 microcosms following the stepwise amendment technique. It therefore suggests that the degradation of Phe gradually began to increase concurrently with the nutrient-limited growth of fungal microbes on the FAMEs of biodiesel introduced after 60 days of incubation. There is also the possibility of the adaptability to Phe by the soil microorganisms after the first 60 days of pre-exposure to this compound which may have reduced the inhibition on Phe degradation, in agreement with the findings of Romero et al. [35].
The earlier suggestion that Phe inhibition in the TNT samples resulted from a nutrient induced microbial shift for naphthalene degradation and/or naphthalene toxicity also seemed to be reinforced following the 72% degradation of Phe observed in these microcosms after 120 days of incubation (Table 3). It was observed in these experiments that as naphthalene concentration reduced to 2 μg/g (after 90 days incubation, Table 2), a degradation of 16% in Phe was noticed and, when concentrations were reduced to 1.42 μg/g, an increased degradation of 72% was realised (after 120 days incubation). Although these reductions in the amended samples were not significant (p=0.3) compared to the control (TC) experiments, no further reduction in Phe was observed in the TC microcosms at this incubation period, as reduction still remained at 87%, which was similar to the percentage decrease recorded after the 90 days incubation period in the control.
At the end of the experiment, Phe was almost completely removed in the TC samples as 98% degradation was recorded. No further reductions were, however, observed in the amended microcosms which further confirm the ability of indigenous microorganisms to degrade low molecular weight PAHs independent of any form of amendments.
Effects of the step wise amendment technique on other LMW and HMW PAHs in the biodiesel amended microcosms
Although the extent of degradation was not significant (p>0.05) compared to the control, high reductions of between 81-95% were observed in the TBN60 microcosms for the 2-3 ring PAHs naphthalene, acenaphthylene, acenaphthene and fluorene, following the stepwise amendment technique after 120 days of incubation (Table 3). Depletions of these compounds in the TNT and TC samples were between 74-99% and 95-99%, respectively. Anthracene also showed a complete removal of 100% degradation in the TBN60 microcosms compared to 90 and 96% losses in the TNT and TC samples, respectively.
The 4-ring PAH, benzo[a]anthracene – B(a)A, was also significantly (p=0.007) degraded by 77% in the TBN60 microcosms compared to the TNT (46%) and TC (44%) samples (Table 3). Fluoranthene (FL), pyrene (PY) and chrysene (Ch) were, however, not significantly (p>0.05) depleted in the TBN60 microcosms compared to the control. Interestingly, FL and PY still remained un-degraded in the TNT samples even after 120 days of incubation. Reports by Lotfabad and Gray [36] have shown that Phe can act as an inhibitor for FL and Ch degradation which can in turn inhibit the degradation of PY. This lag in degradation, that seems to be more pronounced in the TNT samples, may indicate the negative effect of competitive inhibition of substrates on their rates of degradation, especially for the more hydrophobic 4- ring PAHs.
The rate of degradation of the 5-ring PAHs, the benzofluoranthenes, were not significantly (p>0.05) different in the TBN60 microcosms compared to the control (Table 3). However, Figure 4 revealed an almost complete removal of benzo (j) fluoranthene in the TBN60 microcosms relative to the TNT and TC experiments. For the other 5 and 6-ring PAHs, the results showed significantly (p≤0.02) enhanced degradation of indeno [1,2,3-cd] pyrene (IndPY), dibenzo [a,h] anthracene (DBAnth) and benzo [g,h,i] perylene (BPer) for TBN60 microcosms (60-66%) compared to the control (29-34%). Depletions of these compounds were between 46-51% in the TNT treatments which were also lower compared to the biodiesel amended microcosms.
After 150 days of incubation, increased depletions were still seen for the 5-6 ring PAHs in the TBN60 microcosms compared to the other experiments (Table 3). The benzo (b)-, and (k)-, fluoranthene were degraded by 53 and 69%, respectively, relative to TNT (-9 and 41%, respectively, and TC samples (11 and 56%, respectively; p≤0.009). Degradation in the HMW PAHs, indeno [1,2,3-cd] pyrene (IndPY), dibenzo [a,h] anthracene (DBAnth) and benzo [g,h,i] perylene (BPer) were reduced by 68-74% in the TBN60 treatments compared to TNT (16-32%) and TC (31-35%) microcosms (p=0.001).
Toxicity assessment of 90-day experiments using phosphatase enzyme assay
Results of the 60-d toxicity evaluation showed a significant (p=0.00, student t-test) 29-fold increase in enzyme activity in the TBN experiments compared to the insignificant reductions in amounts in the TC and TNT microcosms (p>0.05 student t-test) (Figure 9). This enhanced phosphatase activity following the increased degradation of toxic HMW PAHs (especially benzo[a]pyrene) in these biodiesels amended experiments indicates a high phosphorus mineralisation in these treatments. Although enzyme activity reduced slightly after 90 days of remediation, TBN experiments still exhibited the highest amount of phosphatase activity (22.13 μmol p-nitrophenol/g soil/h) which was 10 and 8 times more than the TC (2.19 μmol pnitrophenol/ g soil/h) and TNT (2.74 μmol p-nitrophenol/g soil/h) microcosms, respectively. These results showed that the untreated control (TC) had the least phosphatase activity at the end of the experiment (p=0.027, ANOVA) compared to the amended treatments. Overall, the soil microcosms can be ranked as TBN>TNT>TC in terms of observed amounts in phosphatase enzyme activity.
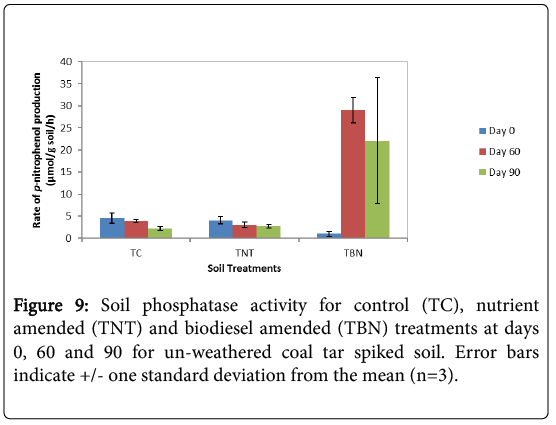
Figure 9: Soil phosphatase activity for control (TC), nutrient amended (TNT) and biodiesel amended (TBN) treatments at days 0, 60 and 90 for un-weathered coal tar spiked soil. Error bars indicate +/- one standard deviation from the mean (n=3).
A negative correlation (r=-0.96) was also established between phosphatase activity and the extractable organic matter (EOM) concentrations for the TBN treatments as activity increased at decreasing levels of EOM (Table 4). However, positive correlations were seen for the TC (r=0.676) and TNT (r=0.989) treatments which showed consistent reductions in phosphatase activity even at reduced levels of EOM (Table 4). Although several factors influence enzymatic activities, response levels could also be associated with the amount of constituent toxicants, especially the more recalcitrant 5-6 ring PAHs as is the case with the TBN microcosms which had lower concentrations of these compounds compared to the TC and TNT treatments. Baran et al. [37] in their work, also came to a similar interpretation when reporting the differing effects of the types and amounts of PAH on the activities of dehydrogenase, urease, protease and phosphatase enzymes from different pollution sources.
| Treatment | Incubation period (days) | Phosphatase enzyme activity ((µmol/g soil/h)) | Extractable organic matter (EOM, mg/g) | Pearson correlation coefficient (r) |
|---|---|---|---|---|
| Control | 0 | 4.58 ± 1.14 | 5.95 ± 1.04 | 0.676 |
| (TC) | 60 | 3.89 ± 0.34 | 3.63 ± 1.02 | |
| 90 | 2.19 ± 0.42 | 3.80 ± 0.09 | ||
| Nutrient- amended | 0 | 4.04 ± 0.80 | 10.4 ± 1.63 | 0.989 |
| (TNT) | 60 | 3.03 ± 0.60 | 6.77 ± 2.66 | |
| 90 | 2.74 ± 0.45 | 4.74 ± 0.90 | ||
| Biodiesel-amended | 0 | 0.99 ± 0.60 | 162.34 ± 15.04 | -0.959 |
| (TBN) | 60 | 29.00 ± 2.80 | 32.92 ± 7.06 | |
| 90 | 22.13 ± 14.27 | 25.54 ± 5.86 | ||
| Control | 60 | 3.89 ± 0.34 | 3.63 ± 1.02 | 0.885 |
| (TC) | 120 | 4.76 ± 0.58 | 3.90 ± 0.42 | |
| 150 | 3.86 ± 0.30 | 3.37 ± 0.32 | ||
| Nutrient- amended | 60 | 3.03 ± 0.60 | 6.77 ± 2.66 | 0.899 |
| (TNT) | 120 | 2.34 ± 0.47 | 5.14 ± 1.23 | |
| 150 | 1.66 ± 0.18 | 5.02 ± 0.12 | ||
| Biodiesel-amended | 60 | 2.36 ± 0.25 | 189.66± 12.29 | 0.985 |
| (TBN60) | 120 | 0.93 ± 0.66 | 142.22 ± 98.93 | |
| 150 | 0.80 ± 0.55 | 125.72 ± 76.92 |
Table 4: Correlation data of the phosphatase enzyme activity and the extractable organic matter (EOM) for the control, nutrient and biodiesel amended microcosms of un-weathered coal tar spiked soil.
Soil amendment with an additional carbon source and nutrients have also been reported to reduce the impact of PAH toxicity on soil enzymatic activity [37]. The addition of compost, manure or straw to PAH polluted soils have revealed increases in microbial and enzymatic functions which have been attributed to increased total organic carbon (TOC) on amendment; increased resistance to denaturation as enzymes form stable complexes (enzyme-humus) with the organic matter (in the case of compost) and; the generation of enzyme stimulatory components from the mineralization process e.g., straw [37-41]. The utilization of biodiesel as an additional carbon source in this study therefore explains the large differences in phosphatase enzyme activity between these samples and the other treatments (TC and TNT) which could also be ascribed to increased TOC content as well as the production of stimulatory enzymatic effects from the degradation of its component fatty acid methyl esters (FAMEs).
Toxicity assessment of stepwise amendment experiments by phosphatase enzyme assay
Phosphatase activity was measured after the 120 and 150 days incubation periods for these experiments. From the results presented in Figure 10, the biodiesel amended treatments (TBN60) showed the least phosphatase activity compared to the control (TC) and nutrient amended (TNT) samples for both incubation periods.
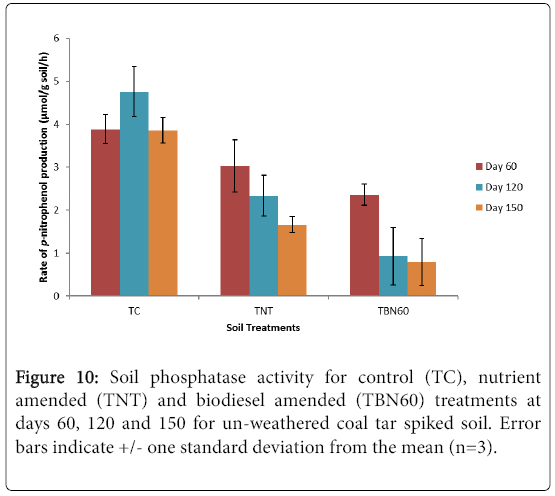
Figure 10: Soil phosphatase activity for control (TC), nutrient amended (TNT) and biodiesel amended (TBN60) treatments at days 60, 120 and 150 for un-weathered coal tar spiked soil. Error bars indicate +/- one standard deviation from the mean (n=3).
The day 120 results (Figure 10, Table 4) showed that enzyme activity was reduced significantly by 61% (p=0.025, student t-test) in the TBN60 microcosms and 23% decrease (p>0.05, student t-test) was also observed in the TNT samples compared with their day 60 samples. Although a 22% rise in activity was exhibited by the control (TC) samples at this period of incubation (120 d), it was, however, not statistically different (p>0.05, student t-test) from the amounts recorded previously for 60 d microcosms. At the end of the experiment (150 d), phosphatase enzyme activity further decreased by 66% in the TBN60 treatments, with results showing significantly reduced amounts (0.8 μmol p-nitrophenol/g soil/h, p=0.011) compared to results from 60 d (2.36 μmol p-nitrophenol/g soil/h, Figure 10 and Table 4). A further 29% reduction (p=0.02, student t-test) was observed in the TNT treatments compared to activity recorded at 60 d, while enzyme activity levels dropped by 19% (p>0.05, student t-test, nearly equal to the initial amounts recorded in day 60, for the TC samples. Overall, the soil microcosms can be ranked as TC>TNT>TBN in terms of observed amounts in phosphatase enzyme activity.
The decline in the phosphatase enzyme activity observed in the TBN60 treatments after biodiesel addition at 60 d may be due to an overall reduced biological activity in these microcosms, inferred from the high residual EOM levels at the end of the experiment (Table 4). This significant reduction following the slow utilization of biodiesel as an additional carbon source, may have resulted from the nutrientlimited growth of microorganisms within these treatments which had probably induced a lower demand for phosphorus and a consequent decline in the release of the phosphatase enzymes. Similar changes in phosphatase activities caused by low nutrient availability that occur during the mineralisation of high C content materials have also been reported e.g., by Albrecht et al. [42]. In their work, the second stage composting of sewage sludge and green waste showed a remarkable decrease in microbial and phosphatase enzyme activity with a consistent reduction in the lipid component (CH2-groups) of the sludge. Cometabolic degradation of lignin substances by enzymes such as lignin peroxidases, laccases and manganese-dependent peroxidases during the production of humic substances was also observed [43]. The first stage of composting was, however, characterized by an increase in phosphatase enzymatic activity which was attributed to the high nutrient content of the sewage sludge [42].
The negative effect of increased incubation time on phosphatase enzyme activity for organic and nutrient amended treatments inclusive, has also been demonstrated [e.g., 44]. Their study revealed that although available phosphorus (P) increased with time in both amended and un-amended treatments, reduced activities were, however, recorded for all the phosphatase enzymes (acid and alkaline phosphomonoesterases and phosphodiesterases) when incubation period was increased from 25 to 87 days. This same trend was also observed in this study (Figure 10) as all treatments exhibited a steady decrease in phosphatase activity when incubation time increased from 60 to 150 days, except for the increase noticed in the control at day 120, which, however, reduced after 150 days of incubation (Figure 10, Table 4).
It is also possible that soil toxicity was induced by the residual components of the fatty acid methyl esters after the 90 days of incubation. The reversibility of the transesterification process produces methanol, a water soluble compound that has been reported to elicit cytotoxic effects by altering acid phosphatase activity in multi-cellular organisms [45] and also able to reduce microbial growth at high concentrations in the soil [46]. Studies by Sannino and Gianfreda [47] also corroborate the stimulatory and inhibitory effects of methanol on soil phosphatase enzyme activities. It is also not unlikely that the 60- day pre-exposure of soil enzymes to toxic coal tar PAHs after nutrient supplementation may have consequentially reduced the sensitivity of the phosphatase enzyme activity to stimulation. This can be inferred from the lack of stimulatory effect on addition of biodiesel, even though degradation of LMW and HMW PAHs still occurred in these treatments consequent to the increase in PAH bioavailability.
The phosphatase enzyme activity data in Table 4 showed a strong positive relationship with EOM levels for the various incubation periods in all treatments as calculated coefficient values (r) revealed 0.885, 0.899 and 0.985 for the TC, TNT and TBN60 microcosms, respectively. This highlights the observation that at reduced EOM concentrations, enzyme activities were at reduced levels throughout the experiment.
Toxicity evaluation by microtox assay: Seven samples (all in triplicate), were selected for toxicity evaluation using the Microtox bioassay. These included the day 0 (control and biodiesel amended) and day 60 (control, nutrient and biodiesel amended) samples from the 90-day incubation experiments (a total of 5 triplicates) and; the biodiesel amended microcosms for days 60 and 120 (a total of 2 triplicates) from the stepwise amendment experiments. Tests were also conducted for phenol which was used as the positive control. The mean EC50 of each sample at incubation time of 5 and 15 minutes is shown in Table 5.
| Basic test Microtox EC50 (mg/L) | |||
|---|---|---|---|
| Sample | Mean concentration (stock, mg/L) | 5 min | 15 min |
| TC (day 0) | 2.99 | 0.86 ± 0.11 | 1.0 ± 0.21 |
| TBN (day 0) | 27.1 | 9.87 ± 1.62 | 9.55 ± 1.63 |
| TC (day 60) | 1.99 | 1.34 ± 0.41 | 1.23 ± 0.28 |
| TNT (day 60) | 3.5 | 0.95 ± 0.29 | 1.15 ± 0.36 |
| TBN (day 60) | 5.5 | 2.12 ± 0.45 | 1.88 ± 0.36 |
| bTBN60 (day 60) | 31.6 | 15.0 ± 3.04 | 16.21 ± 4.46 |
| bTBN60 (day 120) | 23.7 | 6.93 ± 4.47 | 6.38 ± 4.84 |
| Phenol | 100 | 17.16 ± 1.18 | 20.21 ± 2.35 |
Table 5: The mean EC50 of selected control, nutrient- amended and biodiesel amended microcosms from both experiments. EC50 values are expressed as mean ± standard deviation; TC=untreated control, TNT=nutrient amended, TBN=biodiesel amended, TBN60=Biodiesel amendment after 60 days of nutrient supplementation. Incubation time is shown in parentheses. b=stepwise amendment experiment.
At 5 min incubation time, the results showed that biodiesel amendment of PAH contaminated soil can lower soil toxicity as the day 0 microcosms showed significant reductions by 11 fold (p=0.011, student t-test) relative to the untreated control. After 60 days of incubation, the Microtox EC50 reduced significantly by 4.7 fold (p=0.001, student t-test) for the TBN microcosms as a more toxic response was produced. However, these microcosms still showed the least toxicity (p=0.025, ANOVA) as their mean EC50 was the highest (2.12 mg/L,) compared to the untreated control (TC, 1.34 mg/L) and the nutrient amended treatments (TNT, 0.95 mg/L). Although the mean EC50 increased for the untreated control after the 60 days incubation, implying a less toxic response compared to the freshly spiked day 0 control, these values were, however, not statistically significant (p=0.119, student t-test). Data from the 15 min incubation periods did not change significantly (p>0.05, student t-test) from the corresponding results obtained for the 5 min exposure to Vibrio fischeri in all treatments.
Toxicity evaluation of the stepwise amendment experiments also showed a significant reduction in soil toxicity on amendment with biodiesel after 60 days of nutrient supplementation. The high mean EC50 obtained for these TBN60 soil samples (15 mg/L) was consistent with the low toxic response also observed for the TBN (day 0) experiments (9.87 mg/L, Table 5). After an additional 60 days of incubation (120 d), the mean EC50 also reduced but, by only 2 fold (6.93 mg/L) which was not statistically different (p>0.05 student t-test) from the EC50 of the 60 d treatments (15 mg/L) which showed lower toxicity. Again, data from the 15 min incubation periods did not change significantly (p>0.05, student t-test) from the corresponding results obtained for the 5 min exposure to Vibrio fischeri in all the treatments. The reference toxicant (phenol) also showed results that fell within acceptable limits: EC50 :5 min-between 13 and 26 mg/L [48].
According to Baker and Herson [49], supplemental carbon additions increase soil microbial biomass and the biodegradation rates of contaminants as well as reduce the impact of high concentrations of toxic organics on soil micro-organisms (i.e., lessen the per microbetoxin concentration), as corroborated by [50]. This resultant reduction in toxic concentrations may be the reason for the low toxicity responses, evidenced by the high mean EC50 values when compared to the control, on amendment of PAH-contaminated soil with biodiesel. Following biodegradation and biodiesel breakdown, toxic response was seen to increase significantly for the non-stepwise amended experiments, while increase was not significantly noticed in the stepwise amended treatments. This increased toxicity may have been induced by the possible occurrence of residual toxic intermediates from the cometabolic degradation or transformation of recalcitrant PAHs [51], high acidity from the hydrolysis of the fatty acid methyl esters [52] or increased bioavailability of PAHs from the solvency effect of biodiesel [53,54].
The insignificant rise in toxicity noticed in the stepwise amended experiments was probably due to the presence of substantial amounts of biodiesel in the microcosms after the 60 day amendment period (i.e., 120 d), as only 25% reduction in EOM levels occurred in these samples after the incubation period. It is possible that a reduction in the impact of PAH toxicity may have occurred steadily in these treatments following the slow degradation of biodiesel. The enhanced degradation of the LMW and HMW PAHs especially phenanthrene and benzo[a]pyrene in these samples over the increased incubation time of 120 days could also be contributory factors. However, these results have shown that it is possible to achieve increased PAH bioavailability, high removal of LMW and HMW PAHs and an insignificant increase in soil toxicity from the slow breakdown of biodiesel, as was evident in the application of the stepwise amendment technique.
Conclusions
In this study, biodiesel amendment enhanced the biodegradation of recalcitrant, high molecular weight PAHs in un-weathered coal tar experiments. Treatments showed significant depletion in benzo[a]pyrene (BaP), a potent carcinogen, and other 5 and 6 ring high molecular weight PAHs, after 60 days of amendment. The visible growth of fungal hyphae and moulds observed in all biodieselamended microcosms after amendment suggests that fungi, most probably, lignin peroxidases (LiPs), may be responsible for the cometabolic degradation of these compounds following the complete degradation of anthracene-the simplest PAH substrate of the lipid peroxidases, and the preferential degradation of rapeseed methyl esters as additional carbon source likely played a part in the degradation of the PAHs. The application of the stepwise amendment approach also showed significantly higher reductions in BaP (98%) 60 days after adding biodiesel to nutrient treated samples. The inhibitory effect on phenanthrene degradation was also relieved as more than 50% reduction was then recorded for this compound.
The toxicity evaluation of the coal tar remediated soil showed that amendment with biodiesel stimulated phosphatase enzyme activity and decreased the impact of PAH toxicity in the soil samples compared to the un-amended (control) and nutrient amended microcosms. Results obtained from the Microtox bioassay also revealed that the biodiesel treated experiments exhibited lower toxic responses to Vibrio fischeri for the different exposure periods (5 and 15 min incubation), compared to the other treatments. Significant reduction in toxicity was also observed when soil samples were amended with biodiesel after 60 days of nutrient supplementation.
Acknowledgements
We are grateful to the Petroleum Technology Development Fund (PTDF), Nigeria for sponsoring this work. We also acknowledge all the support from Berni Bowler, Paul Donohoe, Philip Green and Catherine Aitken.
References
- Schobert HH, Song C (2002) Chemicals and materials from coal in the 21st century. Fuel 81: 15-32.
- Krzesińska M, Pilawa B, Pusz S (2006) The physical parameters of different rank coals related to their degree of cross-linking amd the caking ability. Energy and Fuels 20: 1103-1110.
- Mahler BJ, Metre PCV, Crane JL, Watts AW, Scoggins M, et al. (2012) Coal-tar-based pavement sealcoat and PAHs: Implications for the environment, human health, and stormwater management. Environmental Science and Technology 46: 3039-3045.
- OFR (1982) Office of the Federal Registration, Appendix A: priority pollutants. Fed Reg 47: 52309.
- Bamforth SM, Singleton I (2005) Bioremediation of polycyclic aromatic hydrocarbons: current knowledge and future directions. Journal of Chemical Technology and Biotechnology 80: 723-736.
- Peng RH, Xiong AS, Xue Y, Fu XY, Gao F, et al. (2008) Microbial biodegradation of polyaromatic hydrocarbons. FEMS Microbiology Reviews 32: 927-955.
- Poster DL, Schantz MM, Sander LC, Wise SA (2006) Analysis of polycyclic aromatic hydrocarbons (PAHs) in environmental samples: A critical review of gas chromatographic (GC) methods. Analytical and Bioanalytical Chemistry 386: 859-881.
- Juhasz AL, Naidu R (2000) Bioremediation of high molecular weight polycyclic aromatic hydrocarbons: a review of the microbial degradation of benzo[a]pyrene. International Biodeterioration and Biodegradation 45: 57-88.
- Juhasz AL, Britz ML, Stanley GA (1997) Degradation of benzo[a]pyrene, dibenz[a,h]anthracene and coronene by Burkholderiacepacia. Water Science and Technology 36: 45-51.
- Zhang X, Peterson C, Reece D, Haws R, Möller G (1998) Biodegradability of biodiesel in the aquatic environment. Transactions of the American Society of Agricultural Engineers 41: 1423-1430.
- Pasqualino JC, Montané D, Salvadó J (2006) Synergic effects of biodiesel in the biodegradability of fossil-derived fuels. Biomass and Bioenergy 30: 874-879.
- Taylor LT, Jones DM (2001) Bioremediation of coal tar PAH in soils using biodiesel. Chemosphere 44: 1131-1136.
- Dawson JJC, Godsiffe EJ, Thompson IP, Ralebitso-Senior TK, Killham KS, et al. (2007) Application of biological indicators to assess recovery of hydrocarbon impacted soils. Soil Biology and Biochemistry 39: 164-177.
- Płaza G, Nałȩcz-Jawecki G, Ulfig K, Brigmon RL (2005) The application of bioassays as indicators of petroleum-contaminated soil remediation. Chemosphere 59: 289-296.
- Lors C, Perie F, Grand C, Damidot D (2009) Benefits of ecotoxicological bioassays in the evaluation of a field biotreatment of PAHs polluted soil. Global Nest Journal 11: 251-259.
- López L, Pozo C, Rodelas B, Calvo C, González-López, J (2006) Influence of pesticides and herbicides presence on phosphatase activity and selected bacterial microbiota of a natural lake system. Ecotoxicology 15: 487-493.
- Labud, V, Garcia C, Hernandez T (2007) Effect of hydrocarbon pollution on the microbial properties of a sandy and a clay soil. Chemosphere 66: 1863-1871.
- Parvez S, Venkataraman C, Mukherji S (2006) A review on advantages of implementing luminescence inhibition test (Vibrio fischeri) for acute toxicity prediction of chemicals. Environment International 32: 265-268.
- Cassells NP, Lane CS, Depala M, Saeed M, Craston DH (2000) Microtox® testing of pentachlorophenol in soil extracts and quantification by capillary electrochromatography (CEC) - A rapid screening approach for contaminated land. Chemosphere 40: 609-618.
- Tabatabai MA, Bremner JM (1969) Use of p-nitrophenyl phosphate for assay of soil phosphatase activity. Soil Biology and Biochemistry 1: 301-307.
- Blaise C, Ferard JF (2005) Small-Scale Freshwater Toxicity Investigations. Springer, Netherlands.
- Stauffer E, Byron D (2007) Alternative fuels in fire debris analysis: Biodiesel basics. Journal of Forensic Sciences 52: 371-379.
- MacNaughton SJ, Stephen, JR, Venosa AD, Davis GA, Chang YJ, et al. (1999) Microbial population changes during bioremediation of an experimental oil spill. Applied and environmental microbiology 65: 3566-3574.
- Kim M, Bae S, Seol M, Lee JH, Oh YS (2008) Monitoring nutrient impact on bacterial community composition during bioremediation of anoxic PAH-contaminated sediment. Journal of Microbiology 46: 615-623.
- Viñas M, Sabaté J, Espuny MJ, Solanas AM (2005) Bacterial community dynamics and polycyclic aromatic hydrocarbon degradation during bioremediation of heavily creosote-contaminated soil. Applied and Environmental Microbiology 71: 7008-7018.
- Bouchez M, Blanchet D, Vandecasteele JP (1995) Degradation of polycyclic aromatic-hydrocarbons by pure strains and by defined strain associations-inhibition phenomena and cometabolism. Applied Microbiology and Biotechnology 43: 156-164.
- Stringfellow WT, Aitken MD (1995) Competitive metabolism of naphthalene, methylnaphthalenes, and fluorene by phenanthrene-degrading pseudomonads. Applied and Environmental Microbiology 61: 357-362.
- Shuttleworth KL, Cerniglia CE (1996) Bacterial degradation of low concentrations of phenanthrene and inhibition by naphthalene. Microbial Ecology 31: 305-317.
- Kim IS, Park JS, Kim KW (2001) Enhanced biodegradation of polycyclic aromatic hydrocarbons using nonionic surfactants in soil slurry. Applied Geochemistry 16: 1419-1428.
- Rogers SW, Ong SK, Kjartanson BH, Golchin J, Stenback GA (2002) Natural attenuation of polycyclic aromatic hydrocarbon-contaminated sites: review. Practice Periodical of Hazardous, Toxic, and Radioactive Waste Management 6: 141-155.
- Yu KSH, Wong AHY, Yau KWY, Wong YS, Tam NFY (2005) Natural attenuation, biostimulation and bioaugmentation on biodegradation of polycyclic aromatic hydrocarbons (PAHs) in mangrove sediments. Marine Pollution Bulletin 51: 1071-1077.
- Hormisch D, Brost I, Kohring GW, Giffhorn F (2000) Degradation of acenaphthene and acenaphthylene by isolated bacteria and influence of fertilizers on the PAH degrading population in soils. In: Fourteenth Forum for Applied Biotechnology, Brugge, Belgium, Proceedings part I.
- Gong Z, Wilke BM, Alef K, Li P, Zhou Q (2006) Removal of polycyclic aromatic hydrocarbons from manufactured gas plant-contaminated soils using sunflower oil: Laboratory column experiments. Chemosphere 62: 780-787.
- Romero MC, Cazau MC, Giorgieri S, Arambarri AM (1998) Phenanthrene degradation by microorganisms isolated from a contaminated stream. Environmental Pollution 101: 355-359.
- Lotfabad S, Gray M (2002) Kinetics of biodegradation of mixtures of polycyclic aromatic hydrocarbons. Applied microbiology and biotechnology 60: 361-366.
- Baran S, Bielińska JE, Oleszczuk P (2004) Enzymatic activity in an airfield soil polluted with polycyclic aromatic hydrocarbons. Geoderma 118: 221-232.
- Ros M, Hernandez MT, Garcıa C (2003) Soil microbial activity after restoration of a semiarid soil by organic amendments. Soil Biology and Biochemistry 35:463-469.
- Haritash AK, Kaushik CP (2009) Biodegradation aspects of Polycyclic Aromatic Hydrocarbons (PAHs): A review. Journal of Hazardous Materials 169: 1-15.
- Shahsavari E, Adetutu EM, Anderson PA, Ball AS (2013) Plant residues—a low cost, effective bioremediation treatment for petrogenic hydrocarbon-contaminated soil. Science of the Total Environment 443: 766-774.
- Wyszkowska J, Wyszkowski M (2010) Activity of soil dehydrogenases, urease, and acid and alkaline phosphatases in soil polluted with petroleum. Journal of Toxicology and Environmental Health, Part A, 73: 1202-1210.
- Albrecht R, Le Petit J, Calvert V, Terrom G, Périssol C (2010) Changes in the level of alkaline and acid phosphatase activities during green wastes and sewage sludge co-composting. Bioresource technology 101: 228-233.
- Albrecht R, Périssol C, Ruaudel F, Le Petit J, Terrom G (2010) Functional changes in culturable microbial communities during a co-composting process: carbon source utilization and co-metabolism. Waste Management 30: 764-770.
- Criquet S, Braud A (2008) Effects of organic and mineral amendments on available P and phosphatase activities in a degraded Mediterranean soil under short-term incubation experiment. Soil and Tillage Research 98: 164-174.
- Da Cruz ACS, Leite MBN, Rodrigues LEA, Nascimento IA (2012) Estimation of biodiesel cytotoxicity by using acid phosphatase as a biomarker of lysosomal integrity. Bulletin of environmental contamination and toxicology 89: 219-224.
- Luong JHT (1987) Generalization of Monod kinetics for analysis of growth data with substrate inhibition. Biotechnology and Bioengineering 29: 242-248.
- Sannino F, Gianfreda L (2001) Pesticide influence on soil enzymatic activities. Chemosphere 45: 417-425.
- Baker KH, Herson DS (1994) Bioremediation. McGraw-Hill Inc, New York, USA.
- Banat IM, Franzetti A, Gandolfi I, Bestetti G, Martinotti MG, et al (2010) Microbial biosurfactants production, applications and future potential. Applied microbiology and biotechnology 87: 427-444.
- Cruz JM, Lopes PRM, Montagnolli RN, Tamada IS, Silva NMMG, et al. (2013) Toxicity assessment of contaminated soil using seeds as bioindicators. Journal of Applied Biotechnology 1: 1.
- Leung DYC, Koo BCP, Guo Y (2006) Degradation of biodiesel under different storage conditions. Bioresource technology 97: 250-256.
- Gong Z, Wang X, Tu Y, Wu J, Sun Y, et al. (2010) Polycyclic aromatic hydrocarbon removal from contaminated soils using fatty acid methyl esters. Chemosphere 79: 138-143.
- Wu J, Gong Z, Zheng L, Yi Y, Jin J, et al. (2010) Removal of high concentrations of polycyclic aromatic hydrocarbons from contaminated soil by biodiesel. Frontiers of Environmental Science & Engineering in China 4: 387-394.
Citation: Oriaku TO, Jones DM (2018) Enhanced Degradation of Benzo[α]Pyrene in Coal Tar Contaminated Soils Using Biodiesel. J Bioremediat Biodegrad 9: 426. DOI: 10.4172/2155-6199.1000426
Copyright: © 2018 Oriaku TO, et al. This is an open-access article distributed under the terms of the Creative Commons Attribution License, which permits unrestricted use, distribution, and reproduction in any medium, provided the original author and source are credited.
Select your language of interest to view the total content in your interested language
Share This Article
Recommended Journals
Open Access Journals
Article Tools
Article Usage
- Total views: 6385
- [From(publication date): 0-2018 - Dec 08, 2025]
- Breakdown by view type
- HTML page views: 5336
- PDF downloads: 1049