Estimation of Crack Mouth Opening Displacement in Concrete Using Optical Fiber Sensors
Received: 29-Oct-2017 / Accepted Date: 11-Dec-2017 / Published Date: 15-Feb-2018 DOI: 10.4172/2476-2075.1000126
Abstract
Concrete is a multi-phase composite material and used widely in construction industry because of high compressive strength and low cost. Its limited tensile strength makes it prone to cracking. Important parameters like characteristic length, fracture energy Gf critical crack width WC are used to understand cracks in concrete. The crack width is estimated either as crack mouth opening displacement (CMOD/COD) or as crack tip opening displacement (CTOD). Several optical and non-optical methods can provide information about crack presence but do not provide information on crack opening and crack width which are important from considerations of durability. To this end we present our research results in three point bend tests on pre-notched concrete samples (M-20 composition) using (a) Intensity based plastic optic fiber (POF) using phase difference measurement method (b) Fiber Bragg grating (FBG) method. The CMOD estimation and relative sensitivity of these methods will be presented.
Keywords: Crack mouth opening displacement; Three point bend specimens; UTM; FBGs; Plastic optical fiber; Phase difference method; Prenotched concrete
Introduction
Concrete is known to be a multiphase composite material, which consists of a mixture of cement, coarse and fine aggregates, water, air and chemical admixtures. In the process of SHM (structural health monitoring), crack detection and width measurement is one of the several other monitored parameters [1,2]. Cracks in concrete mainly occur due to (i) Continuous exposure to harsh environments and in service loading (ii) Application of repeated loads or combination of loads and (iii) Natural hazards, aging, thermal contraction upon drying, etc. Generally, crack widths ranging from 0.2 mm to 2.0 mm are known, leading to structural failure. The load deformation curve of a quasi-brittle material as concrete is illustrated in (Figure 1).

Figure 1: The load deformation plot of concrete
The fracture behavior of quasi-brittle materials such as concrete is characterized by a Fracture Process Zone (FPZ) ahead of the main crack. Here several mechanisms such as micro-cracking, crack deflection, aggregate bridging and crack branching, determine the fracture behavior of concrete[3,4]. This is illustrated in Figure 2 below. When the material is tested under the displacement beyond the When the material is tested under closed loop displacement controlled testing condition, the displacement beyond the peak stress results due to major crack opening. (Shown as point of starting of strain localization in (Figure 1) This process is accompanied by unloading of the rest of the specimen. The Crack Mouth Opening Displacement (CMOD) is known to be a good indicator of fracture properties that characterize the concrete materials It is however often difficult to determine Crack Tip Opening Displacement (CTOD) as it is linked to the details of constitution of the micro cracked zone. However CTOD is related to the crack mouth opening displacement (CMOD). The interrelationship between CMOD and CTOD is complex mainly due to the considerable extent of the micro cracked zone in front of the crack tip.

Figure 2: Fracture Process Zone (FPZ) in concrete illustrating the mechanisms that operates.
In recent times fiber optic sensors have been adopted for crack monitoring and detection. These include mainly Plastic Optic Fiber (POF) and Fiber Bragg gratings (FBG). Each of these have their own limits of applicability.
Survey of NDT methods in concrete
The nondestructive techniques used for sensing cracks and crack monitoring are broadly divided into (1) Non optical methods and (2) Optical methods. The non-optical methods include (a) Ultrasonic (b) impact-echo method (c) Acoustic emission (d) Infrared thermograph and (e) Ground penetrating radar [5,6]. The optical fiber sensor based methods are classified further as (a) Intensity modulated sensors (b) Polari metric sensors, (c) Interferometric sensors and (d) Spectrometric sensors [7,8]. The intensiometric sensors can be used efficiently for long range sensing applications using economical devices. The interferometric sensors, FBG sensors, and polarimetric sensors are more preferred for localized sensing, but involve complicated and costly signal processing and it is also easier to measure the optical power than the phase/state of light polarization[9,10]. The notable methods in recent times also include digital image correlation (DIC) [11,12] and fiber loop ring down technique (FLRD) [13]. Various fiber optic sensors have been developed in the recent past for the detection of cracks in concrete specimens, however most of them are limited in their applications.
The necessity of choosing a method needs to address:
Need only detection of crack and trace its propagation.
Is it needed to measure the crack width at the chosen location or in distributed points?
In this paper we report on our research using: POF sensors.
FBG sensors for estimation of CMOD in prenotched concrete specimens subjected to three point bend (TPB) test. We shall also present our results of comparison of the sensitivity of these techniques in M_20 composition of concrete.
Experimental
Materials
Cement conforming to ISI 12269-1983 with specific gravity 3.15 was used for the concrete mix. Natural river sand that has specific gravity 2.60 is used as fine aggregate. Crushed coarse aggregate of two sizes (a) 20 mm size aggregate constituting 60% is mixed with (b)Aggregate of 10 mm size that constitutes 40%. The specific gravity of the various constituents is listed in (Table 1).
| Property | Cement (IS 12269-1983) |
Natural river sand (Fine aggregate) |
Crushed Coarse Aggregate |
|---|---|---|---|
| Specific gravity | 3.15 | 2.60 | 2.78 |
Table 1: Specific gravity of the constituents of M-20 composition.
Casting process
Cubes casted with 100 mm side were used to determine the compressive strength of concrete while cylinders casted with 150 mm diameter and 300 mm length were used to determine the modulus of elasticity of the concrete. The elasticity modulus of the concrete is experimentally found to be 28.560 MPa, which is confirming to the M20 grade mix composition specifications. Prisms of dimensions (400 × 100 × 100) mm (L × B × D) and beams of dimensions (700 × 500 × 100) mm (L × B × D) (Table 2), size were cast with the above concrete.
| Beam Dimensions(mm) |
Concrete compressive Strength (MPa) |
Cement | Fine | Coarse Aggregate |
W/C Ratio |
|---|---|---|---|---|---|
| 400 x100 x 100 700 x150 x100 |
27 | 1 | 1.58 | 3.17 | 0.5 |
Table 2: Properties of the Concrete specimens.
A needle vibrator has been used for compaction. All the specimens were cured for 28 to 40 days in the curing tank. At the end of curing time the samples were separated from the curing tank and a notch was made in the specimens using a notch cutter. Notch depth (a/d=0.2, 0.3) was used for the prisms and beams. The nomenclature for the TPB specimens and photograph of casted beams in curing tank are shown in (Figures 3A and 3B) respectively.

Figure 3a: Nomenclature for TPB specimens.

Figure 3b: Photograph showing the casted specimens in the curing tank.
The measured compressive strength (MPa) for the M_20 composition is 27 MPa.
3.0 Principle of the POF Sensor using Phase Difference Method: Plastic Optic Fiber sensor (POF) has been chosen for estimation of crack width measurement for prenotched concrete beams subjected to three point bend (TPB) test guided by the following considerations: It is (a) economical sensor-wise (b) provides high sensitivity (c) is rugged on concrete surface and capable of being embedded into concrete (d) sensor has fast response. The crack widths to be measured lie in the range (0.02 mm-3 mm). In our earlier experiments, we have reported on the use of POF for estimation of crack width in TPB tests of concrete from the technique of amplitude changes [10,14]. The present technique is based on an adoption of POF based strain sensor using phase measurement [15]. A step index multimode POF with a core diameter of 980 μm having a numerical aperture of 0.5 with sensitivity at 650 nm was employed to measure the strain developed in terms of phase difference. The fiber was divided into two parts of equal length, POF1 and POF2, out of which (a) POF1 is unstrained fiber while, (b) POF2 is the sensing fiber.
Sensitization of POF2 The POF2 was sensitized following the procedure outlined at [10] . The surface of the POF2 was abraded using a fresh blade, resulting in the removal of a length of the cross section of cladding. The length of the cladding to be removed was determined prior to experimentation (we refer to this as guage/sensitization length, approximate range=3 cm). This was done by abrading the surface of the POF using a razor blade sufficient care and practice was adopted to ensure that the blade prevents from cutting into the fiber. In such an unclad fiber section there occurs loss of light to the environment by the evanescent penetration. This leads to great reduction in the number of propagating modes in the fiber core. The deformation of the sensor also results in significant light loss through increase of the sensitized zone length. In this way the process of abrasion, increases the amount of light lost in the POF2 during its bending process resulting in better accuracy. There are no known tradeoffs related to the abrasion process. The sensor so prepared was glued to the pre-notched concrete specimen using a cyanoacrylate adhesive for the measurement of the crack mouth opening displacement (CMOD). Figure 4 (a) shows a photograph of the bottom surface of the concrete beam with the POF2 bonded to it. Figure 4 (b) The Three point bend test.

Figure 4: (a) The POF2 bonded to concrete; (b) The Three point bend test: In Figure 4 (b) the overall experimental set up for the three point bend (TPB) specimen using a 1000 kn UTM in the Civil Engineering Department at NIT; Warangal is presented. The unstrained POF1 was freely placed at rest position.
A schematic of the arrangement of the TPB testing using 1000 kn digitally controlled UTM is shown in Figure 5. The function generator sends a sinusoidal electronic signal V=sin (2πf M t) with an adjustable modulation frequency fM to the LED IF E96. The electronic signal is converted to an optical one and transmitted to the 3 dB coupler. The 3 dB coupler splits the signal into two equal optical signals. One signal propagates along the unstrained POF1 and the other travels along the sensingPOF2. The optical signals from the photo detectors (IF D 92) are converted into electronic voltages (V1=sin (2πf M t+φ1)) and (V 2=sin (2πf M t+φ2)) respectively using two trans impedance amplifiers. When the load applied exceeds a critical value, it leads to crack initiation and propagation across the surface of concrete close to the prenotched. The sensing POF2 elongates under stress due to the crack developed at the prenotched. Due to these factors the transit time of the light propagation is affected, resulting in the phase difference (Δφ) between the light transmitted through strained POF2 and unstrained POF1. A LAB VIEW phase detection program is used to calculate the phase difference between the two signals after data acquisition using a NI DAQ (National Instruments). Three point bend tests were carried out on concrete beams of M20 composition and of dimensions 700 mm × 150 mm × 100 mm (L × B × D) using the digitally controlled UTM of 1000 kn in the Materials Laboratory, Civil Engineering Department, NITW. A LVDT is also fitted to the concrete beam close to the prenotched for recording the CMOD data simultaneously.

Figure 5: Schematic arrangement of the TPB testing using 1000 kn digitally controlled UTM.
A cross head displacement speed of 0.005 mm/s was adopted for all experimental runs. Initially, due to slow rate of loading, no detectable phase change was observed. However, as the rate of loading with UTM was continued, the concrete beam gets strained leading to elongation of the POF. This leads to the phase difference as explained earlier.
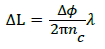
The experiment was carried out for light modulation frequencies (f M) between 50 Hz to 10 kHz. The fiber elongation (Δl) can be related to the phase difference (Δφ) using Equation (1)
 (1)
(1)
Where nc is the core index and λ is the optical wavelength. The strain of the optical fiber is then,
 (2)
(2)
Here L=gauge length of the fiber pasted across the notch of the concrete beam. If the notch width of the concrete beam is denoted as NW the value of CMOD can be calculated from equation (3)
CMOD = ϵ*NW (3)
Results
Figures 6a and 6c depict the response plot between Stroke (mm) vs. Phase (deg) vs. Load (kn) for the modulation frequencies at 250 Hz, 10 kHz respectively. Figures 6b and 6d depict the plot between cmod (mm) vs. CMOD (mm) for fM of 250 Hz, 10 kHz respectively.

Figure 6: (a) Response Plot for fM=250Hz; (b) Comparative Plot for fM=250Hz; (c) Response Plot for fM=10 KHz; (d) Comparative Plot for fM=10 KHS.
The point between which Δφ is estimated is indicated by arrows. The consolidated results obtained at all frequencies of modulation tested are presented in (Table 3).
| Frequency(Hz) | Phase Shift Measured (degrees) | CMOD(mm) using LVDT | CMOD(mm)using POF Sensor | Difference (mm) |
|---|---|---|---|---|
| 250 | 23 | 0.6 | 0.3 | 0.3 |
| 500 | 42 | 0.6 | 0.4 | 0.2 |
| 750 | 45 | 0.6 | 0.5 | 0.1 |
| 1000 | 50 | 0.6 | 0.7 | 0.1 |
| 10000 | 200 | 2.3 | 2 | 0.3 |
Table 3: Consolidated Results at all tested Modulation frequencies.
Conclusions
(a) The magnitude of phase change is below 90 degrees for the range of modulation frequencies tested except for the frequency of modulation of 10 kHz, (b) It is observed to increase, as the value of f M increases, (c )The transition of the phase becomes steeper as f M increases, (d) The agreement between the CMOD values estimated using the phase measurement technique agree well with the LVDT data as the f M increases, (e) The features of the phase response beyond the peak load tend to be more clearer at lower frequencies (250 Hz) and get smeared towards high frequencies.
CMOD Estimation Using a FBG Sensor
Principle of the fiber Bragg grating (FBG)
The FBG consists of periodic changes of the refractive index that is formed in the core of a single mode optical fiber from exposure to an intense UV interference pattern. The working principle of the FBG is illustrated in Figure 7 below.

Figure 7: The working principle of the Fiber Brag grating (FBG)[17]
When light from a broad band optical source is coupled into the FBG, this grating structure results in the reflection of light at a specific narrow band wavelength [16]. The center wavelength of this narrow light spectrum is referred to as Bragg wavelength λB. Thus the Bragg grating is transparent for the incident light at wavelengths other than the Bragg wavelength where phase matching of the incident and reflected beams occur.
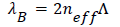
The Bragg condition for the wavelength of reflected light is expressed as
 (4)
(4)
Where λB is the Bragg wavelength of FBG, neff is the effective index of the fiber core, and Λ is the grating period.
The refractive index of the fiber core is affected by mechanical and thermal changes. As observed in Eq. (4) above, the reflected wavelength satisfying the Bragg condition is dependent on the effective core refractive index and grating period.
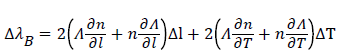
This implies that the changes in the strain and temperature will affect the refractive index of the core and the grating period if the fiber is compressed/stretched or exposed to temperature variations. Accordingly the wavelength shift from its central value due to changes in strain and temperature is given by the Eq. (5) below [16,17].
 (5)
(5)
The first term in the equation above represents the strain effect term while the second represents the temperature effect on the Bragg wavelength shift The temperature effects are generally negligible, if the experiment is conducted at room/constant temperature It can be observed that this corresponds to a change in the grating spacing and the strain-optic induced change in the refractive index.
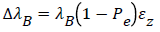
The linear relation between shift in wavelength and strain can be expressed as
 (6)
(6)
Where Pe is the effective strain-optic constant and εZ is the applied strain. The effective strain optic coefficient is given by Equation (7) below as:
 (7)
(7)
In the above υ, is the Poisson’s ratio, p11 and p12 are components of the strain-optic tensor, n is the refractive index of the core. For a typical optical fiber, the values of P11=0.113, P12=0.252, υ = 0.16, and n = 1.0.482 [16].
Using these parameters and the above equations, the expected strain sensitivity at 1550 nm is found to be 1.2 pm/μƐ [17-19]. Under an applied load, this wavelength shifts linearly with strain due to change in the period of the grating unit. By measuring the shift in the wavelength, the strain due to the applied stress can be measured accurately Therefore, the strain in the present study is calculated by using the Equation (6). If the notch width used in the concrete specimens is indicated as NW, the CMOD (in mms) can be evaluated from Equation (8) below
CMOD=strain*NW (8)
For the concrete beams used in our experiments a notch width of 4mms was adopted.
Measurement system
In the present case, the FBGs used were (fabricated by phase mask technique with central wavelength of 1551.732 nm (spacing of 10 mm, length of 3 mm) provided by Indian Institute of Technology, Chennai.
The surface of the concrete beam was scrubbed with a grit size paper no 900. A thin steel plate of thickness 0.5 mm was attached using cyano acrylate adhesive across the notch of the concrete beam. The FBG is then glued to the steel plate exactly at the place of the notch. This is shown in the photograph Figure 7 below.
The mounting is carried out carefully to ensure that the center point of the FBG coincides with the center point of the prenotched of the concrete beam (of notch width 4 mm) (Figure 7). The schematic of the experimental arrangement for the determination of CMOD using FBG as sensor is shown in Figure 8.

Figure 8: Photograph showing the FBG mounted across the prenotch.
The Port 1 of the three port fiber optic circulator (Thor Labs bearing model No 6015–3-FC) has been used to couple the light from the broad band light source to the FBG which is connected to the Port 2. The reflected Bragg wavelength peak from the FBG is routed to the Interrogator (JPFBG-3000) via Port 3 of the circulator. The signal from the interrogator is finally fed to the data acquisition card in the lap-top Figure 9. A LVDT is also fitted to the concrete beam close to the prenotched for recording the CMOD data simultaneously [20].

Figure 9: Schematic of the experimental arrangement.
Discussion
A slow rate of loading 0.005 mm/s was applied to the concrete beams in all the experimental runs. The response of the FBG sensor was obtained in terms of wavelength shift with load using the data acquisition system (Figure 15). Initially there is no observable shift of wavelength of FBG. However, when the applied load approaches the point of peak stress, the rate of shift in the Bragg wavelength is seen to increase and continues beyond the point of peak stress. This is attributed to the initiation of cracking in the concrete beam, at the peak stress followed by crack propagation. The applied stress on the FBG in the direction of the fiber axis results in the extension of its physical dimensions and in the change of effective period of the FBG viz . Λ. The effective period of the grating Λ increases with crack initiation and propagation beyond peak stress point. The shift in the Bragg wavelength increases till the unloading point. These features can be clearly understood from the experimental data plot of Figure 10.

Figure 10: The plot of stroke vs. Load for FBG1.
From the knowledge of the acquired wavelength shift after the peak stress the corresponding strain developed was calculated (in to micro strain) by using Equation (6). The variation of CMOD (mms) estimated from Equation (8) and plotted as a function of stroke (mm) with increasing load (in kn) is shown in Figure 11.

Figure 11: The plot of stroke vs. Load /CMOD of FBG1.
From this plot it can be inferred that the crack mouth opening displacement (CMOD) increases rather slowly till the peak stress. Beyond the peak stress the value of CMOD increases at a faster rate due to the opening of the crack in the concrete beam at the prenotch region. The nature of the results was repeated with all FBG sensors tested.
From this plot it can be inferred that the crack mouth opening displacement (CMOD) increases rather slowly till the peak stress. Beyond the peak stress the value of CMOD increases at a faster rate due to the opening of the crack in the concrete beam at the prenotch region. The nature of the results was repeated with all FBG sensors tested.
The nature of linear variation between the shift in the Bragg wavelength and the estimated crack mouth opening displacement (CMOD) is plotted in Figure 12 below. From Equation (4) it is observed that the Bragg wavelength is directly related to the effective grating period Λ. As the load is applied starting from the minimum value there is an increase in the strain experienced by the FBG. This leads to the increase of effective grating period Λ and hence the increases in Bragg wavelength shift. The strain thus measured is used to estimate the CMOD from Equation (8). Thus this plot serves as validity for the theory outlined previously.

Figure 12: Plot showing the Bragg wavelength shift vs. CMOD (mm).
The CMOD obtained from the FBG sensor was also compared with the CMOD acquired by using an LVDT which was fitted to the concrete beam close to the prenotch. The nature of agreement obtained is shown in Figure 13. The FBG sensor exhibits better sensitivity than the LVDT on strain softening side beyond the peak stress.

Figure 13: Comparison of CMOD with LVDT data.
From this plot it can be inferred that the crack mouth opening displacement (CMOD) increases rather slowly till the peak stress. Beyond the peak stress the value of CMOD increases at a faster rate due to the opening of the crack in the concrete beam at the prenotch region. The nature of the results was repeated with all FBG sensors tested .The repeatability of the measured CMOD has also been found to be very good even when the FBG is changed as depicted in Figure 14. This was always true with all FBGs tested. Further the average value of CMOD measured at peak stress is 0.005 mm.

Figure 14: Plot showing the repeatability of the data obtained using different FBGs.

Figure 15: Photograph of the data acquisition.
Overall Conclusions
The (table 4) given below presents the estimated CMOD value using three methods adopted [20].
| S.NO | Technique | CMOD value Range |
|---|---|---|
| 1 | POF Intensity based Technique | Around 0.3 mm(300 micromts) |
| 2 | Phase Difference Measurement Technique | 0.3 mm to 2 mm Depending on frequency of Modulation |
| 3 | FBG based sensor Technique | 0.002 to 0.004 mm(2 micrometers) |
Table 4: Results of CMOD estimated using POF and FBG based sensors.
In the case of POF sensors the radiation power loss due to evanescent modes depends on the discontinuity in the core/cladding interface, the fiber dimensions and also the angle of launching the light into the core. In evanescent field sensors the removal of the cladding layer and exposing of the core is a commonly adopted technique. This process serves to increase the loss in the propagating modes when the fiber is bent.
Due to reasons of low cost, simple and effective approach of monitoring, POF based sensor methods may be prefered where high resolution and precision are not the main deciding factors.
The problem of (a) intensity variation caused due to macro bending effect along the fiber and (b) any other disturbance not connected with the quantity under measurement may also lead to variation in resolution. However these problems are readily overcome by (a) taking care in the positioning of the fiber and (b) adopting self-referencing methods such as path difference sensing [21,22]. The finding of our research has revealed an overall agreement between the data obtained with LVDT and the Phase difference measurement technique using the POF.
The resolution of the FBG based sensor is far superior as it is dependent on the value of the grating element. The agreement between the data obtained with the FBG sensor and LVDT is also found to be good. The resolution of FBG sensors was found to better than LVDT on the beyond the peak value.
Hence it can be concluded that the choice of approach in CMOD estimation is dependent on the accuracy needed and the consequent complexity of the instrumentation to be adopted.
References
- López-Higuera M, RodrÃguez L, Quintela A, Cobo A (2010) “Currents and Trends on Fiber Sensing Technologies for SHMâ€: The 2nd Mediterraenean Photonics Conference.
- Chong KP, Carino NJ, Washer G (2003) “Health monitoring of civil infrastructuresâ€. Smart Mater. Struct 12: 483–493.
- Shah PS, Swartz SE, Quyang C (1995) "Fracture Mechanics of Concrete : Applications of Fracture Mechanics to concrete, rock and other quasi-brittle materials" Wiley.
- P. Kumar, K. Prashant (2009) "Elements of Engineering Fracture Mechanics ". Tata McGraw Hill.
- Verma SK, Bhadauria SS, Akhtar S (2013) “Review of Nondestructive Testing Methods for Condition Monitoring of Concrete Structuresâ€. Journal of Construction Engineering 1-11.
- TengFei B, JiaLin W, Yuan Y (2010) “A fiber optic sensor for detecting and monitoring cracks in concrete structuresâ€. Science China Technological Sciences 53: 3045-3050.
- Merzbacher CI, Kersey AD, Friebele EF (1996) “Fiber optic sensors in concrete structures: A reviewâ€. SmartMater. Struct. 5: 196–208.
- Mousumi M, Tarun Kumar Gangopadhyay TK, Chakraborty AK, Dasgupta k, Bhattacharya DK (2008) “Fibre Bragg gratings in structural health monitoring-Present status and applicationsâ€. Sensors and Actuators A: Physical 147: 150–164.
- Zhou G, Sim LM (2002) “Damage detection and assessment in fibre-reinforced composite structures with embedded fiber optic sensors-reviewâ€. Smart Mater. Struct 5: 925–940.
- Kuang KSC, Akmaluddin, Cantwell WJ, Thomas C (2003) “Crack detection and vertical deflection monitoring in concrete beams using plastic optical fibre sensorsâ€. Measurement Science and Technology 14: 205–216.
- Shah SG, Kishen JMC (2010) “Determination of fracture parameters of concrete interfaces using DIC. 1208-1215.
- Alam SY, Lenormand T, Loukili A, Regoin JP (2010) "Measuring crack width and spacing in reinforced concrete members ". 377-382.
- Sahay P, Kaya M, Wang C (2012) "Fiber Loop Ringdown Sensor for Potential Real-Time Monitoring of Cracks in Concrete Structures: An Exploratory Study ". Sensors 13: 39-57.
- Samrajyam K, Sobha B, Rao TDG (2011) "A POF Based Local (Point) Sensor For Crack Opening Studies :Application In Concrete". i-manager's Journal on Civil Engineering 1: 38-43.
- Durana G, Kirchoff M, Luber M, Sáez de Ocáriz I, Zubia J, et al. (2009) “Use of a Novel Fiber Optical Strain Sensor for Monitoring the Vertical Deflection of an Aircraft Flapâ€, IEEE Sensors Jou 9: 1219-1225.
- Antunes PFC, Lima HFT, Alberto NL ( 2009) “Optical fiber accelerometer system for structural dynamic monitoringâ€. Sensors J. IEEE 9: 1347-1354.
- Othonos A, Kali K (1999) “Fiber Bragg gratings: fundamentals and applications in telecommunications and Sensingâ€. Artech House.
- Cusano A. Cutolo A, Giordano M (2008) “Fiber Bragg Gratings Evanescent Wave Sensors: A View Back and Recent Advancementsâ€. Sensors: 113-115.
- Othonos A (1997) "Fiber Brag Gratings". Rev. Sci. Instrum. 68: 4309-4341.
- Samrajyam K, Sai Prasad RLN, Rao TDG, B. Sobha (2015) "Fiber Bragg Grating (FBG) sensor for estimation of Crack Mouth Opening Displacement (CMOD) in concreteâ€, J Opt 44: 346–352.
- Samrajyam K, Sobha B, Rao TDG, Sai Prasad RLN (2014) " Plastic OpticFiber (POF) based Phase Difference Measurement Method for estimation of crack mouth opening displacement (CMOD) in concreteâ€. i-manager’s Journal on Civil Engineering.
- Bilro L, Alberto N, Pinto JL, Nogueira R, Optical Sensors Based on Plastic Fiber. Sensors 12: 12184-12207.
Citation: Sobha B, Samrajyam K, Sai Prasad RLN, Rao GTD (2018) Estimation of Crack Mouth Opening Displacement in Concrete Using Optical Fiber Sensors. Optom Open Access 3: 126. DOI: 10.4172/2476-2075.1000126
Copyright: © 2018 Sobha B, et al. This is an open-access article distributed under the terms of the Creative Commons Attribution License, which permits unrestricted use, distribution, and reproduction in any medium, provided the original author and source are credited.
Select your language of interest to view the total content in your interested language
Share This Article
Recommended Journals
Open Access Journals
Article Tools
Article Usage
- Total views: 7102
- [From(publication date): 0-2018 - Dec 08, 2025]
- Breakdown by view type
- HTML page views: 6047
- PDF downloads: 1055