Estimation of Future Water Requirement for Plantain (Musa spp.) in Ondo State, Nigeria using Statistically-Downscaled Climate Variables
Received: 05-Aug-2018 / Accepted Date: 28-Nov-2018 / Published Date: 30-Nov-2018 DOI: 10.4172/2157-7617.1000499
Abstract
This study aims to determine the effects of potential climate change on crop water requirements (CWR) of plantain (Musa spp.) in three agro-ecological zones over Ondo State. Climate change scenario-Representative Concentration Pathways (RCP 4.5) derived from statistical downscaling of six global circulation model (GCM) outputs were applied as inputs to CROPWAT model. Statistically-downscaled climate parameters outputs were used as inputs to the CROPWAT to estimate irrigation water requirements (IWR) and CWR of plantain. Canadian Centre of Climate Model and Analysis (CCCMA) model predicted greatest annual maximum temperature (Tmax) increases of 1.3°C to 1.9°C and 0.8°C to 1.5°C at Ondo North and South Agro-Ecological Zones (ONAEZ and OSAEZ) for periods 2050s and 2080s respectively. The outputs of the simulation for Max Planck’s Institute of Meteorology (MPI) model at OSAEZ indicate highest minimum temperature changes of 2.5°C to 3.2°C for periods 2050s and 2080s. Changes in estimated monthly precipitation indicate reductions for most of the models, with the highest decreases in month of January with -95.8% and -96.8.6% for the future periods of 2050s and 2080s using CCCMA. Lowest decreases of -20.0% and -53.8% were predicted by Irish Centre for High End Computing (ICHEC) in ONAEZ. During the wet season (April to September), all the climate models indicated increase in monthly precipitation except CCCMA and MPI which estimated modest decrease of -18.4% and -19.4% in the months of June and July for period 2050s in OCAEZ. The outputs of CROPWAT model to estimate CWR and IWR showed that CCCMA consistently predicts seasonal highest increases of 26.7% (1085.4 mm) and 28.0% (1102.6 mm) for the periods of 2050s and 2080s in comparison to crop water requirement (CWR) of 879.9 mm in ONAEZ. This trend is similar to the predicted changes in CWR obtained in AEZ and OSAEZ respectively. Again, CCCMA model projected highest irrigation water requirements of 451.6 mm and 469.3 mm; 493.8 mm and 500.8 mm for Ondo Centre Agro-Ecological Zone (OCAEZ) and OSAEZ. These results correspond to IWR increase of 19.6% to 36.1% in ONAEZ, 20.3% to 39.9% in OCAEZ and 25.3% to 42.1% in OSAEZ for periods of 2050s and 2080s relative to the current period of 1975-2005. In conclusion, future CWR and IWR of plantain are likely to increase based on projected climate for the periods 2050s and 2080s in Ondo State.
Keywords: Climate change; General circulation models; Climate change scenario; Crop water requirements; Statistically-downscaling; CROPWAT; Plantain
Introduction
The three agro-ecological zones (AEZs) of Ondo State are very suitable for plantain (Musa spp.) production. Plantain is being grown on estimated total 11,450 hectares of cultivated land area and average yield of 8.5 ton/hectare as per ODSMA in 2007. However, plantain requires an annual effective rainfall between 1650 mm-1700 mm. Due to this high water requirement, substantial irrigation need will be important for maximum plantain production. In addition, climate change is also affecting regional water resource availability and variability, and thus influencing the demands for water by various sectors, including irrigation water for agricultural use [1,2].
The global warming trend, which is mainly caused by the increasing amount of greenhouse, will continue [3,4]. However, rising air temperature is a major drive for reference evapotranspiration (ETo). The main impacts of climate change are expected in terms of ETo because it represents the climate demand of the atmosphere [5,6]. Crop water requirement (CWR) is the product of reference evapotranspiration and crop factor at different stages of plant growth and development. Increases in ETo and some other meteorological variables influence CWR. Projecting future plantain irrigation requirement across the (AEZs) requires stepwise estimation of crop water requirement for determining accurate supplementary water application.
Statistical Downscaling Model (SDSM) was used in this study to project future climate (minimum temperature, maximum temperature, precipitation) using six general circulation models (GCMs) under newly released set of emission scenario known as Representative Concentration Pathways [7]. Selecting SDSM over dynamic downscaling model is because it is cheap to apply and provide site-specific climate information [8]. Uncertainty and biases in GCMs outputs are considered by using multiple climate models [9].
The objective of the study is to estimate the effects of climate change scenario on plantain water requirement using an ensemble set of six GCMs under RCP 4.5 for the future periods 2035-2065 (2050s) and 2070-2100 (2080s) relative to baseline to baseline period 1975- 2005. CROPWAT irrigation software (version 8.1) was chosen based on its better performance in estimating reference evapotranspiration (ETo) and crop water requirement (CWR) over other crop models. The expected outputs of the study will be used to address the future plantain irrigation water needs and useful water conservation measures.
Methods
Study area
The study was conducted on the plantain grown regions of eighteen Local Government Areas of Ondo State. The State is divided into three agro-ecological zones namely; Ondo-North Agro-Ecological Zone (ONAEZ), Ondo South Agro-Ecological Zone (OSAEZ) and Ondo Central Agro-Ecological Zone (OCAEZ) respectively. Each of the Agro-Ecological Zones comprises six local government areas (LGAs) as indicated in Table 1. The meteorological station records the daily maximum temperature, minimum temperature, and accumulated precipitation. The summary of the climatic datasets location and coordinate are depicted in Table 2 and Figures 1a and 1b. Weather stations containing 31-year baseline-control period across the regions in Table 2 were the sources of climatic variables used for running the simulations.

Figure 1: a) Meteorological station in Ondo-State. b) Map of Ondo State showing all LGAs.
| S/N | OSAEZ | OCAEZ | ONAEZ |
|---|---|---|---|
| 1 | Odigbo | Akure South | Akoko N.W |
| 2 | Okitipupa | Akure North | Akoko N.E |
| 3 | Irele | Ileoluji/Okeigbo | Akoko S.W |
| 4 | Ilaje | Ifedore | Akoko S.E |
| 5 | Ese-Odo | Ondo-East | Owo |
Table 1: Categorization of agro-ecological zone in Ondo-State.
| S/N | LGA | Location | Station ID | Long | Lat (Degree) | Elevation (m) | Record |
|---|---|---|---|---|---|---|---|
| (degree) | |||||||
| 1 | Akoko N.W | Okeagbe | 203K | 5.76 | 7.67 | 508.1 | 1975-2005 |
| 2 | Akoko N.E | Ikare | 205R | 5.4 | 7.31 | 462.2 | 1975-2005 |
| 3 | Akoko S.W | Iwaro | 303W | 5.45 | 7.24 | 373.1 | 1975-2005 |
| 4 | Akoko S.E | Isua | 305U | 4.98 | 6.99 | 252.6 | 1975-2005 |
| 5 | Owo | Owo Poly | 288P | 5.59 | 7.23 | 305.3 | 1975-2005 |
| 6 | Ose | Ifon | 306F | 5.58 | 7.18 | 288.7 | 1975-2005 |
| 7 | Akure South | Akure | 310A | 5.19 | 7.25 | 396.9 | 1975-2005 |
| 8 | Akure North | Itaogbolu | 315T | 5.15 | 7.15 | 327.2 | 1975-2005 |
| 9 | Idanre | Idanre | 318D | 5.52 | 9.81 | 335.4 | 1975-2005 |
| 10 | Ifedore | Igbara-Oke | 294E | 5.64 | 7.35 | 330.3 | 1975-2005 |
| 11 | Ondo-East | Borunduro | 297B | 5.02 | 7.27 | 252.8 | 1975-2005 |
| 12 | Ileoluji/Okeigbo | Ileoluji | 320J | 5.05 | 7.1 | 315.9 | 1975-2005 |
| 13 | Ondo-West | Ondo town | 322N | 4.51 | 7.61 | 266.9 | 1975-2005 |
| 14 | Odigbo | Ore | 315O | 4.52 | 6.47 | 100.5 | 1975-2005 |
| 15 | Okitipupa | Okitipupa | 317I | 4.35 | 6.25 | 92.7 | 1975-2005 |
| 16 | Irele | Irele | 323L | 4.97 | 6.62 | 161.6 | 1975-2005 |
| 17 | Ilaje | Igbakoda | 329G | 6.32 | 4.72 | 49.8 | 1975-2005 |
| 18 | Ese-Odo | Igbekebo | 330G | 4.28 | 5.1 | 61.7 | 1975-2005 |
Table 2: Meteorological stations with approximate coordinates.
Statistical downscaling model
Assessing climate change in the study areas, eighteen meteorological stations were identified (Table 2 and Figure 1). These stations had a reliable set of current daily climate data from 1975-2005. However, using a statistical downscaling model (SDSM), 31-year historical dataset from these stations (local scale) were reproduced from six GCMs and calibrated to evaluate the sensitivity of each of the GCMs. The procedures used for SDSM are summarized as verification of missing data to control the quality of the collected historical climate data; configuration of the model, using predictor variables from the GCMs and from the reanalysis data from the selected meteorological station (SDSM) and generation of future climate data based on various climate change scenarios obtained from GCMs [10]. The outputs of statisticallydownscaled climate variables derived by the GCMs were used as input to the CROPWAT model to compute future ETo, CRW, and IWR for the periods the 2050s and 2080s respectively. The effects of climate change were evaluated by comparing the outputs of projected future water balance parameters to the baseline estimated values. Table 3 depicts the selected general circulation models, their spatial resolutions and representative concentration pathways for this research study.
| Models | Emission scenarios | Spatial resolution |
|---|---|---|
| CCCMA | RCP 4.5 | 48 × 96 cells, 3.75° × 3.75° |
| MPI | RCP 4.5 | 96 × 192 cells, 1.9° × 1.9° |
| MOHC | RCP 4.5 | 88 × 176 cells, 2.0° × 2.0° |
| MIROC | RCP 4.5 | 67 × 134 cells, 1.12° × 1.12° |
| CNRM | RCP 4.5 | 64 × 128 cells, 2.8° × 2.8° |
| ICHEC | RCP 4.5 | 60 × 120 cells, 2.9° × 2.9° |
Table 3: GCMs downscaled for the research study.
CROPWAT Irrigation model
CROPWAT Irrigation model (Version 8.1) was used to estimate reference (ETo), crop water requirement (CWR) and irrigation water needs (IWR) under baseline (1975-2005) and future periods (2035- 2065) and (2070-2100) respectively. The CROPWAT model, developed by FAO, is an irrigation management model to evaluate crop water requirements and irrigation needs [11]. This model was chosen since it has been widely used worldwide [12]. The algorithm for calculation of crop water requirements (CWR) and irrigation needs of CROPWAT were based on estimation of potential evapotranspiration (ETo), using the Penman-Montieth equation [12], and crop parameters. CROPWAT model also requires the coordinates (latitude and longitude) of the location area, the outputs from the model were expressed in mm/ day. Crop water requirement (CWR) for plantain was predicted using CROPWAT software as:
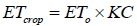 (1)
(1)
Where:
ETcrop=Crop evapotranspiration in mm/day
KC=Crop coefficient
ETo=Reference evapotranspiration in mm/day.
The model uses in-built Pen-Monteith method to compute reference evapotranspiration (ETo) as follows:
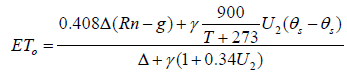 (2)
(2)
Where, ETo=Reference evapotranspiration (mm/day);
Rn =Net radiation at the crop surface (MJ/m2/day);
G=Soil heat flux density (MJ/m2/day);
T=Mean daily air temperature at 2 m height (°C);
u2 =Wind speed at 2 m height (m/s);
es= Saturation vapor pressure (kPa/°C);
ea=Actual vapor pressure (kPa/°C);
es–ea=Saturation vapor pressure deficit (kPa);
Δ = Slope of vapor pressure curve (kPa/ °C) and
γ =Psychrometric constant (kPa/°C).
Results and Discussion
Temperature projections
Overall trends of statistical downscaling outputs of eighteen weather stations for projecting maximum (Tmax) and minimum (Tmin) temperatures were obtained from selected six general circulation models (GCMs). Temperature estimated by the GCMs indicates an increase in minimum and maximum temperature for most of the months up to the end of 21th century (2100). The GCMs outputs showed that CCCMA predicted the highest annual maximum temperature of 340°C and 370°C for 2035-2065 and 2070-2100 relative to the current maximum temperature of 31.5°C for OCAEZ. The least annual Tmax values of 31.8°C and 35.10°C were projected by ICHEC at the Ondo Central Agro- Ecological Zone (Tables 4-6 and Figures 2-9). Maximum temperature estimated by MIROC and CCCMA models is 33.3°C and 34°C for OSAEZ and 33.6°C and 34.1°C for ONAEZ for two future time slices of 2050s and 2080s. Projected minimum temperature showed similar trend for selected Agro-Ecological Zones with CCCMA and MIROC models having the highest predictions (Tables 4-6 and Figures 2-9). The results of the projection showed very good agreement with some climate change studies [4,13,14].

Figure 2: Projected average annual (Tmax) for six GCMs-RCP 4.5 over OCAEZ for periods 2035-2065 and 2070-2100 relative to 1975-2005.

Figure 3: Estimated changes in monthly rainfall for six GCMs-RCP 4.5 over ONAEZ for period 2035-2065 relative to 1975-2005.

Figure 4: Projected average annual (Tmin) for six GCMs-RCP 4.5 over OSAEZ periods 2035-2065 and 2070-2100 relative to 1975-2005.

Figure 5: Projected average annual (Tmax) for six GCMs-RCP 4.5 over OSAEZ periods 2035-2065 and 2070-2100 relative to 1975-2005.

Figure 6: Estimated changes in monthly rainfall for six GCMs-RCP 4.5 over ONAEZ for period 2070-2100 relative to 1975-2005.

Figure 7: Projected average annual (Tmin) for six GCMs-RCP 4.5 over OCAEZ for periods 2035-2065 and 2070-2100 relative to 1975-2005.

Figure 8: Estimated changes in precipitation for six GCMs-RCP 4.5 over OCAEZ for time period 2035- 2065 relative to 1975-2005.

Figure 9: Estimated changes in precipitation for six GCMs-RCP 4.5 over OCAEZ for time period 2070-2100 relative to 1975-2005.
| Models | OSAEZ | OSAEZ | |||
|---|---|---|---|---|---|
| Tmax (2035-2065) | Tmax (2070-2100) | Models | Tmin (2035-2065) | Tmin (2070-2100) | |
| ICHEC | 31 | 31.5 | ICHEC | 22.7 | 23.4 |
| MPI | 32.3 | 32.7 | MPI | 24 | 24.3 |
| MOHC | 33.3 | 33.1 | MOHC | 24.4 | 25.1 |
| CCCMA | 32.2 | 33.7 | CCCMA | 26.3 | 26.5 |
| MIROC | 33.3 | 34 | MIROC | 24.6 | 24 |
| CNRM | 32.3 | 33 | CNRM | 22.6 | 23.4 |
Table 4: Projected annual temperature in Ondo-state relative to 1975-2005.
| Models | ONAEZ | ONAEZ | |||
|---|---|---|---|---|---|
| Tmax (2035-2065) | Tmax (2070-2100) | Models | Tmin (2035-2065) | Tmin (2070-2100) | |
| ICHEC | 31.3 | 32.1 | ICHEC | 22.1 | 22 |
| MPI | 32.6 | 33.3 | MPI | 22.8 | 22.8 |
| MOHC | 34.1 | 34.1 | MOHC | 23.3 | 23.3 |
| CCCMA | 33.6 | 34.1 | CCCMA | 22.9 | 23.1 |
| MIROC | 32.5 | 33.4 | MIROC | 23.7 | 23.9 |
| CNRM | 32.8 | 33.4 | CNRM | 21.1 | 21.9 |
Table 5: Projected annual temperature in Ondo-state relative to 1975-2005.
Estimated average Tmax and Tmin for the three agro-ecological zones (ONAEZ, OCAEZ, OSAEZ) reflected Ondo Central Agro-Ecological Zone (OCAEZ) as the warmest region with increases in maximum temperature of 1.5°C (4.8%) to 4.5°C (14.6%) for the two future time slices of 2035-2065 and 2070-2100 compared to the baseline time period of 1975-2005 (Table 6). This observation is similar to the reported study by Olujumoke et al. All the GCMs showed the same trend in the two remaining agro-ecological zones (OSAEZ and ONAEZ). Predicted changes in annual maximum temperature for short-term (2035-2065) and long term (2070-2100) of 1.3°C (4.1%); 1.9°C (6.0%) for ONAEZ and 0.8°C (3%); 1.5°C (4.8%) for OSAEZ were estimated (Table 7). Predicted increases in Tmax and Tmin for the studied agro-ecological zones may likely lead to increase in reference evapotranspiration (ETo) and gradual reduction of soil moisture. Simulated GCMs climate variables were run with CROPWAT software to generate reference evapotranspiration (ETo), crop water requirement (CWR) and irrigation water requirement (IWR).
| Models | OCAEZ | OCAEZ | |||
|---|---|---|---|---|---|
| Tmax (2035-2065) | Tmax (2070-2100) | Models | Tmin (2035-2065) | Tmin (2070-2100) | |
| ICHEC | 31.8 | 35.1 | ICHEC | 21.4 | 22.2 |
| MPI | 33.1 | 36 | MPI | 22.4 | 23 |
| MOHC | 33.2 | 35.9 | MOHC | 22.8 | 23.8 |
| CCCMA | 34 | 37.1 | CCCMA | 24.1 | 24.4 |
| MIROC | 33.1 | 36.8 | MIROC | 23.2 | 23.8 |
| CNRM | 32.9 | 35.5 | CNRM | 21.1 | 22.1 |
Table 6: Projected annual temperature in Ondo-state relative to 1975-2005.
| Climate Variables | OSAEZ | ONAEZ | OCAEZ | |||
| 2035-2065 | 2070-2100 | 2035-2065 | 2070-2100 | 2035-2065 | 2070-2100 | |
| Maximum temperature (°C, %) | (0.8) (3.0) | (1.5) (4.8) | (1.3) (4.1) | (1.9) (6.0) | (1.5) (4.8) | (2.5) (14.6) |
| Minimum temperature (°C, %) | (4.1) (20.5) | (4.4) (22.0) | (2.6) (13.0) | (2.8) (14.0) | (2.5) (12.5) | (3.2) (16.0) |
Table 7: Estimated annual changes in temperature in Ondo-State relative to 1975-2005.
Precipitation projections
The rainfall largely contributes to satisfy the crop water requirement of plantain (Musa spp.) depending on seasonality. The results from six GCMs indicate various degrees of variability in projected future precipitation in all the three Agro-Ecological Zones in Ondo-State. These inconsistencies are explained partly by the inability of GCMs to reproduce the mechanisms responsible for precipitation including, for example, the hydrological cycle [13,15]. Changes in monthly estimated precipitation indicate reductions for most of the models, with the highest decreases in month of January with of -95.8% and -96.8.6% for the future periods of 2050s and 2080s using CCCMA (Figures 8 and 9). However, least decreases of -20.0% and -53.8% were estimated from ICHEC in February for near (2050s) and long (2080s) terms under RCP 4.5 scenario. Climate models such as MPI, MOHC and CCCMA indicate decreasing trends in precipitation with higher reduction in 2080s in Ondo North Agro-Ecological Zone (Figures 9 and 10). In midterm (2050s), annual mean precipitation will likely increase by 27.2% in 2050s and decrease by 28.1% in 2080s relative to current period of 1975- 2005. Again, for the precipitation, MIROC model had annual increase of 49.7% and 26.1% for the periods 2050s and 2080s when compared to baseline period (Figure 11) as also reported by Jones and Thornton [16]. This probable signifies extreme precipitation events with high rainfall intensity and increase number of raining days in period 2050s in the ONAEZ region over most of the mid-latitude land masses.

Figure 10: Projected annual rainfall for six GCMs-RCP 4.5 for period 2035-2065 and 2070-2100 relative to 1975-2005 over OSAEZ.

Figure 11: Annual mean reference evapotranspiration (ETo) under 1975-2005 baseline climate and future periods of 2050s and 2080 in OCAEZ.
Annual mean precipitation estimated from the selected GCMs for periods 2050s and 2080s in Ondo-Central Agro-Ecological Zone (OCAEZ) indicates very similar pattern with the projections in ONAEZ. All the climate models indicate reduction in precipitation from the onset of dry season (October) to the peak periods in January and February for 2050s and 2080s respectively in OCAEZ (Figures 12 and 13). However, Model for Interdisciplinary Research on Climate (MIROC) indicated increases of 55.2% and 26.7% in January for the periods 2050s and 2080 (Figures 12 and 13). During the wet season (April to September), all the climate models indicated increase in monthly precipitation except CCCMA and MPI which estimated modest decrease of -18.4% and -19.4% in the months of June and July for period 2050s. Highest increases were observed in the months of May and August for the two time slices in Ondo Central Agro- Ecological Zone (Figures 12 and 13). Increasing trends of estimated precipitation by the selected climate models except MPI revealed that larger precipitation event is likely to be experienced in 2080 than 2050s in comparison with the baseline period in Ondo South Agro- Ecological Zone (OSAEZ) as shown in Figure 14. This phenomenon is different from the outputs of the rainfall projections in Ondo North Agro-Ecological Zone (ONAEZ) and Ondo Central Agro-Ecological Zone (ONAEZ) which predicted larger precipitation for the short term period of 2050s. Meterology Office of Hadley (MOHC) estimated the highest increase of 2261.9 mm and 2277.7 mm for period 2050s and 2080s, while least increases of 1239.3 mm and 1326.7 mm were predicted using CCCMA model (Figure 14). The work from McKendry et al. [17] showed results similar to the results obtained in this study.

Figure 12: Annual mean reference evapotranspiration (ETo) under 1975-2005 baseline climate and future periods of 2050s and 2080 in OSAEZ.

Figure 13: Annual mean reference evapotranspiration (ETo) under 1975-2005 baseline climate and future periods of 2050s and 2080s in ONAEZ.

Figure 14: Annual crop (plantain) water req. (CWR) under 1975-2005 baseline climate and future periods of 2050s and 2080s in OCAEZ.
Reference evapotranspiration predictions
Projected future reference evapotranspiration (ETo) for plantain (Musa spp.) was estimated for the three agro-ecological zones (OSAEZ, OCAEZ and ONAEZ) in Ondo State. The simulation outputs for all the selected GCMs indicated that highest ETo was estimated in the month of March in all the zones, whereas lowest ETo values were obtained in September for periods 2050s and 2080s respectively. Reference evapotranspiration increased from October through March which represents dry season and decreased from April to October and this period is categorized as wet season for shortand long term periods. (Figures 15 and 16) depicts projected reference evapotranspiration (ETo) for periods 2050s and 2080s under RCP 4.5 climate scenario compared to the baseline period (1975-2005). Overall simulation of ETo showed that ICHEC model had increases of 9.0% (1258.6 mm) and 11.2% (1275.1 mm) for periods 2050s and 2080s relative to the control-period of 1975-2005 in ONAEZ. However, among the six constructed future scenarios, CCCMA predicted highest ETo of 7.1% (1336.7 mm) and 8.2% (1350.2 mm) in OCAEZ, 16.6% (1331.5 mm) and 17.8% (1343.0 mm) in OSAEZ respectively (Figure 15). Based on high predictive reference evapotranspiration (ETo) for 2050s and 2080s, plantain (Musa spp.) water requirements may likely be higher and this will result to increase in irrigation demands across all the agroecological zones. The results of ETo obtained in this work shown good agreement with previous studies [18-20].

Figure 15: Annual crop (plantain) water req. (CWR) under 1975-2005 baseline climate and future periods of 2050s and 2080s in ONAEZ.

Figure 16: Annual crop (plantain) water req. (CWR) under 1975-2005 baseline climate and future periods of 2050s and 2080s in OSAEZ.
Crop water requirements (CWR) and irrigation needs (IWR) projections
Downscaled climatic variables from general circulation models derived with representative concentration pathways (RCP 4.5) were run with CROPWAT model to estimate crop (plantain) water requirement (CWR) and irrigation water demands (IWR) in the study regions. Crop water requirement (CWR) is the product of reference evapotranspiration (ETo) and crop coefficient (Kc) at different growth stages. Estimated ETo values obtained in ONAEZ, OSAEZ and OCAEZ were run with crop and water model to compute plantain water requirements for the periods 2050s and 2080s. Predicted monthly plantain (Musa spp.) water requirements showed increasing trends across the three agro-ecological zones. Based on the GCMs outputs, higher CWR was estimated from the month of September through December in all the three agro-ecological zones. However, ICHEC, MPI and CNRM models estimated lower CWR in ONAEZ and OCAEZ respectively. It is observed that all the GCMs projected increase in CWR compared to baseline for two future periods with CCCMA model predicting greatest increase in OSAEZ), OCAEZ, whereas MOHC predicted highest CWR values in ONAEZ. This observation was similar to the works of Maurer and Sezen et al. [21,22]. Overall outputs from selected general circulation models show that CCCMA consistently predicts annual highest increases of 26.7% (1085.4 mm) and 28.0% (1102.6 mm) for the periods of 2050s and 2080s in comparison to crop water requirement (CWR) of 879.9 mm in ONAEZ (Tables 8-10). Again the model predicts large changes in the months of September (15.6 mm and 20.4 mm), October (66.1 mm and 68.1 mm), November (62.2 mm and 64.6 mm) and December (55.5 mm and 57.6 mm) for the periods 2050s and 2080s relative to the current period of 1975-2005 in ONAEZ. This period could be considered as onset of dry season with decrease precipitation, available moisture content and increase in irrigation water requirement across the agroecological zones. This trend is similar to the predicted changes in crop water requirement obtained in OCAEZ and OSAEZ respectively. In Ondo South Agro-Ecological Zone (OSAEZ), it is observed that there is strong concentration of irrigation water demand from November through February, except CCCMA model which estimated 31.9 mm (319.0 m3/ha) and 33.5 mm (335.0 m3/ha) in the month of March for periods 2050s and 2080s. CCCMA and MIROC models predicted more seasonal water requirement of 493.8 mm; 503.2 mm and 305.8 mm; 385.4 mm for periods 2050s and 2080s in ONAEZ respectively (Table 11). In addition, Centre of Canadian Climate Model & Analysis projected highest irrigation water demand of 451.6 mm and 469.3 mm; 493.8 mm and 500.8 mm for OCAEZ and OSAEZ. CNRM models yielded lowest IWR in ONAEZ, OSAEZ and OCAEZ for the periods 2050s and 2080s (Figures 17a-17c). These results correspond to irrigation water demand increase of 4.9% to 26.1% in ONAEZ, 4.3% to 8.2% in OCAEZ and 6.7% to 11.8% in OSAEZ for periods of 2050s and 2080s relative to the current period of 1975-2005. This result also shows that all the selected general circulation models driven with friendly climate scenario (RCP 4.5) for future time periods 2050s and 2080s slightly underestimated plantain irrigation requirements during the wet season. The outputs from all the climate models predicted no supplementary water application needed from the month of March through September in all the three agroecological zones. However some level of irrigation water may still be needed during this period (wet season) to meet up with the required plantain water requirement. Overall sensitivity analysis for projected future irrigation water requirement (IWR) indicates that more water will be required to supplement projected decrease in future rainfall for periods 2050s and 2080s in three agro-ecological zones.

Figure 17: a) Estimated annual irrigation water requirement (IWR) under 1975-2005, Baseline climate and future period of 2050s and 2080s in OSAEZ.
b and c) Estimated annual irrigation water requirement (IWR) under 1975-2005, Baseline and future period of 2050s and 2080s in ONAEZ.
| Models | ET0 (mm/Year) | CWR (mm/Year) | IWR (mm/Year) | |||
|---|---|---|---|---|---|---|
| 2035-2065 | 2070-2100 | 2035-2065 | 2070-2100 | 2035-2065 | 2070-2100 | |
| ICHEC | 1258.6 | 1275.1 | 1042.0 | 1055.4 | 255.4 | 269.5 |
| MPI | 1282.6 | 2196.7 | 1069.7 | 1083.7 | 234.4 | 281.5 |
| MOHC | 1315.4 | 1331.9 | 1096.1 | 1154.8 | 289.4 | 314.8 |
| CCCMA | 1303.0 | 1320.2 | 1085.4 | 1102.6 | 493.8 | 502.3 |
| MIROC | 1294.2 | 1309.0 | 1079.3 | 1091.9 | 305.8 | 385.4 |
| CNRM | 1231.1 | 1282.6 | 1039.6 | 1055.2 | 281.1 | 306.9 |
Table 8: CROPWAT simulated variables (ETo, CWR, IWR) for future periods using six GCMs-RCP 4.5 in ONAEZ.
| Models | ET0 (mm/Year) | CWR (mm/Year) | IWR (mm/Year) | |||
|---|---|---|---|---|---|---|
| 2035-2065 | 2070-2100 | 2035-2065 | 2070-2100 | 2035-2065 | 2070-2100 | |
| ICHEC | 1263.8 | 1284.7 | 1106.4 | 1128.3 | 279.6 | 294.5 |
| MPI | 1288.8 | 1311.7 | 1109.3 | 1117.6 | 302.0 | 320.0 |
| MOHC | 1304.5 | 1329.8 | 1096.1 | 1116.6 | 304.8 | 332.8 |
| CCCMA | 1336.7 | 1350.2 | 1096.1 | 1120.4 | 451.6 | 469.3 |
| MIROC | 1307.0 | 1307.2 | 1091.4 | 1104.9 | 281.2 | 302.8 |
| CNRM | 1285.6 | 1302.1 | 1062.3 | 1076.2 | 210.8 | 242.9 |
Table 9: CROPWAT simulated variables (ETo, CWR, IWR) for future periods using six GCMs-RCP 4.5 in OCAEZ.
| Models | ETo (mm/Year) | CWR (mm/Year) | IWR (mm/Year) | |||
|---|---|---|---|---|---|---|
| 2035-2065 | 2070-2100 | 2035-2065 | 2070-2100 | 2035-2065 | 2070-2100 | |
| ICHEC | 1248.8 | 1264.3 | 1088.7 | 1101.3 | 265.4 | 295.4 |
| MPI | 1282.4 | 1294.7 | 1117.5 | 1129.0 | 251.6 | 262.5 |
| MOHC | 1298.3 | 1313.2 | 1082.1 | 1102.9 | 275.5 | 289.8 |
| CCCMA | 1331.5 | 1343.0 | 1111.4 | 1129.9 | 493.8 | 500.8 |
| MIROC | 1292.1 | 1315.5 | 1079.7 | 1098.5 | 293.7 | 381.3 |
| CNRM | 1269.4 | 1289.1 | 1104.9 | 1122.0 | 258.9 | 278.1 |
Table 10: CROPWAT simulated variables (ETo, CWR, IWR) for future periods using six GCMs-RCP 4.5 in OSAEZ.
| Month | Baseline | ICHEC | MPI | MOHC | CCCMA | MIROC | CNRM | ||||||
|---|---|---|---|---|---|---|---|---|---|---|---|---|---|
| 1975-2005 | 2035-2065 | 2070-2100 | 2035-2065 | 2070-2100 | 2035-2065 | 2070-2100 | 2035-2065 | 2070-2100 | 2035-2065 | 2070-2100 | 2035-2065 | 2070-2100 | |
| January | 42.5 | 53.3 | 54.3 | 60.8 | 46.1 | 61.7 | 62.0 | 68.5 | 68.8 | 49.3 | 63.2 | 60.5 | 54.3 |
| February | 24.4 | 27.3 | 44.1 | 30.8 | 49.8 | 27.8 | 33.4 | 38.9 | 39.8 | 26.7 | 29.3 | 26.1 | 34.2 |
| March | 0.0 | 0.0 | 0.0 | 0.0 | 0.0 | 0.0 | 0.0 | 31.9 | 33.5 | 0.0 | 0.0 | 0.0 | 0.0 |
| April | 0.0 | 0.0 | 0.0 | 0.0 | 0.0 | 0.0 | 0.0 | 0.0 | 0.0 | 0.0 | 0.0 | 0.0 | 0.0 |
| May | 0.0 | 0.0 | 0.0 | 0.0 | 0.0 | 0.0 | 0.0 | 0.0 | 0.0 | 0.0 | 0.0 | 0.0 | 0.0 |
| June | 0.0 | 0.0 | 0.0 | 0.0 | 0.0 | 0.0 | 0.0 | 0.0 | 0.0 | 0.0 | 0.0 | 0.0 | 0.0 |
| July | 0.0 | 0.0 | 0.0 | 0.0 | 0.0 | 0.0 | 0.0 | 0.0 | 0.0 | 0.0 | 0.0 | 0.0 | 0.0 |
| August | 0.0 | 0.0 | 0.0 | 0.0 | 0.0 | 0.0 | 0.0 | 0.0 | 0.0 | 0.0 | 0.0 | 0.0 | 0.0 |
| September | 0.0 | 0.0 | 0.0 | 0.0 | 0.0 | 0.0 | 0.0 | 0.0 | 0.0 | 0.0 | 0.0 | 0.0 | 0.0 |
| October | 0.0 | 34.4 | 39.5 | 5.0 | 5.6 | 4.6 | 6.2 | 113.2 | 114.7 | 22.1 | 56.4 | 16.1 | 19.2 |
| November | 10.8 | 91.2 | 95.2 | 91.8 | 93.1 | 64.8 | 67.8 | 116.1 | 117.9 | 84.9 | 106.5 | 93.3 | 100.2 |
| December | 57.0 | 59.2 | 62.3 | 63.2 | 67.9 | 116.6 | 120.4 | 125.2 | 126.2 | 110.7 | 125.9 | 62.9 | 70.2 |
Table 11: Estimated monthly irrigation water req (IWR) under baseline and projected future periods from six GCMs-RCP 4.5 in OSAEZ.
Conclusion
The study investigated possible implications of climate change on plantain (crop) water requirement (CWR) and irrigation water needs (IWR) in three agro-ecological zones of Ondo State, Nigeria. Statistically-downscaled climate (minimum temperature, maximum temperature and precipitation) from global to local scales using six general circulation models (GCMs) under representative concentration pathways (RCP 4.5) were applied to run CROPWAT model in computing future CWR, IWR and reference evapotranspiration (ETo). CCCMA predicted the highest annual maximum temperature of 340°C and 370°C for 2035-2065 and 2070-2100 relative to the current maximum temperature of 31.5°C for OCAEZ and 33.6°C and 34.1°C for ONAEZ whereas MIROC projected highest Tmax of 33.3°C and 34°C for OSAEZ. Generally, estimated average Tmax and Tmin for the three agro-ecological zones (ONAEZ, OCAEZ, OSAEZ) reflected Ondo Central Agro-Ecological Zone (OCAEZ) as the warmest region with increases in maximum temperature of 1.5°C (4.8%) to 4.5°C (14.6%) for the two future time slices of 2035-2065 and 2070-2100 compared to the baseline time period of 1975-2005. Predicted increases in Tmax and Tmin for the studied agro-ecological zones are the major factors responsible for projected increases in reference evapotranspiration (ETo) in the studied regions.
The study also indicated that overall simulation of ETo for ICHEC model had increases of 9.0% (1258.6 mm) and 11.2% (1275.1 mm) for periods 2050s and 2080s relative to the control-period of 1975-2005 in ONAEZ with CCCMA predicted highest ETo of 7.1% (1336.7 mm) and 8.2% (1350.2 mm) in OCAEZ, 16.6% (1331.5 mm) and 17.8% (1343.0 mm) in OSAEZ respectively. Crop water requirements (CWR) were predicted by CCCMA model to increase from 1085.4 mm to 1102.6 mm and these increases are in the range of 26.7%-28.0% for the future periods 2050s and 2080s relative to the baseline 1975-2005 in ONAEZ. The increase in CWR was likely due to the increase in minimum and maximum temperatures and reference evapotranspiration (ETo). This trend is similar to the predicted changes in crop water requirement obtained in OCAEZ and OSAEZ respectively.
However, plantain irrigation water requirements were more, despite increases in precipitation compared to the control period in the entire studied region. Centre of Canadian Climate Model and Analysis projected highest irrigation water demand of 451.6 mm and 469.3 mm; 493.8 mm and 500.8 mm for OCAEZ and OSAEZ. Overall, the sensitivity analysis using statistically-downscaled climate data of GCMs run with CROPWAT model indicated increases in plantain water requirements (CWR) and irrigation water needs (IWR).
References
- Turner DW, Thomas DS (2009) Measurements of plant and soil water status and their association with leaf gas exchange in banana (Musa spp): A laticiferous plant. Sci. Hort 77: 177-193.
- Robinson JC (2008) Systems of cultivation and management. In: Gowen S (ed), Bananas and Plantains, Chapman and Hall, London, UK. pp: 15-65.
- IPCC (2014) Impacts, adaptation, and vulnerability. Part A: Global and Sectoral Aspects. In Contribution of Working Group II to the Fifth Assessment Report of the Intergovernmental Panel on Climate Change; Field CB, Barros VR Eds: Cambridge University Press: New York, NY, USA. pp: 1-32.
- McCarthy JJ, Canziani OF, Leary NA, Dokken DJ, White KS (2011) Climate Change 2007: Impacts, Adaptation, and Vulnerability’, Contribution of Working Group II to the Fourth Assessment Report of the Intergovernmental Panel on Climate Change. Cambridge: Cambridge University Press, USA.
- Soden BJ, Held IM (2013) An assessment of climate feedbacks in coupled ocean–atmosphere models. J Climate 19: 3350-3369.
- Tabari H, Somee BS, Zadeh MR (2011) Testing for long-term trends in climatic variables in Iran. Atmos. Res 100: 132-140.
- van Vuuren DP (2011) The representative concentration pathways: An overview. Climatic Change 109: 5-31.
- Wilby RL, Dawson CW (2014) The statistical downscaling model: Insights from one decade of application. Int J Climatol 33: 1710–1713.
- Â Semenov MA, Stratonovitch P (2010) Use of multi-model ensembles from global climate: Models for assessment of climate change impacts. Climate Research 41: 1-14.
- ODSMA (2007) Categorization of agro-ecological zones in Ondo State. Bulletin 6: 76-100.
- Clarke D, Smith M, El-Askari K (1998) New software for crop water requirements and irrigation scheduling. Irrig Drain 47: 45-58.
- Â Â FAO (1998) Crop evapotranspiration -Guidelines for Computing Crop Water Requirements - FAO Irrigation and Drainage Paper 56: 142-150.
- Osborn TJ, Briffa KR, Tett SFB, Jones PD, Trigo RM (2014) Evaluation of the North Atlantic Oscillation as simulated by a coupled climate model. Clim Dyn 15: 690-700.
- Rosenzweig C, Neofotis P (2013) Detection and Attribution of anthropogenic climate change impacts. WIREs Clim Change 4: 121-150.
- Shahid S (2011) Trends in extreme rainfall events of Bangladesh. Theor Appl Climatol 104: 489-499.
- Jones PG, Thornton PK (2013) The potential impacts of climate change on maize production in Africa and Latin America in 2055. Adv Glob Change Res 13: 51-59.
- McKendry IG, Stahl K, Moore RD (2011) Synoptic sea-level pressure patterns generated by a general circulation model: Comparison with the types derived from NCEP/NCAR re-analysis and implications for downscaling. Int J Climatol 26: 1727-1736.
- Â Stricevic R, Cosic M, Djurovic N, Pejic B, Maksimovic L (2011) Assessment of the FAO AquaCrop model in the simulation of rainfed and supplemental irrigated maize, sugar beet and sunflower. Agricultural Water Management 98: 1610-1615.
- Â Singh B (2012) The implications of climate change for natural resources in Quebec. Climate change digest CCD 88-08. Atmospheric Environment Service, Downsview, Toronto 28: 80-83.
- Motiee H, McBean E (2009) An assessment of long-term trends in hydrologic components and implications for water levels in lake superior. Hydrology Research 40: 564-579.
- Maurer EP, Stewart IT, Bonfils C, Duffy PB, Cayan D (2007) Detection, attribution, and sensitivity of trends toward earlier stream flow in the Sierra Nevada J Geophys Res 112: 300-310.
- Sezen SM, Yazar A, Kapur B, Tekin S (2011) Comparison of drip and sprinkler irrigation strategies on sunflower seed and oil yield and quality under Mediterranean climatic conditions. Agr Water Manage 98: 1140-1150.
Citation: Yahaya O, Olufayo AA, Oguntunde PG, Atanda EO (2018) Estimation of Future Water Requirement for Plantain (Musa spp.) in Ondo State, Nigeria using Statistically-Downscaled Climate Variables. J Earth Sci Clim Change 9: 499. DOI: 10.4172/2157-7617.1000499
Copyright: © 2018 Yahaya O, et al. This is an open-access article distributed under the terms of the Creative Commons Attribution License, which permits unrestricted use, distribution, and reproduction in any medium, provided the original author and source are credited.
Select your language of interest to view the total content in your interested language
Share This Article
Recommended Journals
Open Access Journals
Article Tools
Article Usage
- Total views: 4937
- [From(publication date): 0-2018 - Dec 20, 2025]
- Breakdown by view type
- HTML page views: 3987
- PDF downloads: 950