Evaluation of Meteorological Drought in North Central Nigeria Using Standardized Precipitation Index
Received: 01-Jul-2022 / Manuscript No. jescc-22-70270 / Editor assigned: 04-Jul-2022 / PreQC No. jescc-22-70270 (PQ) / Reviewed: 18-Jul-2022 / QC No. jescc-22-70270 / Revised: 21-Jul-2022 / Manuscript No. jescc-22-70270 (R) / Accepted Date: 21-Jul-2022 / Published Date: 28-Jul-2022
Abstract
Evaluation of drought risk in North Central Nigeria was carried out in this study using Standardized Precipitation Index (SPI). Analysis of rainfall variability was carried out using ANOVA from rainfall data collected from the Nigerian Meteorological Agency (NIMET), Abuja for all the six states that constitute the study area. In a bid to evaluate the risk of drought in each of the meteorological stations, the rainfall data was used to compute SPI 12-month time scale which is ideal for meteorological drought in all the stations. The SPI results were further subjected to Mann-Kendal and Sen’s slope analysis for trends detection. The SPI model was effective in evaluating the risk of meteorological drought as the values were from near normal to severe droughts in plateau and Niger states. The paper concluded that seasonal and annual rainfall variation account for the vulnerability of the region to the risk of meteorological drought. The study recommends SPI weather base index insurance, development of early warning, implementation of long-term adaptation strategies and increase drought awareness among others as part of mitigation strategies against its impact on water resources and the rainfall dependent agriculture in the region.
Keywords: Drought; Rainfall; Evaluation; Standardized Precipitation Index (SPI); Mann kendall; Sen’s slope
Introduction
Drought; Rainfall; Evaluation; Standardized Precipitation Index (SPI); Mann kendall; Sen’s slope
Introduction
Drought remains one of the major hydro climatological disasters affecting humanity (Wilhite, 2005). Drought is also an insidious natural hazard that results from a deficiency in rainfall. It has been recognised as the costliest and most complex but least understood of all natural hazards. Its occurrence can persist for seasons, months and even years (WMO, 2006).
Globally, drought affects millions of people in each year of its occurrence and its more pronounced in climatic vulnerable regions [1]. Available records of natural hazards occurrence reveal that more than 50% of all deaths associated with natural hazards are drought related and only flood rank higher in terms of casualties (UNISR, 2009). Drought also accounts for 8% of natural disasters globally. It is the greatest natural hazard confronting Africa accounting for 25% of all natural disasters in the continent. In addition, between1960–2006, Africa has the highest ranking in terms of drought frequency with a total of 382 drought events affecting 326 million people [2].
In Northern Nigeria, drought has been a regular event occurring both in high and low rainfall areas. Since the widespread, popular and devastating Sahelian drought of 70s, drought occurrence has increased in many parts of Northern Nigeria (Oyebande, 1990). The increase has been attributed to steady decline in annual rainfall in the region since the end of the 1960s [3]. The frequency of drought and dry spells in Northern Nigeria has increased in recent times due to climate change which is fast exacerbating drought intensity on a global scale. Thus, the exposure of any region to drought and other extreme climatic hazards is clearly premise on the degree of exposures, sensitivities and adaptive capacities of the system. It is against this background that this research is been undertaken to evaluate the risk of meteorological drought in north central Nigeria using the standardized precipitation index.
Conceptually, the World Meteorological organization recognises three types of droughts namely meteorological, agricultural, hydrological and socio-economic. Meteorological drought which is the focus of this paper deals with below normal precipitation experienced in a particular locality. Meteorological drought is region specific due to variability in atmospheric conditions while Agricultural drought on the other hand, is concern with rainfall deficits and shortage in soil- water requirements. Agricultural drought creates soil moisture deficiency which affects crop produce. Hydrological drought on the other hand, is associated with periods of precipitation (including snowfall) shortfall on surface or subsurface water supply (i.e., stream flow, reservoir and lake levels, groundwater). The frequency and severity of hydrological drought is often defined on a watershed or river basin scale and finally Socio-economic drought occurs when water shortage starts to affect people, individually and collectively or, in more abstract terms, most socio-economic definitions of drought are associated with the supply and demand of an economic good. Drought is basically as a result of variability in the climate system and large-scale ocean-atmospheric interactions. The relationship between the climate system and the various types of drought is represented by the diagram below in Figure 1.

Figure 1: Relationship between Climate Variability, Meteorological, Hydrological and Agricultural drought. Source: (US National Drought Mitigation Centre 2012).
The variation in climate system manifests in two events first; precipitation deficiency in amount, intensity and timing and secondly high temperatures, high sunshine and less cloud cover which may trigger drought of various types and impact. SPI has been widely used in Nigeria in evaluation of drought trend and generation of drought risk maps for the purpose of classification of drought prone areas into vulnerability and occurrence zones. A good example is the study conducted by Adefisan ana Abatan (2015) where the rainfall characteristics such as the onset, cessation, amount and other factors with drought-proneness index were used to classify the entire Nigeria into various agro-climatic zones. Also carried out a recent study on drought monitoring and its effects on vegetation in Sokoto state. They employed SPI, statistical and geo spatial techniques in their assessment. Findings revealed that the SPI values vary significantly from extremely dry condition to wet condition.
Fabeku and Okogbue [4], in an attempt to unravel the impact of drought on Vegetation, undertook another study on trends in vegetation response to drought in the Sudano-Sahelian part of Nigeria. Like previous studies, the authors used SPI, GIS, and remote sensed imageries as part of the assessment and methodologies. The study outcome indicated the effectiveness of the models in detecting several areas that were under the influence of drought [5], examined drought trend in Kano state using SPI of 3-,6-,9- and 12- months’ time scales and Mann- Mann Kendall test of 100 years rainfall data. The study outcome revealed an increasing drought trend due to erratic rainfall.
To further underscore the relevance of SPI as meteorological drought detection index, Okpara, et al (2022), carried out an investigation of spatiotemporal characteristics of drought using 52 years of rainfall data and 3 months SPI time scale in the River Niger Basin. Findings from the study indicated that the River Niger is vulnerable to drought of severe to moderate intensities in the headwaters of the Basin. Mohamed and Abdullahi (2015), in a study of trend analysis of drought during growing season in Nigeria used SPI and Standardized Precipitation Evaporation Index (SPEI) in assessment of the impact of drought during the growing season in the study area. Summary result of the study revealed an increase in the areal extends of drought during some of the cropping season.
Study Area
North Central Nigeria lies approximately between 30 and 140E and latitude 70 and 100N. The region is made up of six states namely Benue, Kwara, Niger, Plateau, Nassarawa, Kogi and Abuja (the Federal Capital Territory) as shown in Figure 2 below. The relief of the lower Benue basin which this study falls comprise of two distinctive relief regions. The upper part is located in the northwest axis and is an extension of the steep scarp of the Jos Plateau. The study area has an excellent network of drainage network. This extensive drainage forms tributaries that flow from the Benue River and River Niger. At Lokoja, the River Niger and the Benue meet giving rise to Kogi as a confluence state [6-7]. The climate of the region is partly influenced by climates in the northern and southern region of Nigeria. The study area is within the Guinea savannah vegetation belt. The soils of North Central Nigeria are generally characterized by a sandy surface horizon overlying a weakly structured clay accumulation.

Figure 2: Map of Nigeria with North Central (shaded) showing study area.
Methodology
Monthly rainfall data of 56 years (1960-2017) was collected from the Nigerian Meteorological Agency (NIMET) for seven stations namely Kogi, Kwara, Plateau, Niger, Benue, Nasarawa states and the federal capital territory Abuja and analyzed for spatial variability for each of the seven stations using Analysis of variance (ANOVA).
Mathematically, ANOVA is stated as follows:
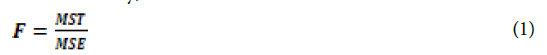
Where:
F= Anova Coefficient;
MST= Mean of Squares due to Treatment; and
MSE= Mean of Squares due to Error.
Standardized Precipitation Index (SPI)
Evaluation of drought risk was carried out using SPI. The model which is globally recognized in measuring drought intensity was developed by [8] and used observed precipitation as primary variable in computing drought with secondary contributions from surface air temperature, soil moisture content and evaporation especially when dealing with meteorological drought.
The Standardized Precipitation Index is given as follows:
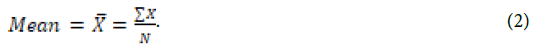
Where N is the number of precipitation observations:
X is the precipitation amount; and
![]() is the mean of the precipitation for the period of observation.
is the mean of the precipitation for the period of observation.
Interpreted as a standardized (or Z) score with a mean of zero and standard deviation of 1.0.
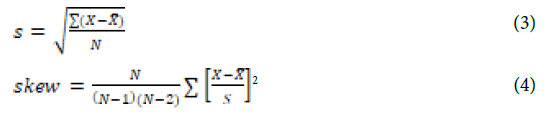
The precipitation data are transformed by the log normal (ln) and the mean of those values is computed. Those transformed values are further described by the constant U, shape and scale parameters.
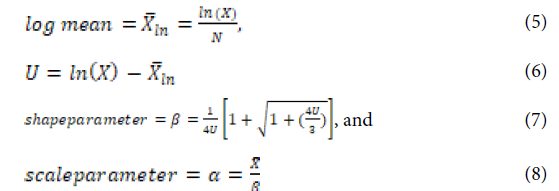
The resulting parameters are then used to find the cumulative probability of an observed precipitation event for the given month and time scale for the station in concern,
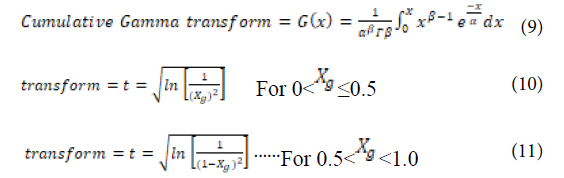
The Gamma transformed values are again transformed, with different formulae for SPI as shown below,
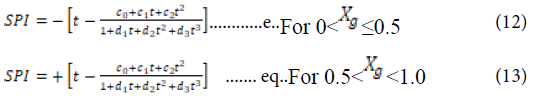
Where: C0 = 2.515517; c1 = 0.802853; c2 = 0.010328; d1 = 1.432788; d2 = 0.189269; d3 = 0.001308.
Where Xij is the rainfall for the ith station and jth observation ![]() is the mean rainfall for the ithstation andσi is the standard deviation for the ith station.
is the mean rainfall for the ithstation andσi is the standard deviation for the ith station.

>
The SPI drought categorization as shown in Table 1 was used to evaluate possible drought occurrence in each of the stations. SPI values can be positive or negative. All negative SPI values will be taken to indicate drought occurrence, while all positive values show no drought.

Table 1: Categorization and Associated Color of SPI for different categories. Source: MCKee et al: (1993).
The 12-month SPI is associated with precipitation deficits, streamflows and reservoir levels. Increasing trend of SPI implies increasing drought condition and vice versa.
Mann Kendall and Sen’s Slope Estimator
Mann-Kendall test is a statistical test widely used for the analysis of trend in climatological and hydrological fields [9-11]. The Mann Kendall was hereby employed to evaluate the trend and pattern of drought in the present study.
The Mann-Kendall test statistics is computed with the equation below:
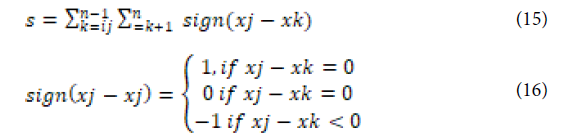
Where n = number of days; X = date point at times j; and j, k and j<k
The variance of S[VAR(S)] is calculated as

Where p = number of the tied groups and t is the number of date values in the 9th group.
The test statistic Z is computed as follows using the values of S and VAR (s)
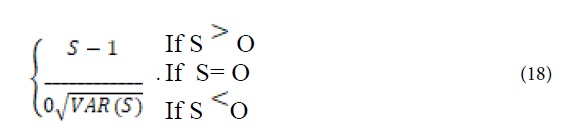
The Z value is used to evaluate the presence of a statistically significant trend in which a positive value of Z indicates upward trend, and a negative value denotes a downward trend.
Sen’s Slope Estimator
The Sen’s slope estimator uses a simple non-parametric procedure developed by Sen (1968) for trend analysis of hydro-climatic data. To obtain the estimate of the slope Q, the slope Qi of all data pairs are calculated as follows:
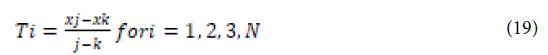
Where xj and xk are thought to be data values at times j and k
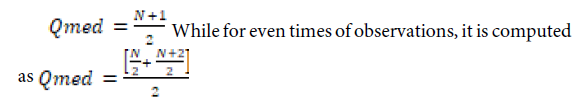
The median of the N values of Qi corresponds to Sen’s estimator of slope and is computed by
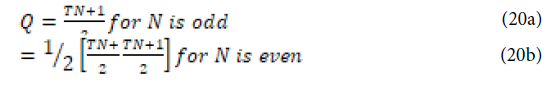
When the N slope observations are shown as odd, the Sen’s estimator is computed as
The two–sided test is carried out at  of confidence interval to obtain the time slope for non-parametric test in the series. The positive or negative slope Q is obtained as upward (increasingly or downward decreasing trend).
Data Presentation and Analysis
The results of the analysis presented in Table 2 reveals the existence of high temporal variability of rainfall the period of 56years (1960 – 2017). There is evidenced from the table of statistically significant difference in annual rainfall amount in the study area between 1960 – 2017 since between groups variation is greater than within group variation. The F calculated value of 5.839 is statistically significant (P < 0.05) at 95% confidence level. This implies further that there is significant difference in rainfall regions among 6 other locations except Abuja. To determine where the difference lies, the Duncan post hoc test in Table 3 was used.
| Sum of Squares | Df | Mean Square | F | Sig. | |
|---|---|---|---|---|---|
| Between Groups | 409841.699 | 6 | 68306.950 | 5.839 | .000 |
| Within Groups | 5.000E7 | 4688 | 11698.639 | ||
| Total | 5.041E7 | 4704 | |||
Table 2: ANOVA results showing temporal Variation of Rainfall.
| Indicators | N | Subset for alpha = 0.05 | ||
|---|---|---|---|---|
| 1 | 2 | 3 | ||
| Abuja | 684 | 94.8565 | ||
| Lafia | 684 | 100.4253 | ||
| Ilorin | 684 | 100.7753 | ||
| Lokoja | 684 | 101.0670 | ||
| Markurdi | 684 | 3387 | ||
| Minna | 684 | 102.9477 | ||
| Jos | 684 | 106.7314 | ||
| Sig. | 1.000 | .874 | .890 | |
| Means for groups in homogeneous subsets are | displayed | |||
| a. Uses Harmonic Mean Sample Size = 684. | ||||
Table 3: Duncan statistics variation in rainfall.
Duncan post hoc test shown in Table 3 showed the level of variation within the stations. The result reveals that Abuja was distinct from the other states in terms of difference in her mean value of 94.8565 which implying statistical variation in rainfall characteristics in Abuja from the other states in the study area. Similarly, the Mann kendall test was used to detect if there is increasing or decreasing drought trend while the Sen’s slope was applied to determine the magnitude of the trend in all the stations. The details of the results are presented below in Table 4.
The results of the Mann Kendall analysis shown in Table 4 indicate negative Z values for Makurdi, Ilorin, Minna and Jos. The implication of this result reveals that the aforementioned stations experienced drought of SPI 12-months’ time scales and increasing or upward trend of drought. This Sen’s slope values highlight the magnitude of change in the drought trend. The magnitude of change was highest in Jos, followed by Markurdi and Ilorin respectively. Although, the Z score for Abuja and Lafia were positive, it was generally significant at 0.5 and 0.01 confidence level. This could impact negatively on water resources and the rainfall dependent agriculture activities (Figure 3) [12].

Figure 3: Time series of 12-month time scale over Markurdi.
| Station | Mann Kendall (Z) values | Sen slope estimate (Q) values |
|---|---|---|
| Makurdi | -1.01 | -0.008 |
| Ilorin | -0.22 | -0.002 |
| Lokoja | 0.33 | 0.002 |
| Minna | -0.01 | 0.000 |
| Jos | -1.70+ | -0.013 |
| Abuja | 2.08* | 0.037 |
| Lafia | 2.75** | 0.171 |
Table 4: Mann Kendall and Sen’s Slope Statistics for SPI 12 Months Scale.
** if trend at α = 0.01 level of significance
* if trend at α = 0.05 level of significance
+ if trend at α = 0.1 level of significance
The results of analysis of the 12 months SPI time scale in Figure 2 reveals that 1986, 1970, 1974, 1982, 1986, 1994, 2002 and 2008. As was observed in the 6-month analysis, 2002 recorded extreme drought going by the SPI value -2.0.
The implication of this composite analysis is that Makurdi was affected by meteorological drought of different intensities. This is another evidence of decreasing and erratic rainfall and decrease stream flow since the 12-months SPI represents meteorological and annual drought regimes in Figure 4.
Detail analysis of the 12-month SPI time scale over Ilorin shown in Figure 3 is quite revealing. It follows the same pattern of both wet and dry years in Makurdi meteorological station and confirm the following years; 1960, 1966, 1970, 1976, 1988, 1992, 1996, 2010 and 2012 as periods of severe drought while year 2000 represents extreme drought as reveal in the SPI value of -2 (Figure 5).
An evaluation of the 12-month SPI time series for the station as shown in Figure 4 which indicates that different intensities of drought have been experienced over the past decades in the station. While 1972 and 1976 has SPI values of 1.0 – 1.49, indicative of moderate drought, Severe drought was experienced in 1980, 1984 as shown by the negative SPI value of 1.5.
The time series analysis also reveals that the station experience below rainfall between 1972, 1974 and between 1980 and 1984 as well as 1998, and 2004 before it peaked again 2010 (Figure 6).

Figure 4: 12-month time scale of SPI over Ilorin.

Figure 5: Times series of 12-month SPI analysis over Lokoja.

Figure 6: Times series of 12-Month time scale of SPI over Minna.
The 12-month SPI analysis reveals moderate drought was reported in 1962, 1970, 1974, 1980, 1982, 1990, 1992 and 2014 while 1974 indicates severe drought as well as 2010 and 1992. Extreme drought occurred in 1982, 1986 and 1988. It is evident from the results that SPI was successful in evaluating meteorological drought risk in the station (Figure 7).

Figure 7: Times series of 12-Month times scale of SPI over Jos.
The period from 1980 to 1992 was generally a sustained dry one. The dry spell also extended from 2004 to 2014. The implication of this analysis revealed that the station experienced decreasing rainfall trend at different times with attendant effect on agriculture, ecosystem and dislocation in socio-economic conditions (Figure 8).

Figure 8: Timescale of 12-month SPI over Lafia.
The evaluation of drought risk using SPI analysis reveals that the station was only affected by drought events of moderate category in 2001, 2004, 2007 and 2010. It was also observed that 2001 – 2004 marked a period of sustained dry spell which extended from 2007 to 2010 (Figure 9).

Figure 9: Time series of 12 -month time scale of SPI over Abuja.
Analysis of the 12month SPI for Abuja in Figure 8 reveal that moderate drought occurred in 1984, 1988, 1990, 1996, 1998 and 2012 while severe dry drought occurred between 2000, 2002 and 2008.
Conclusion
The study revealed that drought of different intensities has been experienced over the years in the North central region. The SPI analysis of all the stations in the study area also revealed a composite nature of both dry and wet years. However, there were more dry years in Plateau and Niger states. The SPI values range from near normal to severe droughts in plateau and Niger states.
The paper further confirmed that seasonal and annual rainfall variation account for the vulnerability of the region to the risk of drought. The observed variability is expected to intensify in the future given the current climate change projections.
Recommendations
The study recommends the following:
1. Development of SPI weather index based insurance (SWBI). The index plays a crucial role in helping small scale farmers cope with climate shocks in view of the sensitivity of their livelihood to climate variation.
2. Development of early warning system. Early warning system will ensure drought preparedness plans are formulated to reduce future drought risk events.
3. Implementation of long-term adaptation and adjustment strategies through community participation, civil society engagement, academia and research institutions
4. Improvement of drought awareness and knowledge management in the region should be encouraged.
References
- Achugbu IC, Anugwo SC (2016) Drought Trend analysis in Kano using standardized precipitation index. Fuoye J Pure Appl Sci 1(1):105-110.
Indexed at, Google Scholar, Crossref
- Adefolalu SO (1986) Further aspects of Sahelian drought as evident from rainfall Regime of Nigeria. Arch Met Geoph Biolcl Ser B 36:227-295.
Indexed at, Google Scholar, Crossref
- Aper JA (2006) Stream Discharge Characteristics in the Lower Benue Drainage Basin. Ph.D. Thesis Submitted to the School Of Graduate Studies. University of Nigeria Nsukka.
- Bhavnani R, Vordzorgbe S, Owor M (2008) Report on the Status of Disaster Risk Reduction in the Sub-Saharan Africa Region. Commission of the African Union.
- Binboll NL, Edicha JA (2012) Drought risk assessment in Yola, Adamawa State Nigeria. KAJONAS 2(1): 2004-2011.
- Duan JG, Nanda SK (2006) Two-dimensional depth-averaged model simulation of suspended sediment concentration distribution in a groyne field. J Hydrol 327(4):426-437.
Indexed at, Google Scholar, Crossref
- Farauta BK, Egbule CL, Idrisa YL (2011) Climate change and Adaptation Measures in Northern Nigeria: Empirical Situation and Policy Implications. ATPS.
Indexed at, Google Scholar, Crossref
- Fabeku BB, Okogbue EC (2014) Trends in Vegetation Response to Drought in Sudano- Sahelian Part of Northern Nigeria. J Atmos Sci (4):569-588.
Indexed at, Google Scholar, Crossref
- Gautam M (2006) Managing Drought in Sub-Saharan Africa; Policy Perspectives. Ag Econ Sear 9:1-18.
- Halimatou TA, Kalifa T, Baffour N (2016) Farmer’s perception on Climate variability in Cinzana, Mali. J Agric Res 4(3):13-36.
Indexed at, Google Scholar, Crossref
- Koudahe K, Kayode AJ, Samson AO (2017) Trend analysis of Standardized Precipitation Index in the context of Climate Change in Southern Togo. Clim Atmos Sci 7:401-423.
Indexed at, Google Scholar, Crossref
- Mavromatis T, Stathis D (2011) Response of the Water Balance in Greece to Temperature and Precipitation Trends. Theor Appl Climatol 104:13-24.
References
- Achugbu IC, Anugwo SC (2016) Drought Trend analysis in Kano using standardized precipitation index. Fuoye J Pure Appl Sci 1(1):105-110.
- Adefolalu SO (1986) Further aspects of Sahelian drought as evident from rainfall Regime of Nigeria. Arch Met Geoph Biolcl Ser B 36:227-295.
- Aper JA (2006) Stream Discharge Characteristics in the Lower Benue Drainage Basin. Ph.D. Thesis Submitted to the School Of Graduate Studies. University of Nigeria Nsukka.
- Bhavnani R, Vordzorgbe S, Owor M (2008) Report on the Status of Disaster Risk Reduction in the Sub-Saharan Africa Region. Commission of the African Union.
- Binboll NL, Edicha JA (2012) Drought risk assessment in Yola, Adamawa State Nigeria. KAJONAS 2(1): 2004-2011.
- Duan JG, Nanda SK (2006) Two-dimensional depth-averaged model simulation of suspended sediment concentration distribution in a groyne field. J Hydrol 327(4):426-437.
- Farauta BK, Egbule CL, Idrisa YL (2011) Climate change and Adaptation Measures in Northern Nigeria: Empirical Situation and Policy Implications. ATPS.
- Fabeku BB, Okogbue EC (2014) Trends in Vegetation Response to Drought in Sudano- Sahelian Part of Northern Nigeria. J Atmos Sci (4):569-588.
- Gautam M (2006) Managing Drought in Sub-Saharan Africa; Policy Perspectives. Ag Econ Sear 9:1-18.
- Halimatou TA, Kalifa T, Baffour N (2016) Farmer’s perception on Climate variability in Cinzana, Mali. J Agric Res 4(3):13-36.
- Koudahe K, Kayode AJ, Samson AO (2017) Trend analysis of Standardized Precipitation Index in the context of Climate Change in Southern Togo. Clim Atmos Sci 7:401-423.
- Mavromatis T, Stathis D (2011) Response of the Water Balance in Greece to Temperature and Precipitation Trends. Theor Appl Climatol 104:13-24.
Indexed at, Google Scholar, Crossref
Indexed at, Google Scholar, Crossref
Indexed at, Google Scholar, Crossref
Indexed at, Google Scholar, Crossref
Indexed at, Google Scholar, Crossref
Indexed at, Google Scholar, Crossref
Indexed at, Google Scholar, Crossref
Citation: IDEKI O, ADEFISAN EA (2022) Evaluation of Meteorology Drought in North Central Nigeria Using Standardized Precipitation Index. J Earth Sci Clim Change, 13: 632.
Copyright: © 2022 IDEKI O, et al. This is an open-access article distributed under the terms of the Creative Commons Attribution License, which permits unrestricted use, distribution, and reproduction in any medium, provided the original author and source are credited.
Select your language of interest to view the total content in your interested language
Share This Article
Recommended Journals
Open Access Journals
Article Usage
- Total views: 3224
- [From(publication date): 0-2022 - Dec 18, 2025]
- Breakdown by view type
- HTML page views: 2700
- PDF downloads: 524