Examining the Association between Physical Fitness, Spinal Flexibility, Spinal Posture and Reported Back Pain in 6 To 8 Year Old Children
Received: 22-Aug-2015 / Accepted Date: 21-Sep-2015 / Published Date: 25-Sep-2015 DOI: 10.4172/2165-7025.1000274
Keywords: Spinal posture; Physical fitness; Back pain; Maximal flexion
361046Background
Compared to a low prevalence of back pain in children (1-6%), the prevalence of adolescents back pain rises to 18-51% [1]. Numerous risk factors for back pain, such as genetic or constitutional factors, overweight, sex or physical inactivity have been reported to date [2-4]. Reduced spinal flexibility and postural insufficiency have often been associated with low back pain [5,6]. In the Swiss back pain survey from 2011, 80% of the adults reported to suffer at least once a year from back pain. 85% of the reported back pain is not caused by illness or genetic factors but insufficient physical fitness or stress [7]. In 6-9 year old Swiss children 38.4% reported back pain once a week [8]. A previous history of low back pain is often predictive of future back problems [9]. Consequently, there is a need for the early detection of risk factors for back pain.
Studies examining back pain and physical activity in children and adolescents showed particularly conflicting results. While one study showed that physical activity leads to less back pain [10], other studies could not find any association between physical activity nor physical fitness and back pain [3,11]. Also, different dimensions of physical activity may have different relationships with low back pain [12]. These relationships are dependent on individual factors such as physical fitness or health perceptions [13]. Several studies reported reduced balance performance in adults with low back pain [14]. Several randomized control trials showed that a supervised exercise program improved the average low back pain intensity compared to no treatment [1]. Still studies addressing the relationship between physical fitness, risk factors for back pain and back pain in children are, however, rare, but needed [1]. Therefore, the purpose of our study was to examine the association between physical fitness, spinal flexibility and spinal posture, as risk factors for back pain, and back pain in young children entering primary school.
Methods
Design and study population
The present study was designed as a large scale, cross-sectional trial. Participants for the main study were recruited from the Sportcheck study. Beginning in 2014, this monitoring includes obligatory assessment of physical fitness performed during physical education lessons. From the 1402 children participating in the Sportcheck study, 540 (38.6%) were allowed by their parents to join additional tests on spinal flexibility and posture. 145 children dropped out due to illness at one of the two test dates, relocation, refused to participate in one of the tests or the measurement was rated as invalid. The final analyses sample consisted of 395 children. The study was approved by the local ethics committee of the University of Basel (EKBB, Basel, approval number 258/12). Teachers and parents were a priori informed about the study context. After detailed information about the study content parents signed an informed written consent to the study.
Anthropometrics
Body height was measured without shoes to the nearest 0.2 cm using a wall-mounted stadiometer (Seca 206, Seca, Basel, Switzerland). Body weight was determined to the nearest 50 g in light clothing and without shoes using an electronic scale (Seca 899, Seca, Basel, Switzerland). BMI was calculated by dividing body weight by height in meters squared. Children were classified as either non-overweight or overweight/obese based on the International Obesity Taskforce (IOTF) reference for children [15]. Waist circumference was measured using a flexible tape at the natural waist (half way between the ribcage and the iliac crest). Skinfold thickness was measured in triplicate to the nearest 0.5 mm with Harpenden calipers (HSK-BI, British Indicators, Burgess Hill, United Kingdom). Calibrated to exert a pressure of 10 g/cm2 at two sites (triceps and subscapular) based on standard procedures. The two skinfolds were taken to calculate percent body fat [16].
Spinal flexibility and spinal posture
Spinal flexibility and spinal posture were measured with the Spinal Mouse MediMouse® (Idiag, Fehraltorf, Switzerland), a hand-held and computer-assisted electromechanical device that can be used to measure spinal curvature in various positions [17]. This Spinal Mouse was found to be reliable in children (SEM 1.21-13.18°) [18]. The device was guided slightly paravertebral of the spine or along the midline in overweight and obese children, respectively. Starting at the spinous process of the vertebrae prominens (C7) and finishing at the top of the anal crease (approximately S3) [17]. We tested in three positions: standing upright, maximal flexion and maximal extension, as described elsewhere [17]. The range of motion between flexion and extension was calculated as a measure of the spinal flexibility. Flexibility was measured for the angle of inclination of the pelvic tilt, the thoracic spine, the lumbar spine and the spinal inclination (angle subtended between the vertical axis between legs and pelvis and a line joining C7 to the pelvic tilt, Figure 1). In every position three sets of measurements were taken. The mean of the two measurements with the smallest variation was used for further analysis.
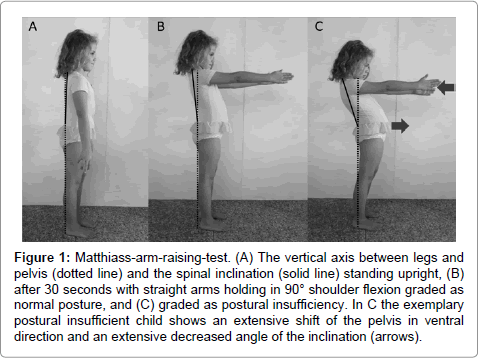
Figure 1: Matthiass-arm-raising-test. (A) The vertical axis between legs and pelvis (dotted line) and the spinal inclination (solid line) standing upright, (B) after 30 seconds with straight arms holding in 90° shoulder flexion graded as normal posture, and (C) graded as postural insufficiency. In C the exemplary postural insufficient child shows an extensive shift of the pelvis in ventral direction and an extensive decreased angle of the inclination (arrows).
The Matthiass-arm-raising test was conducted [19] to assess the capability of the children to control and maintain an upright-standing position for at least 30 seconds with straight arms holding in 90° shoulder flexion. The difference between the spinal curvature before the 30 seconds and after was calculated for the pelvic tilt, the lumbar spine and the spinal inclination. Postural insufficiency was defined as follows: A) extensive shift of the pelvic tilt in the ventral direction, B) increase of the lumbar lordosis or C) an extensively decreased spinal inclination [20] (Figure 1).
Physical fitness testing
Physical fitness testings were conducted in school. All children performed a standardized short 5-minute warm-up. The 20 m shuttle run serves as a validated test [21] to measure aerobic fitness by running forth and back for 20 m, with an initial running speed of 8.0 km/h and an increase of 0.5 km/h every minute, paced by beeps on a stereo. The maximal performance was reached when the child did not cross the 20 m line at the moment of the beep for two consecutive 20 m distances. Numbers of “stages” (1 stage≅1 minute) performed were counted with a precision of 0.5 stages [22]. With the jumping sidewards test speed and coordination was measured [23]. Children repetitively jumped, within 15 seconds, on alternating sides of a wooden strip, as many times as possible. This task had to be performed two times as fast as possible. The sum of the two trials was further analyzed. 20 m sprint times were assessed by electronic timing gates (HL2-31, Tag Heuer, La Chaux-de-Fonds, Switzerland). The test has been shown to be reliable (r=0.9) [24]. Start follows after an acoustic signal, with a precision of 1/100 second. This test had to be performed twice as fast as possible. The faster trial was included in further analysis. This coordination test includes balancing backwards on 3 m long bars with a width of 3, 4.5 and 6 cm. Starting with the 6 cm and ending with the 3.5 cm bar. The number of steps until the child’s foot touches the floor was counted. 3 trials were performed for each bar width. The sum of these 9 trials was used for statistical analysis. All tests were found to be reliable [23,25,26].
Back pain was assessed with a pain questionnaire [27], distributed at school in coded envelopes and completed by the parents interviewing their child. When back pain was reported, the frequency was asked.
Statistics
The a priori conducted power analysis provided a 95% power (1-β error) to detect medium effect sizes in a two-way analysis of variance with an alpha significance level of 5% when including a total sample size of 252 subjects. Data was tested for normal distribution and variance homogeneity. In addition to descriptive statistics, Students t-test to compare means of two groups was applied to analyze sex differences in baseline characteristics. To compare differences of the segmental flexibility of the spine and the existence of postural insufficiency, two-way analysis of covariance (sex x spine parameter) was used (confidence interval (CI): 95%), with age as a covariate. Physical fitness tests were additionally adjusted for BMI (as a covariate). The spinal flexibility was divided in three groups: low, normal and high spinal flexibility (according to the mean ± standard deviation (sd) for a low flexibility and mean + sd for a high flexibility in both sexes). The data of the Matthiass-arm-raising test were classified in two categories: postural insufficiency and normal posture (according to the mean - standard deviation in both sexes). Effect size was calculated by Cohen’s d (small effect: 0.2; medium effect: 0.5; large effect: 0.8) [28]. A multiple linear regression analysis was conducted to estimate the absolute changes in spinal flexibility for one unit change of anthropometrics or physical fitness parameters. The model was adjusted for age, sex in anthropometrics and additionally for BMI in physical fitness tests. Bonferroni post hoc testing was conducted to reveal the direction of the results. We used Stata version 12.1 (StataCorp LP, College Station, TX, USA) for our analyses.
Results
In our study population of 395 children, 11% of the children were overweight, 3.4% obese, respectively. Baseline characteristics are shown in Table 1.
| Parameter | N | Mean | SD |
| Age (y) | 395 | 7.3 | 0.4 |
| Sex | |||
| Female | 192 | ||
| Male | 203 | ||
| Height (cm) | 395 | 126.3 | 5.4 |
| Weight (kg) | 395 | 26.2 | 4.6 |
| BMI (kg/m2) | 395 | 16.3 | 2.1 |
| Overweight | 43 | ||
| Obese | 14 | ||
| Percentage body fat (%) | 395 | 16.7 | 5.1 |
| Waist circumference (cm) | 395 | 58.2 | 6.1 |
| 20 m Shuttle Run (stage) | 395 | 4.4 | 1.7 |
| Jumping sidewards (sum of jump counts) | 395 | 47.1 | 11.7 |
| 20 m Sprint (s) | 395 | 4.9 | 0.4 |
| Balancing backwards (sum of steps) | 395 | 39.2 | 13.2 |
| Migrants* | 106 |
Table 1: Baseline characteristics of the study population.
Table 2 shows the comparison of sex differences of all spinal parameters.
| Female | Male | p-value | Cohen’s d | |
| Parameter* | Mean (95% CI) | Mean (95% CI) | ||
| Pelvic tilt | ||||
| Upright position (U) | 21.1 (19.9, 22.3) | 18.1 (16.7, 19.5) | <0.01 | 0.3 |
| Flexion (F) | 53.6 (51.8, 55.5) | 52.0 (49.9, 54.2) | 0.3 | 0.1 |
| Extension (E) | -4.8 (-7.6, -1.9) | -8.3 (-10.5, -6.1) | 0.05 | 0.2 |
| Range of motion (F-U) | 32.5 (30.4, 34.6) | 34.0 (31.7, 36.2) | 0.4 | 0.09 |
| Range of motion (E-U) | -25.9 (-28.5, -23.3) | -26.4 (-28.4, -24.3) | 0.8 | 0.03 |
| Range of motion (F-E) | 58.4 (54.9, 62.0) | 60.3 (57.1, 63.5) | 0.4 | 0.08 |
| Thoracic Spine | ||||
| Upright position (U) | 33.4 (32.1, 34.7) | 35.8 (34.6, 37.0) | <0.01 | 0.3 |
| Flexion (F) | 56.6 (55.6, 57.6) | 56.8 (55.8, 57.7) | 0.8 | 0.02 |
| Extension (E) | 38.5 (36.4, 40.6) | 39.2 (37.3, 41.1) | 0.6 | 0.05 |
| Range of motion (F-U) | 23.2 (21.8, 24.6) | 21 (19.7, 22.6) | 0.02 | 0.2 |
| Range of motion (E-U) | 5.1 (3.0, 7.2) | 3.5 (1.6, 5.4) | 0.3 | 0.1 |
| Range of motion (F-E) | 18.1 (16.0, 20.3) | 17.5 (15.6, 19.5) | 0.7 | 0.04 |
| Lumbar Spine | ||||
| Upright position (U) | -33.6 (-35.0, -32.2) | -29.6 (-31.1, -28.1) | <0.001 | 0.4 |
| Flexion (F) | 32.4 (31.2, 33.7) | 32.2 (31.0, 33.4) | 0.8 | 0.03 |
| Extension (E) | -41.5 (-43.7, -39.3) | -36.0 (-38.0, -33.9) | <0.001 | 0.4 |
| Range of motion (F-U) | 66.0 (64.7, 67.4) | 61.8 (60.4, 63.2) | <0.001 | 0.4 |
| Range of motion (E-U) | -7.9 (-9.9, -5.9) | -6.4 (-8.1, -4.7) | 0.2 | 0.1 |
| Range of motion (F-E) | 74.0 (71.7, 76.2) | 68.2 (66.1, 70.3) | <0.001 | 0.4 |
| Spinal inclination | ||||
| Upright position (U) | -1.4 (-1.9, -0.9) | -0.07 (-0.6, 0.4) | <0.001 | 0.4 |
| Flexion (F) | 92.6 (90.8, 94.3) | 90.8 (89.0, 92.6) | 0.2 | 0.1 |
| Extension (E) | -32.9 (-34.5, -31.3) | -30.7 (-32.0, -29.3) | 0.03 | 0.2 |
| Range of motion (F-U) | 94 (92.2, 95.8) | 90.9 (89.0, 92.7) | 0.02 | 0.2 |
| Range of motion (E-U) | -31.5 (-33.1, -29.9) | -30.6 (-32.0, -29.2) | 0.4 | 0.08 |
| Range of motion (F-E) | 125.5 (122.9, 128.1) | 121.5 (119.1, 123.8) | 0.03 | 0.2 |
| Matthiass-Arm-raising test | ||||
| Difference in spinal curvature of the pelvic tilt | -2.3 (-3.3, -1.4) | -1.5 (-2.4, -0.5) | 0.2 | 0.1 |
| Difference in spinal curvature of the lumbar spine | -3.1 (-4.0, -2.1) | -3.7 (-4.5, -2.8) | 0.4 | 0.09 |
| Difference in spinal curvature of the spinal inclination | -5.2 (-6.0, -4.4) | -5.7 (-6.5, -5.0) | 0.3 | 0.1 |
Table 2: Comparison of sex differences of the spinal parameters measured with a Spinal Mouse in 6 to 8 year old children.
Anthropometrics, physical fitness and spinal flexibility
Pelvic tilt: Flexibility of the pelvic tilt differed according to waist circumference in both sexes (low: 59.2 cm [95% CI 57.7; 60.7], normal: 58.3 cm [57.6; 59.0], high: 56.5 cm [54.9; 58.0], p=0.04, d>0.3). Post-hoc testing showed no differences (p>0.2). In BMI, height, weight and body fat no difference could be found (p>0.3). Physical fitness differed for the 20 m shuttle run performance in boys, favoring the group with the highest flexibility compared to the one with the lowest (low: 4.3 stages [3.9, 5.0] vs high: 5.3 stages [4.9, 5.9], p=0.04, d=0.6). In jumping sidewards (d=0.7), 20 m sprint (d=0.4) and balancing backwards (d=0.5) both sexes showed a better performance in the group with a high flexibility compared to the group with a low flexibility of the pelvic tilt (Figure 2) (for detailed results see Table A1 Additional File 1). The regression analysis shows that the wider the waist circumference the smaller the flexibility of the pelvic tilt. The better the jumping performance, the faster the children are in the 20 m sprint or the better the balancing performance, the higher is the flexibility of pelvic tilt (Table 4).
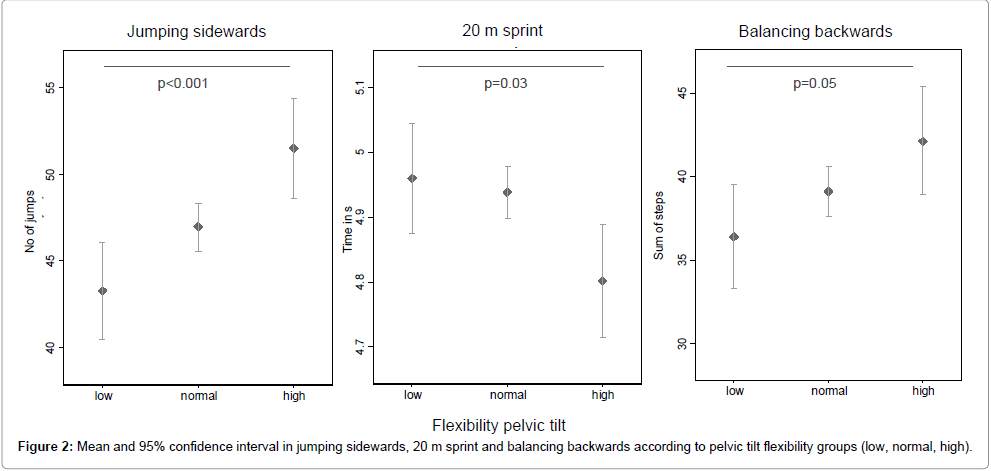
Figure 2: Mean and 95% confidence interval in jumping sidewards, 20 m sprint and balancing backwards according to pelvic tilt flexibility groups (low, normal, high).
Thoracic spine: There were no differences in flexibility of the thoracic spine comparing groups according to anthropometrics and physical fitness (p>0.1) (Table A2 in Additional File 1). The same results were found in the regression analysis (Table 4).
Lumbar spine: Differences were found between BMI and flexibility of the lumbar spine in girls (low: 17.3 kg/m2 [16.5; 18.0] vs high: 16.2 kg/m2 [15.3; 16.7], p=0.02, d=0.6 and low: 17.3 kg/m2 [16.5; 18.0] vs normal: 16.0 kg/m2 [15.9; 16.5], p=0.03, d=0.6). In the group with low lumbar flexibility, girls were heavier than in the group with the normal flexibility (low: 27.9 kg [26.2; 29.5] vs normal: 25.6 kg [24.8; 26.2] p=0.03, d=0.6).
In jumping sidewards, large differences could be found in boys between low and high flexibility, favoring the low group (low: 52.3 jumps [48.1; 56.6] vs high: 44.8 jumps [40.6; 49.1], p=0.05, d=0.6). In height, weight, body fat, waist circumference, 20 m shuttle run, 20 m sprint and balancing backwards there were no differences in relation to the flexibility of the lumbar spine (p>0.1) (Table A3 in Additional File 1). The regression analysis showed only differences in changes by unit of jumping sidewards, with children with a better jumping performance do have a less flexible lumbar spine (Table 4).
Spinal inclination: Between spinal inclination and anthropometric parameters differences were found in height (low: 128.2 cm [126.8; 129.6], normal: 126.0 cm [125.4; 126.5], high: 126.4 cm [125.0; 127.7], p=0.02, d=0.4), weight (low: 27.8 kg [26.5; 29.0], normal: 26.0 kg [25.4; 26.5], high: 25.9 kg [24.7; 27.1], p=0.03, d=0.4) and in waist circumference (low: 60.6 cm [59.0; 62.3], normal: 57.9 cm [57.2; 58.6], high: 57.0 cm [55.4; 58.7], p<0.01, 0.5=0.6). Physical fitness differed between the groups in 20 m shuttle run in boys (low: 4.2 stages [3.6, 4.7] vs high: 5.6 stages [5.0; 6.1], p<0.01, d=0.9). As shown in Figure 3 jumping sidewards (d=0.8), 20 m sprint (d=0.5) and balancing backwards (d=0.8) differed between the group with the lowest and the group with the highest flexibility of the spinal inclination (Table A4 in Additional File 1).
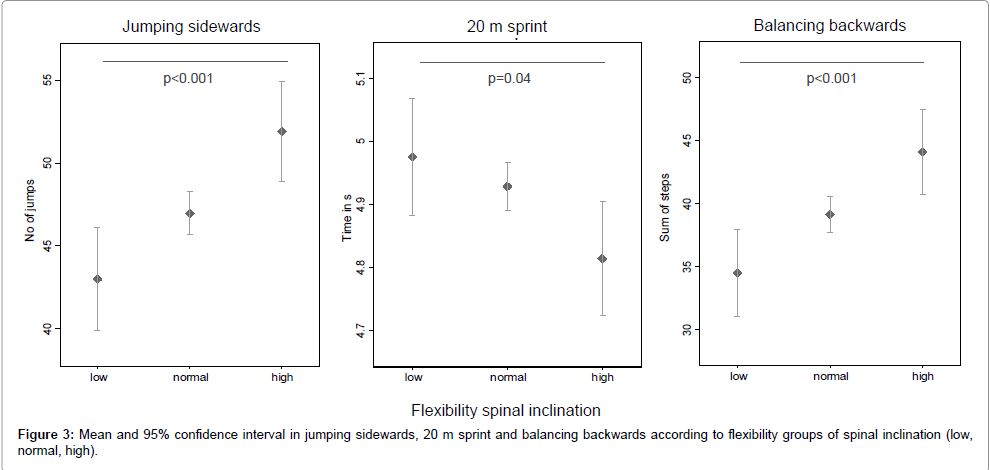
Figure 3: Mean and 95% confidence interval in jumping sidewards, 20 m sprint and balancing backwards according to pelvic tilt flexibility groups (low, normal, high).
As shown in the regression analysis (Table 4) children with a higher BMI, a higher weight and a wider waist circumference are less flexible in the inclination of the spine. As well it was found that children that perform better in all of the four physical fitness tests are more flexible in spinal inclination than their peers (Table 4).
| Parameter | Pelvic tilt | Thoracic spine | Lumbar spine | Spinal inclination | ||||
| Β-coefficent (95%CI) | p | Β-coefficent (95%CI) | p | Β-coefficent (95%CI) | p | Β-coefficent (95%CI) |
p | |
| BMI* | -0.6 (-1.8; 0.5) | 0.3 | 0.2 (-0.5; 0.9) | 0.6 | -0.7 (-1.4; 0.06) | 0.07 | -0.9 (-1.7; -0.03) | 0.04 |
| Percentage body fat* | -0.3 (-0.7; 0.2) | 0.3 | 0.2 (-0.1; 0.5) | 0.2 | -0.2 (-0.5; 0.07) | 0.1 | -0.3 (-0.6; 0.06) | 0.1 |
| Height* | -0.4 (0.8; 0.1) | 0.1 | 0.1 (-0.2; 0.4) | 0.4 | -0.02 (-0.3; 0.3) | 0.9 | -0.3 (-0.6; 0.07) | 0.1 |
| Weight* | -0.4 (-0.9; 0.1) | 0.1 | 0.1 (-0.2; 0.4) | 0.5 | -0.2 (-0.6; 0.09) | 0.2 | -0.4 (-0.8; -0.06) | 0.02 |
| Waist circumference* | -0.6 (-1.0; -0.2) | <0.01 | 0.2 (-0.1; 0.4) | 0.2 | -0.01 (-0.3; 0.2) | 0.9 | -0.4 (-0.7; -0.1) | <0.01 |
| 20 m Shuttle Run** | 1.0 (-0.6; 2.5) | 0.2 | 0.6 (-0.4; 1.5) | 0.2 | 0.1 (-0.9; 1.2) | 0.8 | 1.2 (0.06; 2.3) | 0.04 |
| Jumping sidewards** | 0.5 (0.3; 0.7) | <0.01 | -0.08 (-0.2; 0.04) | 0.2 | -0.1 (-0.3; -0.01) | 0.03 | 0.3 (0.2; 0.5) | <0.01 |
| 20 m sprint** | -8.7 (-15.8; -1.7) | 0.02 | -0.7 (-5.1; 3.6) | 0.7 | 3.0 (-1.6; 7.6) | 0.2 | -6.0 (-11.1; -0.8) | 0.02 |
| Balancing backwards** | 0.3 (0.1; 0.5) | <0.01 | -0.06 (-0.2; 0.06) | 0.3 | -0.003 (-0.1; 0.1) | 0.9 | 0.3 (0.1; 0.4) | <0.01 |
Table 4: Regression analysis of spinal parameters in relation to anthropometrics and physical fitness.
Anthropometrics, physical fitness and spinal posture
Pelvic tilt: BMI (postural insufficiency: 17.3 kg/m2 [16.3; 18.4] vs normal posture: 16.2 kg/m2 [15.9; 16.6], p=0.04, d=0.6), weight (postural insufficiency: 28.7 kg [26.5; 30.8] vs normal posture: 26.3 kg [25.6; 27.0], p=0.04, d=0.5) and 20 m shuttle run performance (postural insufficiency: 4.0 stages [3.2; 4.7] vs normal posture: 4.9 stages [4.7; 5.1], p=0.01, d=0.6) were better in boys with a normal posture in the pelvic tilt compared to boys with a postural insufficiency. As well smaller girls showed more frequently postural insufficiency than their peers (postural insufficiency: 123.2 cm [120.8; 125.6] vs normal posture: 125.7 cm [125.0; 126.5], p=0.05, d=0.5). No differences were shown in the other anthropometric or physical fitness parameters (p>0.3) (Table A5 in Additional File 1).
Lumbar spine: As shown in Table 3 differences between the group with postural insufficiency and the group with a normal posture in the lumbar spine were found in BMI, body fat, height, weight, waist circumference. In 20 m shuttle run a tendency in differences was seen (p=0.1; d=0.3). There were no differences in jumping sidewards, 20 m sprint and balancing backwards (p>0.3) (Table A6 in Additional File 1).
| Parameter | Difference in spinal curvature of the lumbar spine | |||||
| Postural insufficient (N=51) |
Normal (N=344) |
pGroup | pSex | pGxS | Cohen’s d | |
| BMI (kg/m2) | ||||||
| Mean (95% CI)* | 16.9 (16.3, 17.5) | 16.2 (16.0, 16.5) | 0.04 | 0.7 | 0.6 | 0.3 |
| Percentage body fat (%) | ||||||
| Mean (95% CI)* | 18.3 (16.9, 19.7) | 16.5 (16.0, 17.0) | 0.02 | 0.01 | 0.8 | 0.4 |
| Height (cm) | ||||||
| Mean (95% CI)* | 127.7 (126.3, 129.1) | 126.1 (125.6, 126.6) | 0.04 | 0.2 | 0.4 | 0.3 |
| Weight (kg) | ||||||
| Mean (95% CI)* | 27.6 (26.4, 28.9) | 26.0 (25.5, 26.4) | 0.04 | 0.3 | 0.6 | 0.4 |
| Waist circumference (cm) | ||||||
| Mean (95% CI)* | 59.8 (58.1, 61.4) | 57.9 (57.3, 58.6) | 0.03 | 0.3 | 0.5 | 0.3 |
| 20 m Shuttle Run (stage) | ||||||
| Mean (95% CI)** | 4.1 (3.7, 4.5) | 4.5 (4.3, 4.6) | 0.1 | <0.001 | 0.5 | 0.3 |
| Jumping sidewards (sum of jump counts) | ||||||
| Mean (95% CI)** | 48.1 (44.9, 51.2) | 47.0 (45.7, 48.1) | 0.5 | 0.04 | 0.3 | 0.1 |
| 20 m Sprint (s)** | ||||||
| Mean (95% CI) | 4.9 (4.8, 5.0) | 4.9 (4.9, 5.0) | 0.8 | <0.01 | 0.3 | 0.03 |
| Balancing backwards (sum of steps) | ||||||
| Mean (95% CI)** | 41.0 (37.5; 44.5) | 39.0 (37.6; 40.2) | 0.3 | 0.03 | 0.2 | 0.2 |
Table 3: Differences in spinal curvature of the lumbar spine in relation to anthropometrics and physical fitness parameters.
Spinal Inclination: The group comparison between postural insufficiency in the spinal inclination and normal posture revealed differences in boys in 20 m shuttle run favoring the normal group (postural insufficiency: 4.2 stages [3.7; 4.8] vs normal posture: 4.9 stages [4.7; 5.1], p=0.04, d=0.5). The other parameters did not show differences between the two groups (p>0.1) (Table A7 in Additional File 1).
Back pain: One percent of the children reported back pain. No differences in anthropometrics, physical fitness, spinal flexibility, spinal posture concerning back pain could be found (p>0.1).
Discussion
The purpose of this study was to examine the association between physical fitness, spinal flexibility, spinal posture and reported back pain in 6 to 8 year old Swiss children. We found that a high flexibility of the pelvic tilt and the spinal inclination, as well as a low flexibility of the lumbar spine, were associated with better physical fitness in children. The strongest determinant for postural insufficiency was a low performance in 20 m shuttle run test.
Spinal flexibility
Children with a high flexibility in the pelvic tilt and the spinal inclination have a better physical fitness than the children with a low flexibility. Children with a low flexibility in the lumbar spine are better in jumping sidewards than the children with a higher flexibility. As seen in athletes a stiffening of the lumbar spine leads to an improved stabilization of the upper body for functional movements [29]. Studies with back pain patients show, that hypermobility of the lumbar spine leads to more severe back pain [30]. The thoracic spine is anatomically built for stability [31]. Therefore, a lower flexibility in children with higher physical fitness would have been expected. The fact that we could not find any differences between the groups in thoracic flexibility may be because the standardized measurement position (head/neck in a neutral position, hands on the waist) makes it difficult to achieve a full thoracic extension. Similar results have been shown in a previous study with adults [17]. As well we found that children with a higher waist circumference are less flexible in pelvic tilt and spinal inclination. The heavier and the higher the BMI the flexibility of the spinal inclination seem to be limited as well. Since we hypothesize that a less flexible spinal inclination in young age is associated with back pain later in life, these results go in line with a recently published study showing that BMI is associated with low back pain in 9 to 14 year olds [4]. In contrast to boys the flexibility of the spine is higher in girls. This finding has been underlined in other studies in children [10]. Compared with a study that measured the spinal curvature with a Spinal Mouse in 10 year old boys the results of this study are similar [18]. Compared to adults the studies with children show a lower spinal flexibility [17]. This may be because of the considerable restriction of spinal mobility during growth [11].
Spinal posture
In pelvic tilt smaller girls and heavier boys tend to have more often a postural insufficiency, but there were no differences in spinal curvature of the pelvic tilt concerning the BMI. We found that heavier, taller children with a higher BMI, a higher percentage of body fat and a wider waist circumference showed more often postural insufficiency in the lumbar spine during the Matthiass-arm-raising test. As shown in another study to maintain a flat lumbar spine is a margin of safety and important during activities or sports [32]. Hence, it was expected that children with a postural insufficiency are less fit than children with a normal posture. This could only been shown in the 20 m shuttle run test in boys, where children with a postural insufficiency in pelvic tilt and spinal inclination were worse in 20 m shuttle run than their peers with a normal posture. In girls no differences were shown. This could be because the girls in this study were overall worse in the physical fitness parameters than the boys and probably less physically active. It has been shown that children, that are more physically active do have a better physical fitness [33] and less postural insufficiencies [34].
Back pain
Compared to the Swiss spine day data of 2012 (38.4%) only 1 % of the children reported back pain [8]. However, the authors pointed out that the back pain prevalence does not represent the overall prevalence in Switzerland due to selection bias. Our results are in line with a recently published review where 1-6% of the children in a corresponding age group reported low back pain [1]. It has also been shown that the back pain prevalence rises with every year of age [35]. Our data support this hypothesis. The low prevalence likely explains that no correlation between back pain, physical fitness, spinal flexibility or spinal posture could be found.
Strengths and limitations
Compared to Swiss population data [36-38] our sample represents the urban population of Switzerland. However, voluntary study participation may cause selection bias. Compared to the whole population of first-graders of Basel-Stadt a selection bias in the physical fitness level occurred. The participants of this study were significantly better in the 20 m shuttle run in both sexes, in jumping sidewards in boys and in balancing backwards in girls (each p≤0.01).” The reliability of the Spinal Mouse is high [17] and in this study one trained examiner made all measurements. Therefore, no interexaminer effect has to be considered. Compared to the “gold standard” radiographs studies show, that the Spinal Mouse is valid, except for values recorded at the lumbar segments L4-5 and L5-S1 [17,39]. Those specific segments were not analyzed in the present study. Even if the current literature discusses the radiographs as the “gold standard”, no study has ever shown an acceptable reliability for radiographs of the spinal flexibility [17]. Numerous studies showed that a considerable amount of errors occurred in measurements of vertebral angles and their interpretation in radiographs [17,24,40]. Under these circumstances the mean values measured with the Spinal Mouse have been compared to the values measured with various other devices, including radiographs, showed good agreement. Therefore, it has been suggested that the Spinal Mouse is an adequate tool to assess the spinal curvature [17]. Besides the “gold standard” radiographs comes with high costs and considerable patient risk. Up to date only the reliability of the Spinal Mouse measurement has been examined in boys [18]. There is clearly a need for further validity and reliability studies of the Spinal Mouse in children, since most of the research has been conducted in adults so far.
The proxy-reported back pain questionnaire may cause recall bias. But the children were too young to fill out the questionnaire themselves. Further, since the back pain questionnaire was imbedded in the school setting, the accuracy of responding by the parents might have been improved.
Conclusions
Physical fitness is associated with a higher flexibility of the pelvic tilt as well as with a more flexible spinal inclination. There is a tendency towards lower flexibility of the lumbar spine in children with a high physical fitness level. Thus, we conclude that physical fitness has a positive influence on the spinal flexibility. Boys with postural insufficiency tend to have a lower aerobic fitness than their peers. As well postural insufficiency of the lumbar spine is associated with heavy weight, a higher BMI, a wider waist circumference and a higher percentage of body fat. Nevertheless, no association between physical fitness, spinal flexibility, spinal posture and back pain has been found in 6 to 8 year old children.
Acknowledgements
We thank all children, parents, teachers and the heads of schools for their participation and confidence. We also thank the Cantonal Office of Sport of Basel- Stadt for their collaboration and the Department of Education of Basel-Stadt for their encouragement, confidence and the financial support. Finally, we sincerely thank all the volunteering students for their great support during data collection.
References
- Michaleff ZA, Kamper SJ, Maher CG, Evans R, Broderick C, et al. (2014) Low back pain in children and adolescents: a systematic review and meta-analysis evaluating the effectiveness of conservative interventions. Eur Spine J 23: 2046-2058.
- Waddell G (1998) The back pain revolution. Vol. 2nd. 1998, Edinburgh: Churchill Livingstone. 438.
- Balagué F, Skovron ML, Nordin M, Dutoit G, Pol LR, et al. (1995) Low back pain in schoolchildren. A study of familial and psychological factors. Spine (Phila Pa 1976) 20: 1265-1270.
- Sano A, Hirano T, Watanabe K, Endo N, Ito T, et al. (2015) Body mass index is associated with low back pain in childhood and adolescence: a birth cohort study with a 6-year follow-up in Niigata City, Japan. Eur Spine J 24: 474-481.
- Kratenová J, Zejglicová K, Malý M, Filipová V (2007) Prevalence and risk factors of poor posture in school children in the Czech Republic. J Sch Health 77: 131-137.
- Thomas E, Silman AJ, Papageorgiou AC, Macfarlane GJ, Croft PR (1998) Association between measures of spinal mobility and low back pain. An analysis of new attenders in primary care. Spine (Phila Pa 1976) 23: 343-347.
- Rheumaliga Schweiz, Rückenreport Schweiz (2011) Die Erhebung zur Rückengesundheit von Herr und Frau Schweizer. 2011, Rheumaliga Schweiz: Zürich 23.
- Wirth B, Knecht C, Humphreys K (2013) Spine Day 2012: spinal pain in Swiss school children- epidemiology and risk factors. BMC Pediatr 13: 159.
- Skoffer B (2007) Low back pain in 15- to 16-year-old children in relation to school furniture and carrying of the school bag. Spine (Phila Pa 1976) 32: E713-717.
- Salminen JJ, Erkintalo M, Laine M, Pentti J (1995) Low back pain in the young. A prospective three-year follow-up study of subjects with and without low back pain. Spine (Phila Pa 1976) 20: 2101-2107.
- Widhe T (2001) Spine: posture, mobility and pain. A longitudinal study from childhood to adolescence. Eur Spine J 10: 118-123.
- Jacob T, Baras M, Zeev A, Epstein L (2004) Physical activities and low back pain: a community-based study. Med Sci Sports Exerc 36: 9-15.
- Heneweer H, Vanhees L, Picavet HS (2009) Physical activity and low back pain: a U-shaped relation? Pain 143: 21-25.
- Ruhe A, Fejer R, Walker B (2011) Center of pressure excursion as a measure of balance performance in patients with non-specific low back pain compared to healthy controls: a systematic review of the literature. Eur Spine J 20: 358-368
- Cole TJ, Bellizzi MC, Flegal KM, Dietz WH (2000) Establishing a standard definition for child overweight and obesity worldwide: international survey. BMJ 320: 1240-1243.
- Slaughter MH, Lohman TG, Boileau RA, Horswill CA, Stillman RJ, et al. (1988) Skinfold equations for estimation of body fatness in children and youth. Hum Biol 60: 709-723.
- Mannion, AF (2004) A new skin-surface device for measuring the curvature and global and segmental ranges of motion of the spine: reliability of measurements and comparison with data reviewed from the literature. Eur Spine J 13: 122-136
- Kellis E, Adamou G, Tzilios G, Emmanouilidou M (2008) Reliability of spinal range of motion in healthy boys using a skin-surface device. J Manipulative Physiol Ther 31: 570-576.
- Matthiass H, Reifung (1966) Wachstum und Wachstumsstörungen des Haltungs- und Bewegungsapparates im Jugendalter. Basel: Karger 113.
- Klee A (1995) [Predictive value of Matthiass' arm-raising test]. Z Orthop Ihre Grenzgeb 133: 207-213.
- van Mechelen W, Hlobil H, Kemper HC (1986) Validation of two running tests as estimates of maximal aerobic power in children. Eur J Appl Physiol Occup Physiol 55: 503-506.
- Committee for the development of sport, Eurofit, European test of physical fitness. 1988, Rome: Edigraf Editoriale Grafica.
- Kiphard EJ, Schilling F (1970) Körperkoordinationstest für Kinder KTK. Manual Weinheim: Beltz. 54.
- Panjabi M, Chang D, Dvorák J (1992) An analysis of errors in kinematic parameters associated with in vivo functional radiographs. Spine (Phila Pa 1976) 17: 200-205.
- Léger LA, Mercier D, Gadoury C, Lambert J (1988) The multistage 20 metre shuttle run test for aerobic fitness. J Sports Sci 6: 93-101.
- Cools W, Martelaer KD, Samaey C, Andries C (2009) Movement skill assessment of typically developing preschool children: a review of seven movement skill assessment tools. J Sports Sci Med 8: 154-168.
- Roth-Isigkeit A, Ellert U, Kurth BM (2002) Assessment of pain within the framework of a health survey for children and adolescents. Gesundheitswesen 64: S125-S129.
- Cohen J (1988) Statistical power analysis for the behavioral sciences (2nded). Hillsdale, N.J.: L. Erlbaum Associates. xxi, 567.
- Leetun DT, Ireland ML, Willson JD, Ballantyne BT, Davis IM (2004) Core stability measures as risk factors for lower extremity injury in athletes. Med Sci Sports Exerc 36: 926-934.
- Lundin A, Magnuson A, Nilsson O (2009) A stiff and straight back preoperatively is associated with a good outcome 2 years after lumbar disc surgery. Acta Orthop 80: 573-578.
- Â Middleditch A, Oliver J (2005) Functional anatomy of the spine. 2nd edition ed. Philadelphia: Elsevier Health Scienes 359.
- Adams MA, Hutton WC (1985) The effect of posture on the lumbar spine. J Bone Joint Surg Br 67: 625-629.
- Sollerhed AC, Andersson I, Ejlertsson G (2013) Recurrent pain and discomfort in relation to fitness and physical activity among young school children. Eur J Sport Sci 13: 591-598.
- Latalski M, Bylina J, Fatyga M, Repko M, Filipovic M, et al. (2013) Risk factors of postural defects in children at school age. Ann Agric Environ Med 20: 583-587.
- Calvo-Munoz I, Gomez-Conesa A, Sanchez-Meca J (2013) Prevalence of low back pain in children and adolescents: a meta-analysis. BMC Pediatrics 13: 14.
- Bundesamt für Statistik, Ständige Wohnbevölkerung nach Alter, Geschlecht und Staatsangehörigkeit. 2012, http://www.bfs.admin.ch/bfs/portal/de/index/themen/01/02/blank/key/alter/nach_geschlecht.html. Accessed 22 August 2014: Available.
- Stamm H (2014) Monitoring der Gewichtsdaten der schulärztlichen Dienste der Städte Basel, Bern und Zürich. Vergleichende Auswertung der Daten des Schuljahres 2012/2013, in Bern und Lausanne, Gesundheitsförderung Schweiz Faktenblatt 1, Editor. 2014, Gesundheitsförderung Schweiz: Bern und Lausanne. 8.
- Statistisches Amt Basel-Stadt, Jahrestabellen: Ausländische Bevölkerung nach Heimat und Wohnviertel. 2013, http://www.statistik-bs.ch/tabellen/t01/1. Accessed 22 August 2014: Available.
- Guermazi, M (2006) Validité et reproductibilité du Spinal Mouse® pour l’étude de la mobilité en flexion du rachis lombaire. Validity and reliability of Spinal Mouse® to assess lumbar flexion. Annales de réadaptation et de médecine physique. 49: 172-177.
- Polly DW Jr, Kilkelly FX, McHale KA, Asplund LM, Mulligan M, et al. (1996) Measurement of lumbar lordosis. Evaluation of intraobserver, interobserver, and technique variability. Spine (Phila Pa 1976) 21: 1530-1535.
Citation: Imhof K, Faude O, Strebel V, Donath L, Roth R, et al. (2015) Examining the Association between Physical Fitness, Spinal Flexibility, Spinal Posture and Reported Back Pain in 6 To 8 Year Old Children. J Nov Physiother 5: 274. DOI: 10.4172/2165-7025.1000274
Copyright: © 2015 Imhof K, et al. This is an open-access article distributed under the terms of the Creative Commons Attribution License, which permits unrestricted use, distribution, and reproduction in any medium, provided the original author and source are credited.
Select your language of interest to view the total content in your interested language
Share This Article
Recommended Journals
Open Access Journals
Article Tools
Article Usage
- Total views: 15985
- [From(publication date): 10-2015 - Jul 01, 2025]
- Breakdown by view type
- HTML page views: 11174
- PDF downloads: 4811