Farmers’ Adaptation to Rainfall Variability and Salinity through Agronomic Practices in Lower Ayeyarwady Delta, Myanmar
Received: 22-Jan-2015 / Accepted Date: 03-Feb-2015 / Published Date: 12-Feb-2015 DOI: 10.4172/2157-7617.1000258
Abstract
The paper analyses factors influencing the agricultural adaptation practices in embankment and non-embankment areas of lower Ayeyarwady delta based on the information collected through a survey of 240 sampled households mostly practicing rice farming. Farmers in both areas have adopted several agronomic practices to adapt with rainfall variability and soil and water salinization due to sea level rise. A multivariate probit model employed to estimate the simultaneous interdependent decisions by farm households explained the factors influencing the adaptation of rice farmers to respond to the rainfall variability and salinity. Irrespective of correlation signs, the most significant determinants in adaptations of non-embankment area are farm size, farm income, non-farm income, training and lowland followed by educational level, family agricultural labor, land ownership, farming experience and the institutional credit. In the embankment area, five variables out of 12; namely, farm size, farm income, training frequency, credit and lowland are most influential on the adoption of agricultural adaptation practices. The poor linkage of extension and training programs reflected the poor lowland soil condition and cultural practices. Although double cropping of rice in monsoon and summer has provided higher cropping intensity and farm income, it has promoted the soil salinity and environmental unsustainability. Policy instruments are therefore suggested for an effective implementation of soil conservation and integrated farming system in lowland rainfed rice-based cropping system.
Keywords: Agricultural adaptation; Rainfall variability; Salinity; Multivariate probit model; Ayeyarwady delta
8770Introduction
Deltas are the hot spots of vulnerability due to high impacts of climate change (sea-level rise, changes in waterway, runoff) and anthropogenic activities (dam construction, use of chemicals in modern agriculture, intensive land utilization and flood control works) in catchment areas and delta plain land [1]. In contrast, deltas are important for global food security since rice was intensively cultivated in its alluvial fertile land. More than 80% of the world’s total area of rice comes from deltaic lowlands of Asia [2]. Ayeyarwady delta, one of the Asian mega deltas, is famous as the rice bowl of Myanmar as it occupies 26% of total rice growing area (7,706,526 ha) of the country. Significantly, in recent years, climate change shocks rice production of Ayeyarwady delta due to the alterations of rainfall pattern, intensity of rainfall and sea level rise. The most prominent changes were the late onset and early withdrawn of monsoon which shorten the duration of monsoon relative to the regular period. In combination with heavy monsoon rainfall, rising sea levels create serious waterlogging and prolonged stagnant floods in the low-lying areas of Ayeyarwady delta damaging the thousand acres of rice field [3,4]. As a result of sea level rise, seawater encroachment increased salinity in soils and converted some rice cultivable areas that were no longer viable for rice production into salt farms [5,6], and thus, non-saline arable areas are limited. Therefore, farmers in delta areas are confronting erratic rainfall, floods and intense rains, increased salinity and coastal erosion.
Mono cropping of rice is the dominant cropping pattern of Ayeyarwady delta which can make farmers extremely vulnerable to climate-induced shocks [7-9]. The majority of farmers grow local rice varieties, which have photoperiod-sensitive, long life span and low yield. Farmers have poor resources to manage the best use of soil, water and inputs (seeds, fertilizer) for sustainable rice productivity to confront the climate change [8]. Compared to other South Asian farmers, farmers in Myanmar have a lower adaptive capacity to confront the high impacts of climate change. Farmers deploy various indigenous ways of coping and adaptive measures to respond to changing climate. However, the severity of vulnerability is very high due to the low adaptive capacity, weakness of current coping mechanism, limited technical and institutional support and poor networking among farmers, extension activities and agricultural research. The existing agricultural adaptation practices in changing climate condition will threaten the livelihood sustainability of delta farmers in long term. In order to solve such possible challenges, it is essential to empower rice farmers to build the strong resilience to adapt to climate change. Specifically, it is necessary to enable them to extend and adopt more effective agricultural adaptation measures by implementing appropriate crop, soil and water management programs. In this respect, this study aimed at the analyses of the farmers’ ongoing adaptation measures towards changing or modifying agronomic management practices (i.e. crop, water and soil management practices -variety, water use, cropping period, soil conservation etc.,) and to explore the factors (farmers’ socio-economic condition, indigenous knowledge on adaptation, institutional support) influencing the adoption of such management practices.
Conceptual Perception On Adoption Of Agricultural Adaptation Practices
Agriculture is the most climate-sensitive sector as the nature of crop production is mainly dependent on weather. Farmers suffered from significant yield reduction and major losses in rain-fed agriculture due to erratic rainfall pattern, increased occurrence of drought, dry spells and shifts of the rainy season [10-12]. Agricultural adaptation is imperative to protect the livelihoods of the farmers and to ensure the food security of the country. Naturally, farmers are trying to cope with in their traditional way based on the resources they have, experience and exposure to vulnerability under increasing climate change. However, some local coping practices to reduce the vulnerability impact of perceived climate change are not sustainable for future climate variability [13]. For example, due to the extreme climate events, small-scale farmers in Tanzania rely more heavily on access to forest resources for subsistence, and income-generating activities. Their short-term coping practices of firewood-cutting and selling, charcoalmaking, craft and forest products, and hunting which are leading to deforestation can be maladaptation in the long term [14]. The choice of coping options depends on social and biophysical elements such as socio-economic characteristics of farm households (farm size, level of education, household income), access to extension services, credit supply and the existing resources [15,16]. For example, small famers in drought prone area of Mozambique faced unfavorable market relations in economic change such as increased market integration, altered systems of agricultural support, land tenure change and privatization of agro-industries etc., whereas large-scale farmers had the capital and skills necessary to negotiate a good market position [17].
Farmers were more likely to adapt if they are empowered. To improve the resilience of agricultural system and adaptive capacity of the farmers, transformations in the management of natural resources (land, water, soil) and innovation of location specific technology (efficiency in use of existing resources and inputs for production) are required [18,19]. Integration of local knowledge with additional technical or scientific knowledge can improve the climate change adaptation. The key components of innovative adaptation measures include (i) changes in crop production practices, (ii) changes in soil and water management practices, (iii) livelihood and crop diversification to enhance climate resilience, (iv) agricultural science and technology development, advisory services and information systems, and (v) risk management and crop insurance [18]. Many studies in related literature emphasized that investment in rural infrastructure, availability and technical efficiency of inputs, a training system in the strengthening of social capital, providing agricultural extension and micro credit services may be the best means of improving the adaptation in the long run and the adaptive capacity of farmers [16,20-23].
Several studies suggested that technical innovation in the conventional method of agriculture becomes as an effective adaptation approach to climate change. Innovations are human adaptations to changing needs and socio-economic conditions and the concept of innovation draws attention to the broader, collective dimensions of adaptive practices. Effective responses to climate change require technological as well as institutional innovation because there is a relationship between change in resource endowment and the development of new institutional or technological innovation. Combining the conventional technological innovation process with the tacit knowledge of farmers has been instrumental in the innovation of location-specific technologies, thereby facilitating the adoption of technologies in a more efficient manner. There should be retrospective analysis to understand how earlier technological innovations have been targeted to address climatic constraints in specific locations. An investigation of local adaptation practices with a focus on historical experience and traditional environmental knowledge helps to trace these social dynamics and uncover important loci of innovation [23-25].
The cooperation and knowledge-sharing between farmers and extension workers are the most effective changes evidenced in adaptation resilience to high variability of climate change [26]. Furthermore, enabling policies and actions to support the implementation of adaptive strategy are much needed in offsetting the negative impacts of climate change and sustainable environmental management [27,28]. However, there were also some arguments about the question of how technical practices can be adjusted at the farm level to be more strategic and more effectively. In fact, the integration of new information into agricultural management practices needs technical skill and capital investment, which are constraints for small-scale subsistence agriculture [29].
Study Area
Study area: lower Ayeyarwady delta
The study area, Labutta Townsip, is located in the lower part of Ayeyarwady delta. The area covers the fertile alluvial low land and stands 1.52 m above the sea level. Mangrove and tidal forest partially covered the 64.37 km length of coastal line. The major river, Ayeyarwady and other rivers: Nga Won, That Kal Thaung, Ywe and Pyar Ma Lot Rivers are crossing from South to North of Labutta (Figure 1). The existing intricate river system provides easy access of water transportation to townships and villages along the waterways. The total area of Labutta, 300,566 ha is composed of 99,642 ha agricultural land, 111, 5444 ha forestland and 85,829 ha non-agricultural land. Rain fed rice occupied 86% of the total agricultural land and other crops such aspulses (green gram, black gram, bocate), winter crops (sweet corn, sesame, groundnut, sunflower, chili) and seasonal vegetables (water cress, cauliflower, cabbage, lettuce, mustard, coriander, roselle, okara, green chili, bitter gourd, bottle gourd, cucumber, water melon and long beans) covered the rest, 14%.
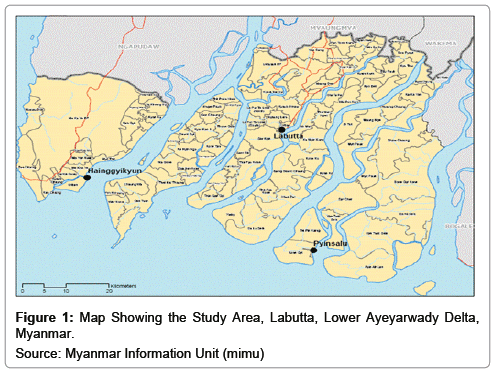
Figure 1: Map Showing the Study Area, Labutta, Lower Ayeyarwady Delta, Myanmar.
Source: Myanmar Information Unit (mimu)
Rainfall and salinity
Annual riverine floods are most common in Labutta due to intense rainfall at the peak of Monsoon. The average annual rainfall (3311 mm) during 1993-2013 was significantly higher than that (2887 mm) of the period (1961-1990). There was a higher fluctuation in annual rainfall distribution and number of rainy days during 1993-2012 (Figure 2). For the years 1993-2013, relatively higher annual rainfall was recorded in 1994, 1999, 2001, 2002, 2003, 2005, 2007, 2009 and 2012 with reference to the annual average of 1961-1990. The deviation graph of annual rainfall from reference rainfall indicated that there were 17 times of positively deviated years and 3 times of negatively deviated years during 1993-2013. The deviated percentage was ranging from 10 to 60% from reference annual rainfall of 2887 mm. It could be estimated that farmers received more than normal annual rainfall in most of the years up to the highest positively deviated percentage of 60 in 1994 (Figure 3). However, the lower amount of annual rainfall during 2003-2013 than during 1993-2003 points to the higher fluctuating rain distribution pattern and shortening of Monsoon period (late onset and early withdrawal of Monsoon).
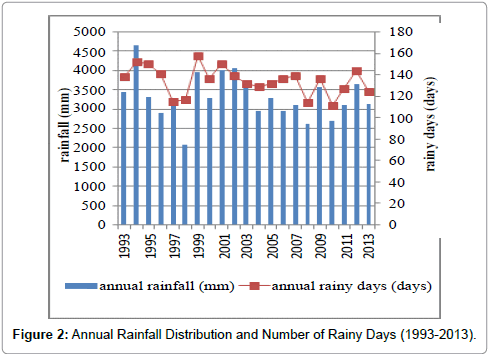
Figure 2: Annual Rainfall Distribution and Number of Rainy Days ( 1993-2013).
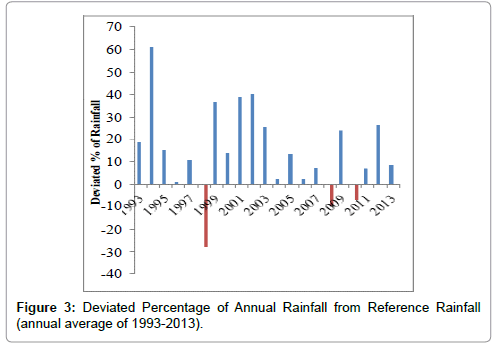
Figure 3: Deviated Percentage of Annual Rainfall from Reference Rainfall (annual average of 1993-2013).
The major causes of salinity in the delta region were sea level rise and the seasonal tidal regime. In delta area, the mean tidal level as well as the spring tide level fluctuates seasonally. Spring tides are highest in summer season leading to strong seasonal salinization. Consequently, the rice growing areas in delta are not completely protected against a periodic saltwater intrusion even in rainy season [30]. According to the record form Department of Meteorology and Hydrology, the flow of saline water into the inland part of the Labutta was increasing significantly, especially in 2009, 2010 and 2012 due to sea level rise, seasonal river runoff and flooding after serious impacts of Cyclone Nargis in 2008. In wet season, average peak mean monthly flow was 35,000 to 40,000 cumec (cubic meter per second) with a variance of about 25%. In dry season, mean minimum upland flow was about 2500 cumec for a period of four months between January and April [4]. During this period, there is little or no rainfall in the delta and the level of salinity line reached the maximum in April (Figure 4), while the downstream flow of fresh water becomes very low. Therefore, salinity in the soil and water was highest in the dry months and the salts in the upper soil surface layers of low land rice field become concentrated through evaporation.
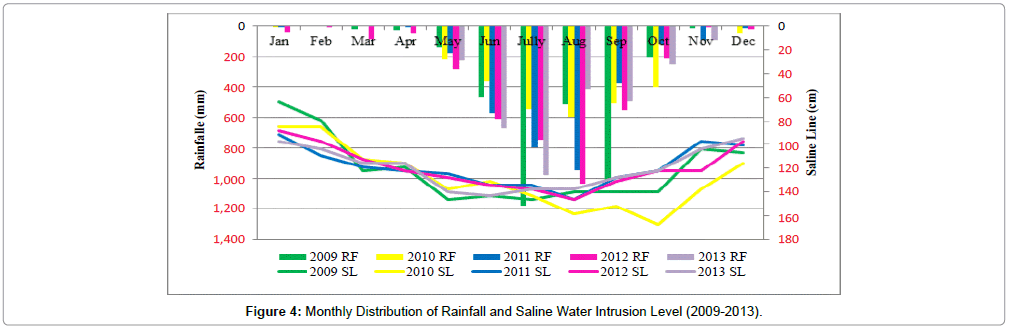
Figure 4: Monthly Distribution of Rainfall and Saline Water Intrusion Level (2009-2013).
Research Method
This study mainly focused on primary data collected through the household survey of rice farmers conducted from December 2012 to August 2013. The secondary data such as rainfall data and saline water level were collected from Department of Meteorology and Hydrology (DMH) and Irrigation Department (ID). Demographic, land use and crop production data were obtained from Settlement and Land Record Department (SLRD) and Department of Agriculture (DoA) of labutta Township and Ayeyarwady Region. Labutta is comprised of one Sub Township, 13 wards, 61 village tracts and 483 villages. Among the 61 village tracts, only 10 village tracts are located in the inland part. In the period of 1982 to 1989, nine village tracts of Labutta were protected with embankment with the help of the World Bank, enabling farmers to grow summer rice and other winter crops in dry months with pumping river water. However, other areas could not get such an infrastructure support from Government to prevent the saline water intrusion. Therefore, respondent rice farming households in two different situations of saline water intrusion area (with and without embankment) were sampled. A comparison of the two farmer groups in terms of such an institutional support with the adoption of agricultural management practices will suggest the important policy implications for regional sustainable adaptation practices.
Four village tracts in non-embankment area, namely SarKyin, Ah Mat, Tha Byu Kone, Kyauk Hmaw and three village tracts in embankment area, namely Myo Ma, Nyaung Lein, La Put Ta Loat were selected for the household survey. The total households in nonembankment area were 1,650 and those in embankment area were 1136. To cover the minimum sample size calculated by Yamane (1967: 886), 240 sample respondents, 135 farmers (without embankment) and 105 famers (with embankment) were selected through the simple random sampling. Sample households were interviewed by setting up semistructure questionnaires. The types of research used in this study were exploratory and descriptive aiming to estimate how farmers are trying to cope with current climate change and which factors are influencing their adaptation practices.
Empirical specification of variables and model
Many studies described the various models that investigate the factors influencing the adaptation to climate change. Several studies revealed that simple linear regression models or bivariate analysis can be used as a good analytical tool to find out the correlation between adaptation practices and other factors [15,20,31-33]. However, some studies pointed out that multivariate analysis can be used when farmers adopted more than a single adaptation practice [16,21,34,35].
Response variables (Agricultural adaptation practices)
Depending on different geographical location, agricultural adaptation practices adopted by farmers are quite different. Nonembankment area was mainly constrained and unprotected by inflow of saline water in the summer season, relatively; farmers in that area are more vulnerable and applied a higher number of adaptation practices to better respond to salinity. Apart from common adaptation practices used in both areas (saline resistant and short-lived rice varieties, transplanting, shortening the lifespan and application of compost, manure), non-embankment farmers adopted more soil and water management practices such as gypsum application, intermittent flooding, desalinization and building the small embankment than embankment farmers. Some practices, such as use of saline resistant perennial crops, making the drain furrows and growing legumes, adopted by less than 10% of farmers were not taken as common adaptation practices and omitted from the models. Nine adaptation practices for NEMB area and six practices for EMB area are set up as binary response variables in each model (Table 1). Farmer who has either adopted or not adopted any common adaptation practices stated above is assigned with the values of 1 or 0, respectively.
Explanatory variables (Socio economic, institutional and farm characteristics)
Initially, 19 variables were selected for Variance Inflation Factor (VIF) analysis to detect the multicollinearity. It is a measure of how much variance of the estimated regression coefficient is inflated by the existence of the correlation among the predictors in the model. A VIF of 1 means that there is no correlation among the predictor and the remaining predictor variables, and hence the variance is not inflated at all. Our analysis results showed that there was no multicollinearity given the VIF values of 12 variables which ranged from 1 to 2 (Table 4) and were selected as explanatory variables for the multivariate probit model.
Multivariate probit model
A strong point of the multivariate probit model is that it can observe the explanatory variables influencing each of the different adaptation practices and can consider the possible interrelations between the various practices, while allowing the unobserved and/or unmeasured factors (error terms) to be freely correlated [36].
In order to identify factors influencing agricultural adaptation practices against rainfall variability and salinity, two multivariate probit models have been employed. First model covers the farmers in the nonembankment area and the second model presents the embankment farmers. The simple equation of the probit model can be described using the following equation 1:
 (1)
(1)
where Pr denotes the probability; Y is the binary response variable (1, 0); X is the explanatory variables; Ø is the cumulative distributive function of standard normal distribution; and β is the parameter estimation of maximum likelihood.
The probit model can be modified as the latent variable model as described below in equation 2:
 (2)
(2)
Where Y* is assumed to be a linear relation with observed variable, X ′ , while the unobserved characteristics are captured by stochastic error term (ε) with a standard normal distribution.
Univariate probit model can be applied if farmers’ adoption of each particular practice is independent (farmers’ adoption of one farming practice does not alter the prediction of the probability that they will adopt another practice). However, this approach does not satisfy inter dependent adaptation options due to the failure of estimation of unobserved factors affecting different adaptation practices and ignore the potential correlation among the unobserved disturbances in different adaptation practices. In our study, when farmers adopted more than one adaptation practice as complementary or competing, we considered the equations of multivariate probit model as follows:

 (3)
(3)
The assumption in equation 3 is that the characteristics of households and other factors will affect the choice of different adaptation practices, as well as unobserved characteristics captured by stochastic error terms with multivariate normal distribution, with zero conditional mean and variance normalized to unity where 
 (4)
(4)
The correlation matrix in equation (4) explains the unobserved correlation between the stochastic component of the mth different adaptation practices and adoption decision of farmers on particular practices. The off-diagonal elements in the matrix (correlation across the error terms of several latent equations) represent the unobserved characteristics that affect the choice of alternative adaptation practices and the sign of correlation can be positive (complementary) and negative (substitutability) between different adaptation options. The analyses were done using Stata Statistical Software (Release 12.0, Stata Corp., College Station, TX).
Results and Discussion
Empirical results of the survey data were discussed in two parts. The first part describes the descriptive statistics of the socio-economic conditions, farm characteristics and agricultural adaptation practices adopted by farmers. The second part presents the factors influencing the farmers’ choice of adaptation practices between embankment (EMB) and non-embankment (NEMB) areas of Labutta, Ayeyarwady delta.
Profile of the sample farmers
The key characteristics of the sample household, which are denoted as explanatory variables in the model, are summarized in Table 1. In terms of socio-economic status, several characteristics such as educational level, land ownership, number of family members involved in farming activities and farming experiences are not significantly different between NEMB and EMB farmers. On an average, the educational level of farmers in both areas is above primary and both NEMB and EMB farmers have good literacy and numeracy skills. In both areas, farmers have been engaging in rice growing since last 20 years. Summer rice cultivation in Ayeyarwady delta has been introduced in 1988 to meet the rice sufficiency policy. Farmers grew monsoon rice as major cropland summer rice, and seasonal vegetables as second crops. In addition to the main livelihood of farming, other income-generating activities in the form of fishing, salt-making, selling vegetables and dry food in the grocery and duck-raising were common amongst the survey farmers, especially in the non-embankment area.
Compared to EMB farmers, farmers in the non-embankment area owned higher land holding size. The proportions of very low land soil were higher in NEMB area, mostly affected by the saline water intrusion and the concentration of salinity in the upper surface soil layer was higher. The cropping intensity of the non-embankment was lower than that of the embankment area. Most of the NEMB farmers fallow their land after monsoon rice cultivation, while EMB farmers can capitalize on summer rice and other winter crops growing by pumping water from the river, subsequently, the average annual farm income between EMB and NEMB farmers differed significantly.
Agricultural adaptation practices to offset the rainfall variability and salinity
Selection of crop variety
Use of short-lived rice varieties: In embankment area, the use of short-lived rice varieties was the most frequently practice adopted by the farmers to match the late or delay rainfall and shorter duration of Monsoon. The adoption rate of short-lived rice varieties in the embankment area, 72%, was significantly higher at 95% confidence interval. This difference can be explained by the contrasting biophysical conditions and accessibility of water in the embankment area. The EMB farmers can grow rice in summer with pumping water from Ywe and Ayeyarwady Rivers. Most of the short lived rice varieties grown in the study area are hybrid rice varieties, namely; Thee Htat Yin (IR 13240- 108-2-3), Sin Thwe Latt, Manawthukha (Mahsuri-M) and Thu Kha Tun (IR-24 mutant) and their life span was shorter (110 days to 135 days) than local rice varieties which have 150 to 180 days of lifespan. Farmers reported that they changed from growing of traditional long-lived rice varieties to short-lived rice varieties to skip the late rainfall distribution at the sowing time. The heredity feature of day fixed maturity of short lived hybrid rice varieties enables the farmers to adjust the sowing and harvesting time. Besides, their growing period did not last more than 4 months and the possibility of catching the late rainfall was very low.
Use of salt tolerant rice varieties: Use of salt tolerant rice varieties is one of the ways that farmers coped with salinity. Compared to the EMB area, the number of farmers adopting saline resistant variety was significantly higher in the NEMB area at 99% confidence interval. This explains why farmers in the NEMB area are more vulnerable to salinity. The NEMB farmers also mentioned that they could not take any proper measures other than growing of salt-tolerant rice variety in case of prolonged seawater encroachment into the rice field due to unusual high tidal fluctuation. Farmers reported that they chose indigenous rice varieties; namely Let Yone Gyi, Mee Done and Nga Sein due to their some level of tolerant to salinity although these cultivars are tall, photosensitive and low yielding compared to improved varieties. However, improved salt-tolerant varieties such as Shwe Thwe Yin and Sin Thwe Latt, distributed from the research farm of DoA were not enough and only a small percentage of farmers can use it. Based on the information obtained through the household survey, although the yield of local salttolerant variety was lower than that of the improved or hybrid variety, the tolerance and hardening to submerged condition was more vigor in the local variety.
Cultural management practices
Change from direct seeding to transplanting: In both areas, transplanting is the most frequently used adaptation option by farmers to reduce the negative impact of saline water intrusion, uncertainties of rainfall and possibilities of flooding after seeding. The adoption rate of transplanting was 74% in the NEMB area and 67% in the EMB area (Table 1). Farmers practiced transplanting method to cope with the likely failure of crop establishment at the seedling stage although it was more labor-intensive and did not have operational simplicity like direct seeding. Findings from field research of [37] revealed that rice plant was more sensitive to salinity at its seedling stage than other growing stages although salinity can affect all the growth and development stages. Since the farmers adjusted the age of seedling in the nursery plots and transplanted into the rice field as soon as the saline water was flowing out from the rice field, rice seedlings were not much affected by water salinity. In case of transplanting, farmers used the straight row planting using 2-3 seedlings per hill at a (15 cm × 20 cm ) spacing in hybrid variety and (25 cm × 25 cm) in local variety for good plant population density and other operations such as weeding and fertilizer application.
Shortening the lifespan of long-lived local rice varieties: One third of farmers in both areas shorten the lifespan of long-lived local rice varieties in order to match with late onset of rainfall (Table 1). Most of the local rice varieties are photoperiod- sensitive and have a longer lifespan between 150 to 180 days. In this case, photoperiod sensitivity may work as a safety mechanism in case of unfavorable environmental conditions [38]. If the date of sowing or transplanting is delayed for one or two weeks because of insufficient rainfall or prolonged saline water flooding, a photoperiod-sensitive cultivar may still mature at its usual time, suggesting that farmers can shorten the lifespan relative to the expected growing period. Based on their indigenous knowledge, farmers have experienced the flowering of respective rice varieties (e.g., the flowering time is 3rd week of October for Paw Hsan Yin variety and 4th week of November for Paw Hsan Hmwe) and shifted the sowing time from June 4th week to July 2nd week to catch the late rainfall distribution. By shortening the lifespan, the plant height becomes shorter and more resistant to heavy rainfall and strong wind.
Soil fertility management practices
Growing legumes after monsoon rice: In rice-based cropping system, intercropping, or successive cropping of leguminous crops not only increases the rice yield but also reduces the soil salinity, especially, exchangeable sodium and improves soil physical conditions to keep lands productive on the sustainable basis [39,40]. Although farmers are aware that growing legumes after rice was efficient to enhance the soil fertility and sustain the rice productivity, only a few (16% in EMB area) adopted it due to the fact that the pulses are less profitable than the summer rice. In contrast, the common practice of most farmers in the NEMB area is to leave the land fallow after harvesting the monsoon rice. This could be due to the higher concentration of salt accumulation in the upper soil layer in the summer, which makes it unfavorable to grow any other crops. According to the focus groups’ discussion of the survey, farmers reported that the soil fertility level of rice field was significantly progressive within two or three years of growing legumes after monsoon rice. Farmers start the relay cropping of several legumes such as green gram, black gram and bocate bean by broadcasting about two weeks before harvesting the monsoon rice to obtain moisture enough for a second crop.
Application of gypsum: Application of gypsum was considered to be a potential method of farmers in the NEMB area to remedy the soil salinity problem. However, it was the second least adaptation practice in the NEMB area adopted by only 14% of farmers because of its high price and unavailability in the market. Farmers reported that they applied gypsum by mixing with farm yard manure (FYM) to reduce soil pH level. Gypsum is calcium sulfate and is typically used as a source of calcium to remove exchangeable sodium. [41] mentioned that rice grown in saline soil with the application of gypsum and FYM gave a nearly doubled yield in spikelet fertility compared to the rice growing without the gypsum and FYM treatment. The similar finding by [42] also proved that application of gypsum to the salt-affected soil decreased soil pH level and increased root length of rice plant and paddy yield from 695.7 kg/ha to 1644 kg/ha.
Application of compost/manure: Since farmers owned several farm animals such as buffaloes, cows and poultry, application of compost and manure in the form of organic fertilizer was the most common soil management practices adopted in both areas. Farmers made compost from available by-products from farm such as straw, rice stubbles and dry cow and buffalo’s dungs. Another compost formulation applied by farmers was Bokashi by mixing of effective microbes (EM) concentrated solution and rice straw. Farmers reported that application of compost and manure in the rice field improves the fertility of the soil which was spoiled by salinity. The average rate of manure used by the EMB farmers (4.59 tons/ha) was significantly higher than that used by the NEMB farmers (3.49 tons/ha) (Table 1).
| Variables | Description | NEMB | EMB | p | ||
|---|---|---|---|---|---|---|
| HH (%) | Mean CA |
HH (%) |
Mean CA |
|||
| Response Variables | ||||||
| • Short-lived rice varieties | Dummy, takes the value of 1 if adopted and 0 otherwise | 46 | 1.34 | 72 | 2.15 | 0.005** |
| • Salt tolerant rice varieties | Dummy, takes the value of 1 if adopted and 0 otherwise | 68 | 2.40 | 46 | 1.06 | 0.000*** |
| • Changing from direct seeding to transplanting | Dummy, takes the value of 1 if adopted and 0 otherwise | 74 | 2.68 | 67 | 2.23 | 0.185 |
| • Shortening the lifespan of long lived rice | Dummy, takes the value of 1 if adopted and 0 otherwise | 30 | 0.13 | 30 | 0.20 | 0.511 |
| • Growing legumes after monsoon rice | Dummy, takes the value of 1 if adopted and 0 otherwise | 1 | 0.01 | 16 | 0.14 | 0.004** |
| • Application of Compost/ Manure (tons/ ha) | Dummy, takes the value of 1 if adopted and 0 otherwise | 59 | 3.49 | 53 | 4.59 | 0.023* |
| • Application of Gypsum (kg/ha) | Dummy, takes the value of 1 if adopted and 0 otherwise | 14 | 51.87 | 3 | 16.93 | 0.033* |
| • Desalinization (Catch the rain water and leaching off surface saline soil before growing) | Dummy, takes the value of 1 if adopted and 0 otherwise | 32 | 2.82 | 6 | 0.17 | 0.000** |
| • Intermittent flooding with fresh water | Dummy, takes the value of 1 if adopted and 0 otherwise | 48 | 4.32 | 2 | 0.5 | 0.000** |
| • Building the small embankment | Dummy, takes the value of 1 if adopted and 0 otherwise | 22 | 2.10 | 1 | 0.04 | 0.000** |
| Explanatory variables | Mean | Mean | ||||
| Farm size | Continuous, land holding size of farmers in hectares | 8.21 | 5.08 | 0.000*** | ||
| Educational level | Continuous, number of schooling years of household head | 6.97 | 7.14 | 0.676 | ||
| Family agricultural labor | Continuous, number of family members involved in farm | 2 | 2 | 0.255 | ||
| Land Ownership | Dummy, takes the value of 1 if household head is land owner and 0 otherwise | 0.95 | 0.96 | 0.808 | ||
| Farming experience | Continuous, number of farming years by household head | 23 | 25 | 0.439 | ||
| Farm income | Continuous, total farm income in USD | 1127.97 | 2745.85 | 0.000*** | ||
| Non-farm income | Continuous, total non-farm income in USD | 544.32 | 285.75 | 0.017* | ||
| Extension Frequency | Continuous, frequency of extension (visits from DoA) accessed by farmer per a crop season | 1.02 | 1.25 | 0.211 | ||
| Training Frequency | Continuous, frequency of training attended by farmer | 0.67 | 0.57 | 0.132 | ||
| Institutional credit | Continuous, credit from MADB and NGO in USD | 484.60 | 380.27 | 0.001*** | ||
| Access to climate information | Dummy, takes the value of 1 if household access climate information from office or media and 0 otherwise | 0.75 | 0.86 | 0.023 | ||
| Very low land soil | Dummy, takes the value of 1 if part of the farm has very lowland soil and 0 otherwise | 0.61 | 0.13 | 0.000*** | ||
Table 1: Description of adaptation practices (response variables) and explanatory variables.
Source: Survey data, 2012; *** ,* * , *significant at 1% , 5% and 10% level, CA Cropped area out of total area, 1 USD=980 Kyats , 1 ha=2.47 acres
Water management practices
Intermittent flooding: In the NEMB area, intermittent flooding was the most common water management practice and nearly half of the farmers are adopting it. Intermittent flooding is an effective adaptation measure to mitigate the severe effects of salinity on rice plant [43]. In the intermittent condition, rice fields should be kept moist but not continuously flooded in order to minimize the anaerobic conditions that hamper the growth of roots and soil microorganisms [44]. Farmers did intermittent flooding by irrigating the fresh water to reduce the salinity level of sea water which submerged the rice field for a prolonged period. If fresh water is available for irrigation, allow soil particles to settle after puddling, before the saline water is drained out the field. Drainage has been done as soon as the tidal flow discharged from the peak level. In other words, intermittent flooding is called alternate wet/dry method which is the efficient water management practice by saving 15% of water consumption and reduced the emission compared to the continuous flooding.
Desalinization: One third of the farmers in the NEMB area practiced desalinization to dilute soil salinity to some extent by washing off the salt accumulated in the upper surface soil layer. Naturally, salinity level in soil and water can decrease progressively after the monsoon rains washed and leaching off the soil. Farmers reported that they used the process of catching rain water in the field and drained out several times till the salinity level of the soil reached to the minimum. Bring the salinity of the soil to the minimum level by repeatedly flushing excess soluble salts especially in extreme saline areas. If rain water is not available, they repeated the whole procedure of the whole flushing with irrigated water or ponding fresh water into the field. The salinity of the soil is low at the end of the process as a result of natural salt dilution by rain or by efficient water management practice.
Building the small embankment: Improving the dykes surrounding the rice field to prevent the physical intrusion of saline water is one of the adaptation practices of the NEMB area and 22% of farmers are adopting it. This was done by the farmers by constructing the small dykes with the use of either wooden planks or concrete blocks and increasing its height by putting more mud that will eventually dry up. They make a small inlet outlet break to serve as entry point of fresh irrigation water and outlet for flushing brackish water. However, farmers complained that their small embankment was easy to breakable in case of heavy rainfall and serious flooded condition.
Factors influencing the agricultural adaptation practices
Based on findings of the multivariate probit (MVP) models, the difference, similarities and significance of the factors influencing the adoption of agricultural adaptation practices in the EMB and NEMB areas were discussed in this section. Empirical results of the multivariate probit models showed that the correlation coefficients of the error terms in both models had positive as well as negative signs, indicating that there is interdependency between the different adaptation practices adopted by the farmers. In other words, these opposite signs of the coefficients revealed that the practices used by the farmers are complementarities or substitutability to each other.
Results of the MVP models for the NEMB (Wald χ2 (108)=163.01; log likelihood=-577.53; Probability>chi2=0.00005) and EMB farmers (Wald χ2 (72)=115.12; log likelihood=-305.49; Probability>chi2= 0.00009)–indicated the relevance of both models for explaining the factors influencing the adaptation of rice farmers to respond to rainfall variability and salinity. Furthermore, results of likelihood ratio test in both models (LR χ2 (36)=79.11; Prob> χ2=0.0000 in NEMB model) and (LR χ2 (15)=23.22; Prob>χ2=0.0796 in EMB model) indicated that the independence of the disturbance terms (independence of multiple adoption) is strongly rejected and there is significant joint correlations of the several estimated coefficients across the equations in the models (Tables 2 and 3). It further suggested that multiple adaptation practices in the EMB and NEMB areas of Labutta are not mutually independent and support the use of a MVP model.
| Explanatory variables | Crop Variety Selection | Cultural Management | Soil Management | Water Management | |||||
|---|---|---|---|---|---|---|---|---|---|
| Short-lived rice | Salt tolerant rice | Transplanting | Shortening the lifespan of long-lived rice | Compost/ Manure Application | Gypsum Application | Desalinization | Intermittent Flooding | Building the small embankment | |
| Constant | -0.475 (1.00) |
-2.343* (1.099) | 0.064 (1.043) |
-1.067 (0.971) |
-0.176 (0.951) |
-5.434 (101.73) |
-2.010* (1.209) | -2.727** (1.209) | -3.246* (1.351) |
| Farm size | -0.060* (0.035) | 0.085* (0.038) | 0.070* (0.040) | 0.005 (0.027) |
-0.028 (0.025) |
-0.008 (0.034) |
0.017 (0.030) |
0.026 (0.026) |
0.083 (0.035) |
| Educational level | 0.015 (0.042) |
0.014 (0.045) |
0.007 (0.043) |
0.006 (0.043) |
-0.002 (0.036) |
0.014 (0.054) |
-0.068 (0.051) |
0.072* (0.044) | -0.045 (0.052) |
| Family agricultural labor | 0.178 (0.126) |
0.186 (0.128) |
-0.038 (0.138) |
0.020 (0.122) |
0.036 (0.124) |
0.291* (0.151) | 0.216 (0.149) |
0.014 (0.125) |
0.144 (0.142) |
| Land Ownership | -0.760 (0.667) |
1.727* (0.753) | 0.517 (0.761) |
0.427 (0.685) |
-0.386 (0.629) |
3.430 (101.73) |
0.515 (0.828) |
0.838 (0.684) |
0.972 (0.921) |
| Farming experience | 0.001 (0.011) |
-0.012 (0.011) |
-0.006 (0.012) |
0.004 (0.012) |
0.002 (0.011) |
-0.002 (0.014) |
-0.014 (0.014) |
0.031* (0.012) | -0.010 (0.014) |
| Farm Income | 3.04E-07** (0.000) | 1.76E-07 (0.000) |
-2.08E-07* (1.16E-07) | 2.54E-08 (9.59E-08) |
2.47E-07* (9.93E-08) | 2.33E-07* (1.12E-07) | -3.33E-07* (1.29E-07) | 9.24E-09 (9.54E-08) |
-4.63E-07** (1.38E-07) |
| Non-farm Income | 4.17E-08 (0.000) |
6.24E-08 (0.000) |
3.51E-08 (1.36E-07) |
1.34E-07 (1.20E-07) |
4.29E-08 (1.21E-07) |
-1.37E-07 (1.78E-07) |
4.81E-07** (1.76E-07) | 9.39E-08* (1.30E-07) | 1.75E-07 (1.57E-07) |
| Extension Frequency | 0.096 (0.090) |
-0.016 (0.093) |
-0.097 (0.093) |
0.127 (0.088) |
0.012 (0.085) |
0.099 (0.102) |
-0.018 (0.125) |
-0.196* (0.093) | 0.021 (0.112) |
| Training Frequency | 0.248 (0.269) |
0.448* (0.258) | -0.243 (0.264) |
-0.441* (0.255) | 0.359 (0.254) |
0.420 (0.352) |
-0.061 (0.297) |
0.141 (0.262) |
0.260 (0.313) |
| Institutional credit | 1.31E-06* (0.000) | 3.06E-07 (0.000) |
-0.026 (6.21E-07) |
-8.32E-07 (5.95E-07) |
5.42E-07 (5.25E-07) |
-4.83E-07 (7.46E-07) |
3.06E-07 (7.18E-07) |
7.85E-07 (5.58E-07) |
5.44E-07 (6.10E-07) |
| Access to climate information | -0.093 (0.297) |
0.193 (0.303) |
-0.025 (0.307) |
0.395 (0.301) |
0.397 (0.287) |
0.035 (0.376) |
-0.591 (0.369) |
-0.186 (0.281) |
0.465 (0.386) |
| Lowland soil | -0.190 (0.269) |
0.010 (0.259) |
0.064 (0.282) |
0.104 (0.267) |
-0.358 (0.262) |
-0.054 (0.348) |
2.204** (0.480) | 0.475** (0.264) | 0.808* (0.373) |
| Observations | 135 | ||||||||
| Log Likelihood | -577.53 | ||||||||
| Wald χ2(108) | 163.01 | ||||||||
| Prob>χ2 | 0.00005 | ||||||||
| Rho1 | Rho 2 | Rho 3 | Rho 4 | Rho 5 | Rho 6 | Rho 7 | Rho 8 | Rho 9 | |
| Rho2 | -0.127 (0.150) |
||||||||
| Rho3 | -0.283* (0.138) |
-0.277* (0.153) |
|||||||
| Rho4 | -0.254* (0.142) |
-0.159 (0.150) |
0.433** (0.140) |
||||||
| Rho5 | 0.147 (0.139) |
0.151 (0.137) |
-0.026 (0.156) |
-0.134 (0.138) |
|||||
| Rho6 | -0.144 (0.172) |
-0.153 (0.175) |
-0.094 (0.176) |
0.223 (0.172) |
0.391* (0.180) |
||||
| Rho7 | -0.134 (0.168) |
-0.262 (0.163) |
0.407** (0.133) |
0.303* (0.142) |
0.143 (0.157) |
0.214 (0.200) |
|||
| Rho8 | 0.025 (0.143) |
-0.277 (0.140) |
0.015 (0.163) |
-0.123 (0.132) |
-0.429** (0.121) |
-0.262 (0.230) |
-0.189 (0.177) |
||
| Rho 9 | -0.223 (0.155) |
-0.416** (0.153) |
0.385** (0.139) |
0.317* (0.156) |
-0.027 (0.180) |
0.291 (0.181) |
0.857** (0.098) |
-0.129 (0.166) |
|
Likelihood ratio test of rho21=rho31=rho41=..... =rho87=rho97=rho98=0: chi2(36)= 79.1144 Prob>chi2=0.0000
Standard errors are given in parenthesis
***, **,*, Significant at 1%; 5% and 10 % respectively
Table 2: Multivariate Probit Model: Factors Influencing Agricultural Adaptation Practices to Rainfall Variability and Salinity (NEMB Farmers).
| Crop Variety Selection | Cultural Management | Soil Management | ||||
|---|---|---|---|---|---|---|
| Explanatory variables | Short lived rice | Salt tolerant rice | Transplanting | Shortening the lifespan of long-lived rice | Compost/ Manure Application |
Growing Legumes after Monsoon Rice |
| Constant | 3.192 (13.67) |
0.591* (1.848) |
0.165 (1.046) |
0.355 (1.060) |
2.271* (1.144) |
-1.398 (1.222) |
| Farm size | 0.023 (0.059) |
0.092* (0.055) |
0.021 (0.046) |
0.020 (0.049) |
0.101* (0.049) |
0.085* (0.049) |
| Educational level | 0.004 (0.052) |
0.037 (0.055) |
0.050 (0.045) |
-0.037 (0.050) |
-0.087* (0.051) |
-0.065 (0.054) |
| Family agricultural labor | 0.191 (0.143) |
-0.118 (0.174) |
-0.160 (0.131) |
0.079 (0.138) |
0.010 (0.131) |
0.103 (0.149) |
| Land ownership | -3.933 (13.67) |
-1.135 (1.581) |
0.030 (0.659) |
-0.757 (0.736) |
-0.087 (0.724) |
0.436 (0.833) |
| Farming experience | 0.000 (0.014) |
0.003 (0.014) |
-0.006 (0.012) |
-0.009 (0.013) |
-0.009 (0.013) |
0.015 (0.014) |
| Farm income | 1.13E-07* (6.33E_08) |
-4.59E-07*** (1.07E-07) |
1.24E-07* (5.62E-08) |
1.78E-07 (7.57E-08) |
2.67E-07*** (6.38E-08) |
+1.59E-07* (7.46E-08) |
| Non-farm income | 1.14E-07 (2.26E-07) |
7.97E-08 (2.92E-07) |
-2.08E-07 (2.42E-07) |
3.17E-07 (2.63E-07) |
-2.94E-07 (3.01E-07) |
-7.41E-10 (3.13E-07) |
| Extension Frequency | -0.002 (0.099) |
-0.026 (0.109) |
-0.077 (0.096) |
0.158 (0.109) |
-0.024 (0.101) |
0.007 (0.120) |
| Training Frequency | 0.786** (0.304) |
0.415 (0.338) |
-0.668* (0.292) |
-0.611* (0.307) |
-0.696* (0.324) |
0.539 (0.364) |
| Institutional credit | -2.68E-07 (1.03E-06) |
2.22E-06* (1.06E-06) |
1.06E-06 (9.40E-07) |
8.97E-07 (9.65E-07) |
-2.19E-06* (1.13E-06) |
-8.48E-07 (1.05E-06) |
| Access to climate information | 0.263 (0.439) |
-0.261 (0.623) |
-0.295 (0.413) |
0.255 (0.463) |
0.269 (0.489) |
0.151 (0.503) |
| Low land | -0.418 (0.409) |
1.018* (0.503) |
0.773* (0.416) |
-0.268 (0.427) |
-0.203 (0.408) |
-0.964* (0.498) |
| Observations | 105 | |||||
| Log Likelihood | -305.49 | |||||
| Wald χ2(72) | 115.12 | |||||
| Prob>χ2 | 0.00009 | |||||
| Rho 1 | Rho 2 | Rho 3 | Rho 4 | Rho 5 | ||
| Rho2 | -0.584*** (0.158) |
|||||
| Rho3 | -0.426** (0.160) |
-0.188 (0.207) |
||||
| Rho4 | 0.131 (0.189) |
0.117 (0.183) |
-0.141 (0.169) |
|||
| Rho5 | -0.300* (0.165) |
0.113 (0.205) |
-0.053 (0.182) |
0.319* (0.172) |
||
| Rho6 | -0.188* (0.207) |
0.018 (0.218) |
-0.139 (0.197) |
0.242 (0.175) |
-0.119 (0.198) |
|
Likelihood ratio test of rho21=rho31=rho41 ....rho54=rho64=rho65 = 0: chi2 (15)=23.2178 Prob> chi2=0.0796
Standard errors are given in parenthesis
***,**,*, Significant at 1%; 5% and 10 % respectively
Table 3: Multivariate Probit Model: Factors Influencing Agricultural Adaptation Practices to Rainfall Variability and Salinity (EMB Farmers).
| Variables | VIF | |
|---|---|---|
| NEMB | EMB | |
| Farm size | 1.47 | 1.58 |
| Educational level | 1.47 | 1.21 |
| Family agricultural labor | 1.15 | 1.24 |
| Land Ownership | 1.25 | 1.09 |
| Farming experience | 1.24 | 1.21 |
| Farm income | 1.37 | 1.22 |
| Non-farm income | 1.09 | 1.14 |
| Extension Frequency | 1.22 | 1.16 |
| Training Frequency | 1.14 | 1.23 |
| Institutional credit | 1.24 | 1.07 |
| Access to climate information | 1.23 | 1.16 |
| Very low land soil | 1.21 | 1.16 |
| Mean VIF | 1.23 | 1.17 |
Table 4: Multicollinearity of Explanatory Variables.
The combination of interdependent adaptation practices may represent the best compromise between climate variability and rice productivity. For instance, combining salt-tolerant rice varieties with suitable management strategies is crucial for farmers to combat the unwanted effects of salinity on rice plants, following the model results of the positive relation between salt-tolerant varieties and the application of compost (Tables 2 and 3). Likewise, farmers practiced proper soil and water management practices such as desalinization, constructing the small own embankment to improve crop establishment and early growth of rice in salt-affected areas (Table 2). It can be observed that suitable soil and water management practices can considerably enhance and sustain productivity in salt-affected areas when combined with climate-resistant crop variety.
Factors influencing the crop variety selection: In the NEMB area, farm income and institutional credit were positively and significantly associated with the use of short-lived rice varieties at the 95% and 90% confidence intervals, respectively. Similarly, farm size, land ownership and training frequency were positively and significantly correlated with the use of salt-tolerant rice varieties at the 90% confidence interval. However, it was noticed that farm size was negatively and significantly related with the adoption of short-lived rice varieties at the 90% confidence interval (Table 2).
In the EMB area, farm income and training frequency were found to be positively and significantly associated with short-lived rice varieties at 90% and 95% confidence interval, respectively. Likewise, farm size, institutional credit and low land are the most influential factors to determine the adaptation with salt-tolerant rice varieties at the 90% confidence limit. Interestingly, farm income was negatively and significantly correlated with salt-tolerant rice varieties (Table 3).
In both areas, farmers’ choice of short-lived rice varieties was found to be positively and significantly influenced by farm income, suggesting that farmers who have more income have inclination to grow more acres of short lived rice varieties. Contrary to the above findings, in the EMB area, a negative association between farm income and adoption of salt tolerant rice varieties revealed that farmers have no tendency to grow salt tolerant rice varieties if they have more income. Due to the embankment assistance, they are more likely to take the risk of salinity by growing more acres of aromatic or hybrid rice varieties with specific soil and water management practices rather than adopting salt tolerant local rice varieties.
In NEMB area, land ownership is an important factor in choosing salt-tolerant rice varieties. This is in accordance with finding by [45] and land is the secure property of farmers to gamble the games of nature and land-owner farmers are more willing to cope with harsh climate condition than landless or tenant farmers. In contrast, a negative association between land holding size and the use of shortlived rice varieties reported that households with larger farm acres are less likely to grow short-lived rice varieties in all acres of their rice field because they have no embankment protection to control the irregular tidal regimes. This is consistent with the findings that only 25% of total rice field in the non-embankment area was occupied by short-lived rice varieties (Table 1).
Farm size has the most crucial factor in facilitating the adaptation option of salt-tolerant varieties in both areas, indicating that farmers who have greater rice acres are more likely to grow salt-tolerant varieties in order to cope with saline water flooding and soil salinity that adversely affected their rice field. Furthermore, institutional credit plays a crucial role in the management of crop variety, indicating that farmers with access to more subsidized credit contributed from MADB and NGO are more likely to purchase short-lived rice or salt-tolerant rice varieties to reduce rainfall variability and salinity. Likewise, farmers who have access to training are more likely to adopt the crop variety selection. In the study area, DoA is the main service provider and cooperates with other INGOs and local NGOs such as JICA and IRRI for conducting the training. Similar results have been observed by several studies [20,21,23] suggesting that farmers were more likely to adapt if they had access to institutional and technological supports such as adaptable variety, training and credit supply under critical conditions.
Factors influencing the cultural management practices: In the NEMB area, changing from direct seeding to transplanting was found to have a positive association with farm size at the 90% confidence interval, suggesting that farmers who have bigger farm size are more likely to change from direct seeding to transplanting (Table 2). However, a negative association between farm income and transplanting method showed that farmers have not enough income to adopt the transplanting which is more labor- and capital-intensive than direct seeding method. This finding reflects the actual situation of farmers in the NEMB area. The average amount of farm income in the NEMB area was significantly lower than that of the EMB area and NEMB farmers depend on non-farm income to facilitate the higher adaptation cost. This was observed in the positive correlation between non-farm income and transplanting method although it was not significant (Table 2). Contrary to the above finding, in the EMB area, farm income was found to be positively and significantly associated with transplanting at the 90% confidence interval (Table 3). This is because the EMB farmers have higher crop productivity and farm income than the NEMB farmers due to the embankment protection, consequently, farmers who have higher farm income are more willingly to adopt transplanting method.
Interestingly, training was not effective in the adoption of cultural management practices in both areas. In the EMB area, training was negatively and significantly correlated with transplanting and shortening the lifespan of long-lived rice varieties at 90% confidence interval (Table 2). Likewise, training was negatively and significantly correlated with shortening lifespan at 90% confidence interval in the NEMB area (Table 3). To get the accuracy of required growing period, the knowledge and experience in justification of correct flowering and maturity time of relative rice variety is essentially needed. However, knowledge gained from training programs conducted from DoA and NGO may not match with the specialty required for shortening the growing period of long-lived rice varieties as they are focusing on general crop production practices.
Factors influencing soil management practices: Desalinization, application of compost and manure, gypsum supplement, and growing of legumes after monsoon rice are the sustainable ways of coping in the study area to replenish the upper soil layer and impoverishments of soil fertility after prolonged saline water flooded conditions.
In the NEMB area, the most significant variables influencing soil management practices are non-farm income, farm income, family agricultural labor and presence of the lowland soil. It was observed that the adoption of desalinization had a positive and signification association with non-farm income and lowland soil at the 95% confidence interval (Table 2). Contribution from non-farm income greatly supports to adopt the practice of desalinization because farmers can change the monetary value of non-farm income into effective farm input such as diesel, for the purpose of irrigating and pumping the river water with small engine power. Likewise, a positive correlation between lowland soil and desalinization indicated that farmer with higher acres of lowland soil practiced more frequencies of desalinization by catching rain water naturally and flushing out to reduce soil salinity level. Furthermore, farm income and contribution of family labor was also the dominating factors in choosing soil conservation practices such as applications of manure and gypsum (Table 2). The household who had higher farm income and more family members involving in farming activities had more tendency to avoid the impact of soil deterioration due to salinity through efficient soil management practices.
In the EMB area, farm size, and farm income are most influential on the adoption of the practice of growing legumes at 90% and 95% confidence interval, respectively, suggesting that the larger the farm area is, the more the farmers mobilize their resources of capital and farm assets to manage their land (Table 3). However, the significant and negative correlation between credit and compost suggests that farmers are managing to handle the harsh climate condition through simple soil management practices although they did not have access to credit. Likewise, farmers who did not have the regular training attendance and have the low educational level are willing to adopt soil conservation practices. It could be due to the fact that the application of manure and growing legumes are indigenous practices in the study area and farmers do not need any institutional support to modify it.
Factors influencing water management practices: Intermittent flooding and building the small embankment are practices by farm households in the NEMB area of coping with water salinity. Non-farm income, farming experience and educational level of the farmers are the most influential factors in adopting intermittent flooding (Table 2). It was revealed that farmers who had more farming experience and higher educational level may notice the unusual trend of tidal regimes and rainfall variability based on their knowledge and the history of last year’s incidents and can remedy soil salinization by flooding intermittently. Likewise, farmers who had higher non-farm income were more likely to adopt intermittent flooding. However, the negative association between the adoption of intermittent flooding and extension frequency can be attributed to that the NEMB farmers may have less contact with extension workers and the knowledge perceived from extension department is insufficient to solve the problem of soil salinity.
Building the small embankment was positively associated with low land soil and negatively correlated with farm income at 90% and 95% confidence limit (Table 2). A negative association between farm income and small embankment-building revealed that low income farmers are too reluctant to invest their valuable farm income in the embankment construction rather than utilizing other adaptation options. This is consistent with the above findings that farm income was not an influential factor in the NEMB area. The positive and significant correlation between low land soil and small embankment showed that farmers who had more acres of lowland soil had a higher possibility of sea water encroachment, and subsequently, are more likely to make preparedness by constructing the small earthen embankment or dykes on their own.
Conclusion and Policy Implications
Findings of the present study suggest that farmers’ adaptations to or coping with the impacts of rainfall variability and salinity on their rice farming are considerable. They have employed a number of crop, soil and water management practices using their indigenous knowledge and experience under different conditions to lessen their exposure to climate variability and salinity. The most common adaptation initiatives in the NEMB area were transplanting, salt tolerant varieties, application of compost, intermittent flooding and short-lived rice varieties as these practices were adopted by 74%, 68%, 59%, 48% and 46% of the farmers, respectively. Likewise, in the EMB area, the use of short-lived rice varieties, shifting from direct seeding to transplanting, application of compost and manure and salt-tolerant rice varieties were commonly adopted by 72%, 67%, 53% and 46% of the farmers, respectively.
Irrespective of correlation signs, the most significant determinants in adaptations of the NEMB area are farm size, farm income, nonfarm income, training and lowland followed by educational level, family agricultural labor, land ownership, farming experience and the institutional credit. In the EMB area, five variables out of 12, namely; farm size, farm income, training frequency, credit and lowland were most influential on the adoption of agricultural adaptation practices.
Apart from sea level raising and saline water intrusion, monocropping of rice and heavy use of chemical fertilizer in summer rice production push the farmers to meet the challenge of soil and water salinization problems. In the NEMB area, leaving the soil fallow in the dry months is the traditional practice which improve the accumulation of salt in the upper soil layer. In the EMB area, farmers are more interested in growing summer rice than the other crops with the help of irrigated water due to its high yield and good market value. Although summer rice cultivation may be economically viable in the short run, the trade-off between rice productivity and environmental condition cannot be sustainable in the long term. However, farmers are simply unaware of the externalities of the heavy use of chemical fertilizers in summer rice growing. To secure the farm income in a sustainable manner, promoting the agriculture practices to be environmental safely and economically soundly is the optimal way [46]. In the present study, the practice of soil conservation such as growing legumes after monsoon rice was very low and the adoption of this practice depends on the probability of higher farm income and larger farm acres. Likewise, the application of gypsum in the NEMB area was very low, adopted by only 14% of farmers who had higher farm income. To alleviate this problem, the formulation of public policy towards the improvement of soil and water conservation practices is essentially and urgently needed in rice based rainfed lowland system of Ayeyarwady delta.
Apart from the farm income, the other significant household variable in determining the farmers’ adaptations in the NEMB area is non-farm income. After monsoon, the NEMB farmers migrate temporarily to the villages in the EMB area or elsewhere to engage in farm or non-farm activities. The amount of annual non-farm income earning in the NEMB area is twice than that of the EMB area, and subsequently, farmers used their non-farm income to facilitate all the adaptation practices except for gypsum application and intermittent flooding. This explains that non-farm income plays a decisive role in adaptation and corroborates the findings of other studies that nonfarm income is an influencing factor to cope with adverse impacts of climate change [16,47]. Therefore, in the NEMB area, policy instruments that promote the non-farm income-generating activities could be considered. In this regard, such policy instruments should promote the integrated cropping system of rice and livestock raising or rice-fish farming which can be environmentally secure and sustainable for household income.
Interestingly, in both areas, the significant impact of credit and training was found only in farmers’ adaptation with crop variety selection. Specifically, there is no efficient training about cultural and soil management practices. In fact, training support and accessibility of credit are needed to encourage the adoption of efficient cultural practices and soil conservation measures to alleviate poor soil condition and lower productivity. Related to this concern, the training programs of soil conservation and agronomic practices should be conducive in both areas.
Adoption of any simple or technology adaptation requires substantial amounts of investment of labor, human and financial resources. The institutional credit from government and other organizations was also an important factor influencing the farmers’ adaptation. In the study area, most of the farmers are small farmers and do not have the enough capital to operate all the functions of farm-producing. The subsidized credit from Myanmar Agriculture Development Bank (MADB) was allotted per growing acres of farmers. However, farmers did not get the full credit for all growing acres and accessed in partial if they had more than 10 acres. Consequently, farmers have to borrow money from informal sources of credit to augment their insufficient savings. It was found that farmers who got institutional credit distributed by MADB and other NGOs afforded more to increase their farm improvement practices. However, provision credit alone cannot motivate farmers to change their traditional adaptation practice without any theoretical perspective, indigenous knowledge and participation in practical demonstrations and training and frequent access to extension.
The extension access of the farmers in the EMB and NEMB areas did not significantly influence their adaptation practices except for the use of short-lived rice varieties in the EMB area. It can be noticed that the extension service provided by DoA and other local NGOs in the study area was still weak and not linked to each other to approach the efficient adaptation through improved management practices. Progress in technology adoption could be possible only if there is an effective delivery of extension services. At the farm level, extension must be a continuous process to keep pace with the changing technologies being developed and the changing needs of farmers. A good extension system should focus on creating the favorable relationship between extension workers and farmers and improving the mutual understanding in transferring the simple or innovated technology. Farmers’ active participation in training will have a significant impact on the adoption rates in the transformation of technology from field trials and on-farm demonstrations to real field situation. The activities enhancing the farmers’ adaptive capacity will provide farmers with an opportunity to be involved in the adoption process of technology such as understanding, accepting and adopting. Given the significant role played by extension in technology adoption, investment in extension and training should be encouraged.
Acknowledgement
The authors are very grateful to the Norway Ministry of Foreign Affairs (NMFA) for the funding support of this research through Asian Institute of Technology. We would like to convey our sincere appreciation to the district manager and staffs from Department of Agriculture (DoA), Ayeayarwady Region for kindly cooperating and assisting the field survey.
References
- Nicholls R.J, Wong PP, Burkett VR, Codignotto JO, Hay JE, et al. (2007) Coastal systems and low-lying areas.In: Parry ML, Canziani OF, Palutikof JP, van der Linden PJ, Hanson CE (Edn).Climate Change 2007:Impacts, Adaptation and Vulnerability. Contribution of Working Group II to the Fourth Assessment Report of the Intergovernmental Panel on Climate Change, Cambridge University Press, Cambridge, UK 315-356.
- Pandey S, Derek B, David Dawe, Achim D, Samarendu M, et al. (2010) Rice in the global economy: strategic research and policy issues for food security. Los Baños (Philippines): Int Rice Res Inst (IRRI), Philippines.
- Redfern SK,Azzu N,Binamira JS (2012) Rice in Southeast Asia: facing risks and vulnerabilities to respond to climate change. Building resilience for adaptation to climate change in the agriculture sector23: 295-314.
- Myint Aye (2012) Rice bowl of Myanmar: the Ayeyarwady delta and it's water management developments through the ages of paddy production. Presentation from the 2012 world water week international conference, Stockhlom Institute, Sweden.
- UNEP (2010) Assessment of Capacity Gaps and Needs of South East Asia Countries in Addressing Impacts, Vulnerability and Adaptation to Climate Variability and Climate Change,Regional Climate Change Adaptation Knowledge Platform for Asia , Bangkok.
- FAO (2011) Managing climate change risks for food security in Myanmar. Technical reportof the Regional Integrated Multi-Hazard Early Warning System (RIMES), Bangkok.
- Than Mya (2000) Changing faces of the Ayeyarwady (Irrawaddy) Delta (1850–2000). Chao Phraya Delta: historical development. Dynamics and challenges of Thailand’s Rice Bowl12-15.
- KhinOo, MyintTheingi (2010) Impacts of cyclone Nargis on livelihoods, food security and the agriculture sector in Myanmar. SEARCA agriculture and development2012-1.
- FAO (2009) FAO emergency and rehabilitation program in Myanmar. Document, FAO country representative office, Department of Agriculture, Myanmar.
- Simba FM, Chikodzi D, Murwendo T (2012) Climate change scenarios, perceptions and cropproduction: A case study of semi-arid Masvingo Province in Zimbabwe. J Earth Sci ClimateChange 3:124.
- Enete IC (2014) Impacts of climate change on agricultural production in Enugu State, Nigeria. J Earth SciClim Change 5: 234.
- Amir KI, Ahmed T (2013) Climate Change and Its Impact on Food Security in Bangladesh: A Case Study on Kalapara, Patuakhali, Bangladesh. J Earth SciClim Change 4: 155.
- Berman R, Quinn C, Paavola, J (2012) The role of institutions in the transformation of coping capacity to sustainable adaptive capacity. Environ Develop2: 86-100.
- Robledo C, Clot N,Hammill A, Riché B (2012) The role of forest ecosystems in community-based coping strategies to climate hazards: Three examples from rural areas in Africa. Forest Policy Econ24: 20-28.
- Adeniji-Oloukoi G, Urmilla B, Vadi M (2013) Households' coping strategies for climate variability related water shortages in Oke-Ogun region, Nigeria. Environ Develop 5: 23-38.
- Deressa TT, Hassan RM, Ringler C, Alemu T, Yesuf M (2009) Determinants of farmers’ choice of adaptation methods to climate change in the Nile Basin of Ethiopia. Global Environ Change 19: 248-255.
- Eriksen S, Silva JA (2009) The vulnerability context of a savanna area in Mozambique: household drought coping strategies and responses to economic change. Environ Sci Policy12: 33-52.
- ADB (2009) Building Climate Resilience in the Agriculture Sector of Asia and Pacific. International Food Policy Research Institute, ADB, Philippines.
- FAO (2010) Climate smart agriculture, policies, practices and financing for food security, adaptation and mitigation. Technical report of the international conference on agriculture, food security and climate change, Hague.
- Below TB, Mutabazi KD, Kirschke D, Franke C, Sieber S, et al. (2012) Can farmers’ adaptation to climate change be explained by socio-economic household-level variables? Global Environ Change 22: 223-235.
- Bryan E, Deressa TT, Gbetibouo GA, Ringler C (2009) Adaptation to climate change in Ethiopia and South Africa: options and constraints. Environ Sci Policy 12: 413-426.
- Mubaya CP, Njuki J, Mutsvangwa EP, Mugabe FT, Nanja D (2012) Climate variability and change or multiple stressors? Farmer perceptions regarding threats to livelihoods in Zimbabwe and Zambia.J environ manage102: 9-17.
- Chhetri N, Chaudhary P, Tiwari PR, Yadaw RB (2012) Institutional and technological innovation: Understanding agricultural adaptation to climate change in Nepal. ApplGeogr33: 142-150.
- Rodima-Taylor D, Olwig MF, Chhetri N (2012) Adaptation as innovation, innovation as adaptation: An institutional approach to climate change. ApplGeogr33: 107-111.
- Aggarwal P, Baethegan W, Cooper P, Gommes R, Lee B et al. (2010) Managing climatic risks to combat land degradation and enhance food security: key information needs. Procedia EnvironSci1: 305-312.
- Newsham AJ, Thomas DS (2011) Knowing, farming and climate change adaptation in North-Central Namibia. Global Environ Change 21: 761-770.
- Tachie-Obeng E, Akponikpè P, Adiku S (2013) Considering effective adaptation options to impacts of climate production in Ghana. EnvironDevelop5: 131-145.
- Wali MK, Evrendilek F, Fennessy MS (2009) The environment: science, issues, and solutions. CRC.
- Crane T, Roncoli C, Hoogenboom G (2011) Adaptation to climate change and climate variability: The importance of understanding agriculture as performance. NJAS-Wageningen J Life Sci 57: 179-185.
- Driel WF van, Nauta TA (2013) Vulnerability and resilience assessment of the Ayeyarwadydelta in Myanmar, scoping phase. Project report of Global Water Partnership (GWP) and Delta Alliance, Delft-Wageningen, the Netherlands.
- Esham M, Garforth C (2013) Agricultural adaptation to climate change: insights from a farming community in Sri Lanka. Mitigation Adapt Strategies Global Change 18: 535-549.
- Paudel GS, Thapa GB (2004) Impact of social, institutional and ecological factors on land management practices in mountain watersheds of Nepal. ApplGeogr 24: 35-55.
- Rogers M, Curtis A, Mazur N (2012)The influence of cognitive processes on rural landholder responses to climate change. J environl manage111: 258-266.
- Hisali E, Birungi P, Buyinza F (2011) Adaptation to climate change in Uganda: evidence from micro level data. Global Environ Change 21: 1245-1261.
- Bryan E, Ringler C, Okoba B, Roncoli C, Silvestri S, et al. (2013) Adapting agriculture to climate change in Kenya: Household strategies and determinants. J environmanage114: 26-35.
- Kassie M, Jaleta M, Shiferaw B, Mmbando F, Mekuria M (2013) Adoption of interrelated sustainable agricultural practices in smallholder systems: evidence from rural Tanzania. Technol forecast socchange80: 525-540.
- Shereen A, Mumtaz S, Raza S, Khan MA, Solangi S (2005) Salinity effects on seedling growth and yield components of different inbred rice lines. Pak J Bot 37: 131-139.
- Vergara BS, Chang TT (1985) The flowering response of the rice plant to photoperiod: A review of the literature. International Rice Research Institute, Philippines.
- Ali R, Awan T, Ahmad M, Saleem M, Akhtar M (2012) Diversification of rice-based cropping systems to improve soil fertility, sustainable productivity and economics. J Animal Plant Sci 22: 108-112.
- Porpavai S, Devasenapathy P, Siddeswaran K, Jayaraj T (2011) Impact of various rice based cropping systems on soil fertility. J Cer Oil 2: 43-46.
- Cha-um S, Pokasombat Y, Kirdmanee C (2011) Remediation of salt-affected soil by gypsum and farmyard manure-Importance for the production of Jasmine rice. Aus J Crop Sci5: 458.
- Shaaban M, Abid M, Abou-Shanab R (2013) Amelioration of salt affected soils in rice paddy system by application of organic and inorganic amendments. Plant Soil Environ59: 227-233.
- Rezaei M, Davatgar N, KhaledianM R, Pirmoradian N (2013) Effect of intermittent irrigation with saline water on rice yield in Rasht, Iran. ActaagriculturaeSlovenica101: 49-57.
- Noltze M, Schwarze S, Qaim M (2012) Understanding the adoption of system technologies in smallholder agriculture: The system of rice intensification (SRI) in Timor Leste. Agricultsyst108: 64-73.
- Yegbemey RN, Yabi JA, Tovignan SD, Gantoli G, HarollKokoye SE (2013) Farmers’ decisions to adapt to climate change under various property rights: a case study of maize farming in Northern Benin (West Africa). Land Use Policy34: 168-175.
- Thapa G B, Rasul G (2005) Patterns and determinants of agricultural systems in the Chittagong Hill Tracts of Bangladesh. AgricultSyst84: 255-277.
- Abdulai A, CroleRees A (2001) Determinants of income diversification amongst rural households in Southern Mali. Food policy 26: 437-452.
Citation: SeinnSeinn MU, Ahmad MM, Thapa GB, Shrestha RP (2015) Farmers’ Adaptation to Rainfall Variability and Salinity through Agronomic Practices in Lower Ayeyarwady Delta, Myanmar. J Earth Sci Clim Change 6: 258. DOI: 10.4172/2157-7617.1000258
Copyright: © 2015 Seinn Seinn MU, et al. This is an open-access article distributed under the terms of the Creative Commons Attribution License, which permits unrestricted use, distribution, and reproduction in any medium, provided the original author and source are credited.
Select your language of interest to view the total content in your interested language
Share This Article
Recommended Journals
Open Access Journals
Article Tools
Article Usage
- Total views: 19581
- [From(publication date): 2-2015 - Aug 31, 2025]
- Breakdown by view type
- HTML page views: 14485
- PDF downloads: 5096