Farmer's Perceptions and Adaptation Strategies to Climate Change, Its Determinants and Impacts in Ethiopia: Evidence from Qwara District
Received: 24-Jun-2018 / Accepted Date: 09-Jul-2018 / Published Date: 14-Jul-2018 DOI: 10.4172/2157-7617.1000481
Keywords: Adaptation; Climate change; Determinants; Logistic regression; Qwara District
Introduction
Climate change now-a-days is recognized as one of the most challenging and complex problem facing the agricultural development globally [1]. However, the vulnerability of climate change on this sector in Africa is more than any other socioeconomic activities [1-4]. The production of crop yield in Africa will decrease up 50% due to climate change [1]. These effects vary from region to region in particular the risk in Ethiopia becomes more severe since more than 85% of the country’s economy dependent on rainfed agriculture [5]. Booming the agricultural production at the national level leads to improve overall economic growth and development. In this regard, smallholder farmers in developing countries lose their agricultural production due to climate change impacts. The frequent droughts experienced over the last three decades and the recent impacts of El Niño in East African countries in general and Ethiopia in particular, made millions of people food insecure is the result of climate change [6].
Climate change mitigation and adaptation have become instrumental response strategies to climate changes [7-9]. Particularly, adaptation to climate change has been carried out both autonomously as well as being policy driven. In this regard diverse adaptation strategies have been practiced both at individual and group level. Community based adaptation is capable of reducing the vulnerability as well as improving the resilience of the local people to climatic variability and change [3,10,11]. Although subsistence farming has a long history of coping and adapting to some of these changes, effective adaptation strategies and actions should therefore be aimed at securing the well-being of the smallholder farmers in the face of climatic changes. However, until recently, most adaptation efforts have been top-down, and little attention has been paid to communities’ experiences of climatic variability and their efforts to cope with their changing environments [12]. However, the role of adaptation by smallholder farmers plays a great role. For instance, diverse indigenous and autonomous adaptation strategies have been practiced in the areas like selecting crop variety, use irrigation, mixed farming system and sowing early maturing crops [13]. The involvement of multiple stakeholders, including policymakers, extension agents, NGOs, researchers, communities, and farmers makes the adaptation strategy effective. Besides, climate change adaptation is location specific, and its effectiveness depends on local institutions and socioeconomic setting which mediate and translate the impact of external interventions to facilitate adaptation to climate change [14,15].
Smallholder farmers’ perception plays a big role for successful implementation of adaptation strategies to mitigate climate change impacts as agricultural practices concerned [16]. Some of the adaptation measures are crop rotation, mixed farming, early planting, crop diversification and minimum tillage practices. Furthermore, farmers have experiences about the effects of climate change as it is evidenced by late arrival of rainfall, drying up of rivers and springs but the direct impact does not perceive by the local households [1].
Climate change indicators are mentioned in many literatures even though there are spatial temporal variability of the study [3,4,7,9,11,17- 19] Erratic rainfall, drought, flood and change in temperature are the common climate change indicators in many studies.
Smallholder farmer’s perception on determinants and indicators of climate change may vary as some taking a more scientific approach [20- 22]. Level of education, experiences on farming activities, extension services and availability of resources affect the smallholder farmers’ perception on climate change. Therefore, identifying and analyzing the underlying factors that affects the perceptions of farmers are a key step to adopt appropriate adaptation strategies.
Adaptation strategy of climate change impact is mainly depending upon the influencing determinants related to smallholder farmers perception about the phenomena and intervention of the policy to practice properly [23]. Adaptation policy designed by considering the knowledge and perceptions of smallholder farmers can bring fruitful and sustainable adaptation response to effects of climate change [24,25].
Although Qwara district is highly vulnerable to climate change related risks, scientific researches with regard to the stallholder farmers’ perception, determinants, indicators and the possible effects did not study well so far. Therefore, this study tried to assess the farmers’ perception on determinants, indicators, impacts and adaptation strategies of climate change in the district.
Materials and Methods
Study area
Qwara District is found in North Gondar Zone (Figure 1). It is bordered from the south by Benishangul-Gomez Region, from the west by Sudan, from the north by Met Emma, from the East by Takase and Aleta District and from the southeast by Age Awe Zone. The administrative center of this District is Galego with other settlements include Tewodros Keema. The district is 360 Km far from Bahir Dar, which is the capital city of Amhara National Regional State, and 284km from Gander town. It lies between 11°47′ and 12°41′ N latitude and 35°16′ and 36°30′E longitude coordinates. Its altitude ranges from 530 to 1900 meter above sea level, while the temperature ranges from 26°C - 42°C with annual average rainfall 800 mm (State 2017). The rainy season begins in early May and ends in early October. It has 19 kebeles with area coverage of 858588 hectares of which one third (266570 hectare) is covered by Atash national park.
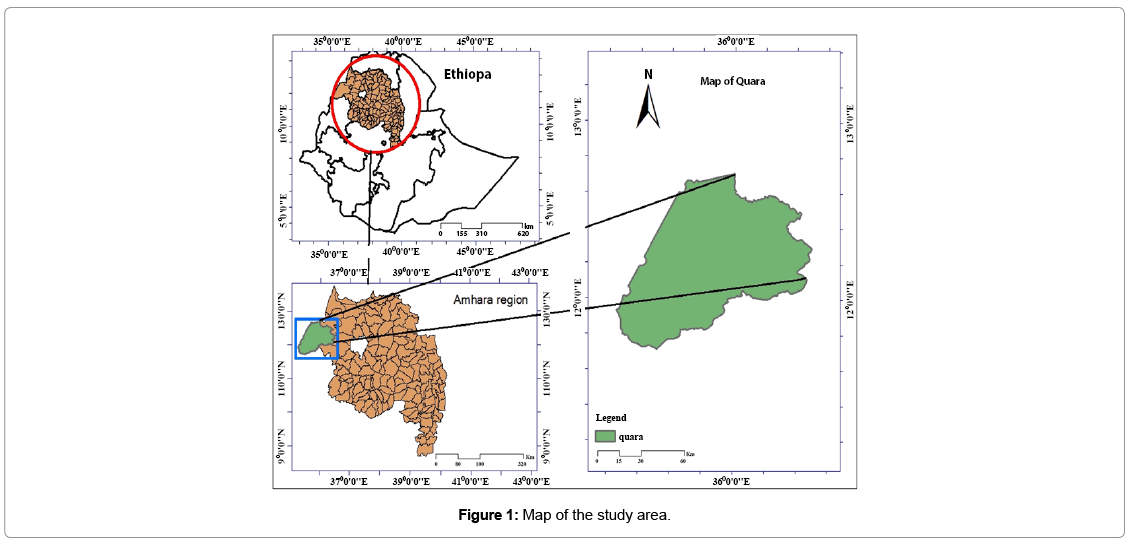
Figure 1: Map of the study area.
Mixed farming system is the common agricultural practice in the district. Both rainfed and irrigation agriculture have been practiced but rainfed agriculture is the dominant one. This study area was selected with the assumption that it represents the dominant agro-ecology with potential rainfed and irrigation farming. Such farming systems are believed to be the sources of diversified information on climate change and its impacts.
Data sources and data collection methods
i. This study employed both qualitative and quantitative data both at community and household level. The qualitative data at community level were collected through Focus Group Discussions (FGDs), key informant interviews (KIIs), and observations. FDGs for this study were held with groups comprising 5-10 individuals per group that were encompassed from different social segments. The participant segments consisted of district experts, Developmental Agents (DA’s), model farmers, and village leaders and elders of the society who are known to have better knowledge on the present and past social and economic status of the area to strength the reliability of a survey. Among the issues included in the checklist for FGD were change in climate variables, the impacts brought due to the change, how the community is responding to the impacts autonomously, and what type of planned climate change adaptation strategies are introduced by government agencies at different levels, and what factors affect their adaptation capacity. Similarly, KIIs were held with experts and administrators from government office and knowledgeable people from the community who have access to climate information regarding the dynamics in climatic parameters, the impacts of climate change, the responses strategies so far practiced to adapt to climate change, and constraints to the adaptation strategies in the area. The data at the household level were collected via household survey. Structured and semi structured questionnaires were distributed for each respondent.
Sampling design and sample size
This study employed multi-staged sampling techniques, where a combination of sampling techniques was used to select the kebeles and households. In order to select these respondents a two-stage sampling approach was employed. First, two Kebeles were selected purposively based on agro-ecological zones and the intensity of the impact of the climate change and variability plus with the assumption that smallholder farmers in each agro-ecology may be different in their ingenuity and traditional knowledge. This means that the variation in skill and knowledge among the different agro-ecologies may result in different adaptive capacity among the communities. As climate change may have differential impact in different agro-ecological zone, the smallholder farmers in the respective agro-ecologies may practice different adaptation strategies. These strategies are also shaped by biophysical, socioeconomic and socio-cultural context of the areas. Second, using systematic random sampling method 100 households were selected from each of the two kebeles proportionally. An element of randomness is usually introduced in systematic sampling method by using random numbers to pick up the unit with which to start. This sampling procedure is useful when sampling frame is available in the form of a list. In such a design the selection process starts by picking some random point in the list and then every anthelmint was selected until the desired number is secured. Finally, the data enumerators were carefully selected and trained on the content of the questionnaire and interviewing procedures.
Description of explanatory variables
In this study, the dependent variable is “farmers’ perception on climate change”. The explanatory variables have been selected based on the characteristics of the surveyed respondents. This study described the relevant explanatory variables and their hypothesized effects (Table 1).
| Variables | Description | Effect |
|---|---|---|
| Dependent | ||
| Farmer perception on climate change | Dummy: 1 If a farmer has perceived climate change, 0 otherwise | - |
| Independent: Household Attributes | ||
| Age (farming experience) | Age of household head in years (continuous) | ± |
| Gender | Dummy: 1 if the respondent is male, 0 otherwise | ± |
| Wealth | Dummy: 1 if the economic category of the household head is rich, 0 otherwise | + |
| Education | Dummy: 1 if the household head is literate (primary, secondary education or read and write), 0 otherwise | + |
| Family size | Total number of household members | + |
| Livestock size | Total number of cattle owned by a farmer | + |
| Independent: Farm Attributes | ||
| Land size | Dummy: 1 if the total land size is larger than 1 ha, 0 otherwise | + |
| Land tenure | Dummy: 1 if a farmer feels land secured 0 otherwise | + |
| Off-farm activities | Dummy: 1 if non-farm income presents, otherwise 0 | - |
| Access to water for irrigation | Dummy: 1 if a farmer irrigates, 0 otherwise | - |
| Access to rain-fed agriculture | Dummy: 1 if a farmer has accessed to rain-fed agriculture, 0 otherwise | + |
| Experience on soil management | Dummy: 1 if a farmer experienced in applying soil management practices, 0 otherwise | + |
| Experience on water harvesting structure | Dummy: 1 if a farmer experienced in applying water harvesting structure, 0 otherwise | + |
| Independent: Biophysical Variables | ||
| Change in temperature | Dummy: 1 if a farmer perceived change in temperature, 0 otherwise | + |
| Change in rainfall | Dummy: 1 if a farmer perceived change in rainfall, 0 otherwise | + |
| Experience on drought frequency | Dummy: 1 if a farmer perceived frequent drought, 0 otherwise | + |
| Change in diseases and pests | Dummy: 1 if a farmer perceived change in diseases and pests, 0 otherwise | + |
| Change in trend of crop types grown | Dummy: 1 if a farmer perceived change in trend of crop types grown, 0 otherwise | + |
| Change in land-use type | Dummy: 1 if a farmer perceived change in land-use type, 0 otherwise | + |
| Changes in vegetation species | Dummy: 1 if a farmer perceived change in vegetation species and diversity, 0 otherwise | + |
| Independent: Institutional Variables | ||
| Access to weather forecast and climate information | Dummy: 1 if a farmer received information, 0 otherwise | + |
| Traditional knowledge of local early warning signs | Dummy: 1 if a farmer uses local early warning signs to predict seasons, 0 otherwise | + |
| Access to extension services (training, advising of technologies) |
Dummy: 1 if a farmer received extension services, 0 otherwise | + |
Table 1: Explanatory variables used in this study.
Methods of data analysis
In this study, data analysis was made using a combination of descriptive statistics and qualitative analysis. Quantitative data on demographic and socioeconomic characteristics of the households were analyzed using descriptive statistics and summarized and presented using frequency, percentage, graphs, and tables. The collected data were entered in Microsoft Excel in 2007 computer software program and analyzed using statistical package for social science (SPSS Version 20) and was described by using descriptive statistics for various parameters. Analysis of variance (ANOVA) was also used. Whereas the qualitative data collected through key informant interviews, focus group discussions, and observational notes were transcribed, categorized, and interpreted. That is, the responses from the various methods looked for their coherence and under separate headings based on the check list as well as based on categories emerging from the interviews themselves. Enumeration was done to identify the recurrence of themes or events. Finally, relationships were established using categories and cause-andeffect relationships.
Descriptive statistics and binary logistic regression modeling were used for data analysis. The binary logistic regression method was also employed to identify the determinant variables that influence farmers’ perception on climate change. It is an appropriate model where the dependent variable is dummy (whether to use coping or adaptation strategies to minimize the adverse effects of climate change and variability or not, specified as yes = 1, 0 = otherwise). Level of significance was taken at p=0.01, p=0.05 and p=0.1 levels for analysis.
This regression analysis is useful for predicting discrete outcome of dichotomous dependent variable from independent variables that may be continuous, discrete, and/or dichotomous [1]. In this study, the dependent variable is dichotomous variable with value 1 or 0 if a farmer is being perceived (1) or not being perceived (0) climate change. Such data were generated from the questionnaire survey as binary response together with a mixture of discrete and continuous independent variables (Table 1). Logistic regression model was chosen over other models such as discriminant analysis model, because of its advantage in mathematical simplicity to give meaningful results. There are no assumption of normality of independent variables and equal variance within each group in logistic regression [1,26,27]. However, discriminant analysis can only be used with continuous independent variables keeping the assumptions of normality and equal variance. Hence, since the independent variables of this study are a mix of continuous and categorical, logistic regression is more preferred and statistically robust in practice than discriminant analysis [1,22].
The binary logistic regression function estimated the likelihood of the effects of the independent variables on the dependent variable is described as:
ln[p/1-p] = βo+ β1X1+ β2X2+ β3X3+...+ βkXk (1)
The quantity [p/(1-p)] is called the odds (likelihoods) ratio, if P is the probability for farmers’ being perceived climate change, then 1- p represents the probability of not being perceived climate change; βo is the intercept, β1, β2, β3… and βk are regression coefficients of the independent variables of X1, X2, X3… and Xk. If the value of the odds ratio is greater than 1, the likelihood of the effect of the independent variable on the dependent variable is increased; odds ratio value of one indicates no relationship and a value less than one indicates negative relationship [1].
Results and Discussion
Farmers’ perceptions to climate change in Qwara district
This study revealed that 90% of the respondents responded that there is a change in climate parameters overtime. Climatic variability was perceived an increasing rate. The farmers also told that previously drought was occurred within ten years interval but now it is observing at a frequency of less than five years.
The respondents indicated that, the observed changes in climate and extreme events over time (Table 2). Regarding the temperature and rainfall, 83.8% of the respondents said that the rainfall has been decreased since the last three decades. On the other hand, 90% of the respondents noted that the temperature is increasing. The respondents observed abnormalities in timing of rainfall and distribution, which have serious consequences for their crop production. These affected a household’s ability to produce seasonally and to grow diversified crops throughout the year. This study is comparable with related works so far [27,28].
| Climate parameters | Respondent’s response | |||||
|---|---|---|---|---|---|---|
| Increase (%) | Decrease (%) | Same (%) | No change (%) | |||
| Rainfall | 83 | 16 | 0 | 1 | ||
| Temperature | 90 | 10 | 0 | 0 | ||
| Wind | 65 | 35 | 0 | 0 | ||
| Rate of Erosion | 7 | 92 | 1 | 0 | ||
| Crop production | 41 | 58 | 1 | 0 | ||
| “Yes” or “no” respondent’s response in percentage (%) | ||||||
| Poverty | Yes | No | ||||
| 55% | 45% | |||||
| Decrease soil fertility | Yes | No | ||||
| 38% | 62% | |||||
Table 2: Perceptions of climate change parameters.
The respondents also indicated that over the last decades they realized early or late onset of rainy seasons, unexpected rainfall, declining rainfall, and extreme day and night temperature. They also emphasized that the productivity of some of the crops has declined progressively in the period. This is not only in terms of productivity but also with respect to crop physiology during growing period [29,30].
In the district, the role of governmental organizations as sources of information regarding climate change and its impacts has been significant. In this regard, the role of formal communication from research institutions, mass media especially the report from national meteorological agency, and government extension services through its development agents and seminars and workshops was critical. Although research organizations, mass media, agricultural extension and seminars are underlined as important source of information, their coverage is still low as some of the respondents have limited access to them due to a poorly developed infrastructure in the area as well as the limited literacy of the smallholders.
Indicators of climate change in Qwara district
The most commonly climate change indicators observed by farmers were high temperature (90%), high rainfall (87%), high wind (65%) and their respective low amount is shown in Figure 2. The variability and change in rainfall and temperature are the main influencing factors for the occurrence of other indicators. The trends of temperature and rainfall indicators were shown in Table 2. For instance, 83.8% of the respondents said that the rainfall has been decreased since the last 15 years. On the other hand, 90% of the respondents noted that the temperature is increasing. This study is in consistent with other related studies [12,13,16].
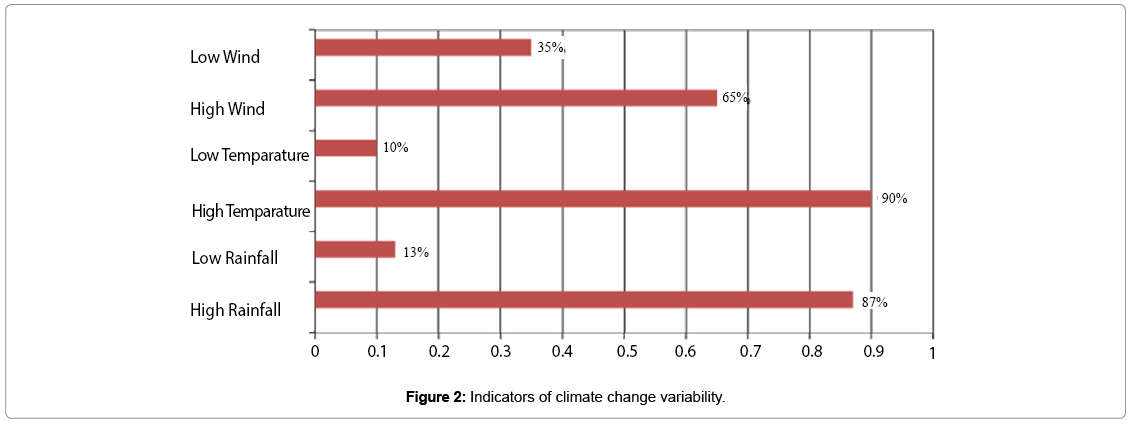
Figure 2: Indicators of climate change variability.
Perceived impacts of climate change on smallholder farmers
In quart district, it is not only the variability and change in climate parameters but also its impacts have been perceived by smallholder farmers. The crop production has been severely affected and has led to food insecurity among smallholder farmers. Notably 58% of the respondents clearly indicated that climate change and variability has brought reduction in crop productivity. They indicated that the reduction of crops yield is associated with many factors. First, the late start of the rainy season makes the smallholders not to cultivate the crops that suit the particular season. As a result, crop production was not carried out as per schedule. Smallholder farmers indicated that this made some farmers to stop their crop farming activities. Even during the main rainy season (Jun, July, August and partly September) some farms are left uncultivated due to the late onset of the main rainy season. Secondly, the crops that are planted upon rainfall often get destroyed due to early cessation of the rainy season. As far as livestock concerned, productivity has become often low due to extended drought and scarcity of water. In extreme cases, the extended drought that results in water and fodder scarcity is often responsible for death of the livestock (Table 3).
| Types of assets | Impacts | Description | Farm owner | |||
|---|---|---|---|---|---|---|
| Large | medium | small | landless | |||
| Human capital | Food insecurity | Due to low production and income | - | x | xxx | xxx |
| Unemployment | Reduced opportunities for the small and the landless farmers | - | x | xx | xxx | |
| Disease | The small and the landless farmers are easily affected by diseases due to food insecurity and limited access to health services, | x | x | x | xx | |
| Migration | Seasonal migration of people to Metema and Gondar towns | - | x | xx | xx | |
| Social capital | Educational institutions | Many educational institutions have been damaged |
x | x | x | x |
| Medical facilities | Due poor infrastructure, access to health services is not adequate | x | x | xx | xx | |
| Farmers to farmers co-operation | Limited co-operation among farmers’ | x | x | xx | xxx | |
| Organizational involvement | Poor involvement of the farmers due to weak organizational arrangement | x | x | xx | xxx | |
| Financial capital | Credit facilities | Formal and non-formal sources of credit reduced |
- | x | xxx | xxx |
| Market access | No strong market access due to scattered population and poor road | x | x | xxx | xxx | |
| Savings habits | Reduced due to low income sources | x | xx | xxx | xxx | |
| Physical capital | Transport | Damaged transport access | xx | xx | xx | xx |
| Electricity | Poor electricity facility | xxx | xx | xx | xx | |
| Market place | No well-organized market places | x | x | xx | xxx | |
| Natural capital | Water | Availability of safe drinking water reduced | x | x | xxx | xxx |
| Land | Loss of land | x | x | xx | - | |
| Forest | Deforestation | xxx | xxx | xx | - | |
| Soils | Deterioration of soil quality and emerging of invasive species | x | x | x | - | |
Table 3: Perceived impacts of climate change and climatic hazards.
Climate Change Adaptation Strategies (CCAS) by smallholder farmers
This study revealed that, despite the difficulties of climate change issues, the small holder farmers tried to sustain and improve their livelihood through a range of climate change adaptation strategies. Nine (9) adaptation strategies were practiced by the smallholder farmers based on their experiences and perceptions of climate change in the area (Figure 3). Among the adaptation strategies practiced by smallholder farmers in the study area, mixed farming followed by change crop variety. About 23% of the households have been practicing crop diversification as a response strategy, whereas only a few respondents (5%) have been practicing irrigation as an adaptation strategy. The fact that majority of the households practice crop diversification as an adaptation strategy is due to the help of extension services from government. Since this area is lowland area and desert, it is more vulnerable to climate variability and change as manifested through water stress and extended drought, the smallholder farmers respond to minimize the impacts by integrate crop and livestock production, changing planting dates, and change crop varieties. 64% of the smallholder farmers with limited agricultural land used temporary migration to Metepa and Gondar towns as a strategy of alternatives for few months.
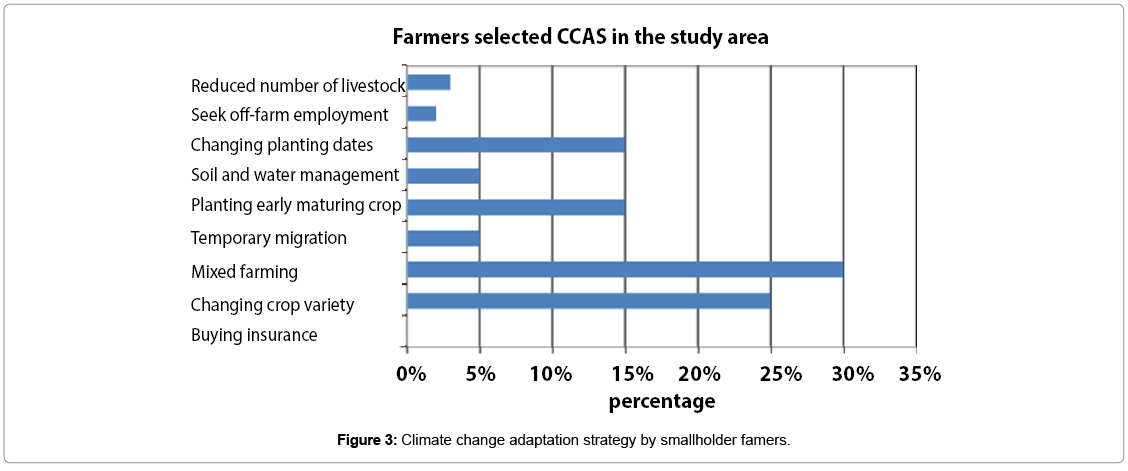
Figure 3: Climate change adaptation strategy by smallholder famers.
Determinants to climate change adaptation by smallholder farmers
The smallholder farmers are affected by many factors that hindered the adoption of adaptation strategy in Qwara district (Figure 4). 75% of the respondents replied that, low level of technology use was the most critically constrained factors for climate change adaptation in area. This is may be due to non-functionality of mobile network, internet access and any other social media to hear information about the new technologies. Rainfall variability and drought are common in the study area which have an impact on the availability of water. It is already indicated that the production of most crops showed a declining trend from time to time (Office report, 2016). The smallholder farmers survey result indicated that the major sources of information for climate change adaptation in the area was farmers’ own long-term experiences.
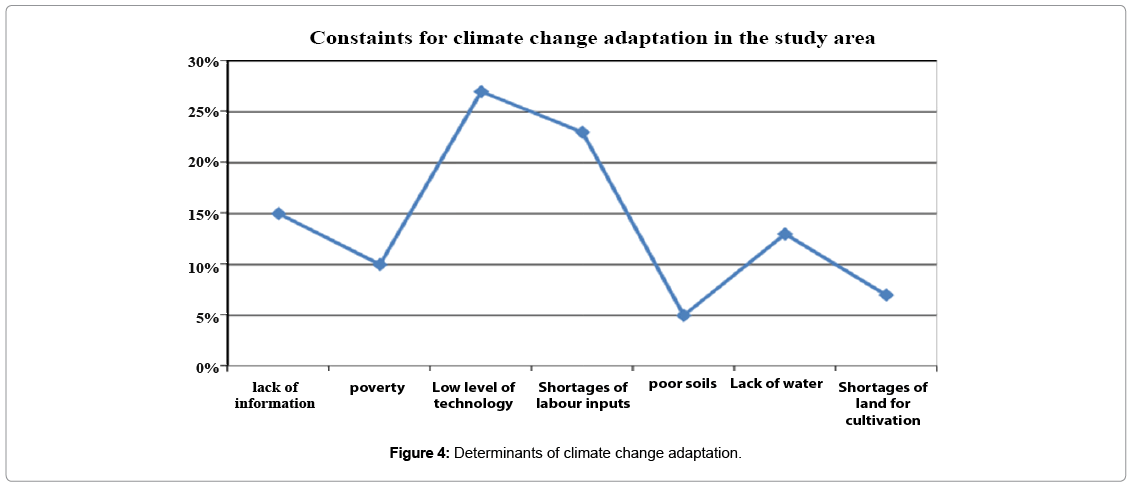
Figure 4: Determinants of climate change adaptation.
Conclusion
The study was conducted in Qwara district with the aim of examining determinants of coping and adaptation strategies used by smallholder farmers. The socioeconomic, biophysical and infrastructural characteristics of the study area and the sample smallholder farmers were considered to identify the determinants of smallholder farmers’ coping and adaptation strategy for climate change. This enables to design successful adaptation interventions. The binary logistic regression was employed to investigate the relations between the dependent and the explanatory variables through maximum likelihood estimates of parameters. The change in duration and intensity of rainfall and increasing of temperature are the most frequently noted indicators of climate change in the study area. The smallholder farmers have been highly encountered the intensity of climate related problem like water availability, food insecurity, high risk of crop damage. 92% respondents responded that, the agricultural production dramatically decreased due to excess rainfall at harvesting time and less rainfall at its growing time.
The study also found that, coping with extreme climate conditions in the study area has been practice over three decades and diverse climate change adaptation strategies have been identified. Soil and water conservation, water harvesting, crop diversification, and adjustment of planning periods are among the highly practiced adaptation strategies by smallholder farmers in the study area. Among the determinants affecting the adaptation strategy of smallholder farmers includes lack of knowledge, lack of capital, lack of sufficient land, lack of information and unobserved climatic related problems are the major ones.
The government needs to improve smallholder farmers’ access to extension services, market, training and timely information to minimize the climate related problems. This paper concludes that the government policy intervention should take into consideration for encouraging climate change adaptation technologies in the Qwara district (Table 4).
| Determinants | Significant impacts |
|---|---|
| Erosion | 4.140 (0.045) |
| Shortage of production | 0.723 (0.397) |
| Decreases of soil fertility | 2.712 (0.103) |
| Lack of awareness | 0.092 (0.763) |
| Shortage of labor force | 0.513 (0.476) |
| Poverty | 0.426 (0.515) |
Table 4: Logistic regression results-determinants of climate change coping and adaptation strategies and their significant values.
Acknowledgements
The authors highly appreciate the Qwara wired agricultural office and the local administrations and development agents for their contribution in data collection and frequent discussions for this study.
References
- Tesfahunegn F, Gebreyesus B, Kirubel M, Abadi T (2016) Farmer’s perception on causes, indicators and determinants of climate change in Northern Ethiopia:  Implication for developing adaptation strategies. Applied Geography 73: 1-12
- Bonatti M (2016) Land use policy climate vulnerability and contrasting climate perceptions as an element for the development of community adaptation strategies: Â Case studies in Southern Brazil. Land Use Policy 58: Â 114-122.
- Elum ZA, David MM, Ana M (2017) Climate risk management farmer’s perception of climate change and responsive strategies in three selected provinces of South Africa. Climate Risk Management 16:  246-257.
- Fedoun F, Sonwa D, Kemeuze V, Mengelt C (2017) Urban climate assessing climate change vulnerability and local adaptation strategies in adjacent communities of the Kribi-Campo Coastal. Urban Climate 10: 1.
- Yayeh D, Walter L (2017) Farmers perceptions of climate variability and its adverse impacts on crop and livestock production in Ethiopia. Journal of Arid Environments 140: 20-28.
- Seleshi Y, Ulrich Z (2004) Recent changes in rainfall and rainy days in Ethiopia. International Journal of Climatology 24;8: Â 973-983.
- Muhammad A, Uwe AS, Jürgen S (2016) Adaptation to climate change and its impacts on food productivity and crop income:  perspectives of farmers in rural Pakistan. Journal of Rural Studies 47:  254-266.
- Alam P, Monirul GM, Khorshed A, Shahbaz M (2017) Climate risk management climate change perceptions and local adaptation strategies of hazard-prone rural households in Bangladesh. Climate Risk Management 15: 1.
- Amamou H (2018) Climate risk management climate change-related risks and adaptation strategies as perceived in dairy cattle farming systems in Tunisia. Climate Risk Management 17: 1.
- Fissahaye D (2017) Irrigation water management: Â Farmers Practices, perceptions and adaptations at gumselassa irrigation scheme, North Ethiopia. Agricultural Water Management 191: Â 16-28.
- Georgopoulou E (2017) Climate Change impacts and adaptation options for the Greek agriculture in 2021-2050: Â A monetary assessment. Climate Risk Management 18: 1.
- Marshall MH (2009) Climatic change in Northern Ethiopia during the Past 17, 000 Years: Â A Diatom and Stable Isotope Record from Lake Ashenge. Palaeogeography, Palaeoclimatology, Palaeoecology 279: Â 114-127.
- Â Addis Ababa Ethiopia Climate Change Manifesto (2012) A time series analysis of climate variability and its impacts on food production in North Shewa zone in Ethiopia Climate Change (CC) manifest in the form of temperature increases, Changes in precipitation and sea level rise, and the intensification. 20: Â 261-274.
- Addis Ababa Ethiopia Climate Change Manifesto (2012) A time series analysis of climate variability and its impacts on food production in North Shewa zone in Ethiopia Climate Change (CC) manifest in the form of temperature increases, Changes in precipitation and sea level rise, and the intensification. 20: Â 261-274.
- Gebreyes M (2018) NJAS - Wageningen Journal of Life Sciences “Producing†Institutions of Climate Change Adaptation and Food Security in North Eastern Ethiopia. NJAS - Wageningen Journal of Life Sciences 84:  123-132.
- Bisrat K, Gizaw M, Gerrit H (2017) Climate risk management climate change and population growth impacts on surface water supply and demand of Addis Ababa, Ethiopia 8:Â 1.
- Aronica GT, Bonaccorso B (2013) Climate change effects on hydropower potential in the Alcantara river basin in Sicily (Italy). Earth Interactions 17: Â 19.
- Groisman PY, Knight RW (2015) NOAA National, and Climatic Data. 5 Climate Vulnerability: Â Understanding and addressing threats to essential resources recent trends in regional and global intense precipitation patterns. Elsevier, The Netherlands.
- Wiem F, Lazine AM, Bassinot F (2016) Hydro-climate changes over southwestern arabia and the horn of africa during the last glacial-interglacial transition: Â A pollen record from the Gulf of Aden. Review of Palaeobotany and Palynology 233: Â 176-185.
- Eshetu G, Tino J, Wayessa G (2016) Rainfall trend and variability analysis in Setema-Gatira Area of Jimma, South-western Ethiopia. African Journal of Agricultural Research 11(32): Â 3037-3045.
- Guoyong L, Tang Q, Rayburg S (2015) Climate change impacts on meteorological, agricultural and hydrological droughts in China. Global and Planetary Change 126: Â 23-34.
- Jianyu L, Qiang Z, Singh VP (2017) Contribution of multiple climatic variables and human activities to streamflow changes across China. Journal of Hydrology 545: Â 145-162.
- Engdaw K (2016) Assessment of surface water potential and Addis Ababa Institute of Technology School of Graduate Studies School of Civil and Environmental Engineering Assessment on Surface Water Potential and Demands of Wabishebele Basin in Ethiopia.
- Lungarska A, Raja C (2018) Climate-induced land use change in France: Â Impacts of agricultural adaptation and climate change mitigation. Ecological Economics 147: Â 134-154
- Chalmers M, Marenya P, Bahadur D, Kassie M (2017) Climate risk management response to climate risks among smallholder farmers in Malawi :  A Multivariate profit assessment of the role of information, household demographics, and farm characteristics. Climate Risk Management 20: 1.
- Meredith NT, Mueller ND (2016) Farmer perceptions of climate change :  associations with observed temperature and precipitation trends, irrigation and climate beliefs. Global Environmental Change 39:  133-142.
- Pandey R (2018) Climate Change adaptation in the western-himalayas: Â household level perspectives on impacts and barriers. Ecological Indicators 84: Â 27-37.
- Randell H, Clark G (2016). Climate variability and educational attainment: Â Evidence from rural Ethiopia. Global Environmental Change 41: Â 111-123
- Amogne A, Simane B, Hassen A, Bantider A (2017) Variability and time series trend analysis of rainfall and temperature in Northcentral Ethiopia: Â A case study in Woleka Sub-Basin. Weather and Climate Extremes 6: Â 1-13.
- State R (2017) SM Gr Up-survey on farmer’s husbandry practice for International Journal of Animal Dairy Cows in Alefa and Quara Districts of North Gondar Zone. Amhara National Science 1:  1-13.
Citation: Gedefaw M, Girma A, Denghua Y, Hao W, Agitew G (2018) Farmer's Perceptions and Adaptation Strategies to Climate Change, Its Determinants and Impacts in Ethiopia: Evidence from Qwara District. J Earth Sci Clim Change 9: 481. DOI: 10.4172/2157-7617.1000481
Copyright: © 2018 Gedefaw M, et al. This is an open-access article distributed under the terms of the Creative Commons Attribution License, which permits unrestricted use, distribution, and reproduction in any medium, provided the original author and source are credited.
Select your language of interest to view the total content in your interested language
Share This Article
Recommended Journals
Open Access Journals
Article Tools
Article Usage
- Total views: 8172
- [From(publication date): 0-2018 - Dec 19, 2025]
- Breakdown by view type
- HTML page views: 6693
- PDF downloads: 1479