Field Metagenomics of Bacterial Community Involved in Bioremediation of Crude Oil-Polluted Soil
Received: 18-Jun-2018 / Accepted Date: 26-Jul-2018 / Published Date: 31-Jul-2018 DOI: 10.4172/2155-6199.1000449
Keywords: Crude oil; In-situ bioremediation; Metagenomics; Bacterial structure; Land farming treatment
Introduction
Oil industries have contributed enormously in the pollution of various ecosystems in Niger Delta, Nigeria. The severe pollution of the environments through oil spillage has posed hazards to the populace through the contamination of soils and aquifer [1]. Pollution of the farmland, fisheries and water bodies are one of the major problems that is associated with oil pollution because most of the people’s livelihood depends solely on them [2]. Therefore, effort to negate the impact of the pollution has led to the development of some techniques like Land farming [3].
Field bioremediation is less expensive when compared with other chemical methods of pollutant cleanups with no environmental impact [4-6]. Water and carbon dioxide remain the resultant end products of biodegradation. During bioremediation process, a number of indices such as microbial counts and pollutant concentration monitored and use to predict and conclude the success of the technology [6].
Environmental degradation caused by oil pollution has been a great problem facing the oil-rich Niger Delta region of Nigeria [7,8]. Studies have reported the environmental degradation caused by oil pollution and their negative effects on biotic and abiotic components of the ecosystem [9-11]. Several different physical and chemical methods are used to restore the polluted sites to its original state (Riser-Roberts, 1998), however, bioremediation by land farming technique are preferable because of low cost requirement and minimal side effects on the environment [12,13].
Molecular tools and sequencing have been widely used in determining the bacterial community structure and function and also the catabolic capacity which may be related with the attenuation rate [14,15]. Amongst all, high throughput technology such as illumina and 454 platforms were less widely used which gives comprehensive information on the taxonomy and metabolic potential of bacterial communities in contaminated environments [9,16,17]. Moreover, the traditional PCR based tools provide information on a target group of microorganisms such as either bacteria or fungi, high throughput sequencing methods give more detailed information on the different microbial capacities available with genomic DNA or amplicon-based sequencing. In the last decades, metagenomics has been developed to study the genetic potential and to determine the actively expressed genes of an organism or mixture of organisms without the need to culture them in the laboratory [18,19]. This technology has revealed the composition and functioning of a number of poorly accessed and explored microbial communities. Therefore, in this study, we used metagenomics to analyze the bacterial community structures that are involved in bioremediation of crude oil-polluted soil.
Materials and Methods
Study area
Polluted site that was undergoing remediation by land farming treatments at Ibaa in Emohia Local Government Area of Rivers state, Nigeria. The pollution was as a result of pipeline vandalisation from the restive youths of the community.
Sample collection
The hydrocarbon polluted soil was collected with 0-15 cm and 0-30 cm using soil auger [20] from different points at each phase of the study under aseptic conditions [21]. The soil was collected from four sampling points and mixed together to obtain homogenous mixture after excavation.
The excavated soil was transported to Pharmacology laboratory and Environmental microbiology laboratory of Niger Delta university and University of Port Harcourt for molecular and microbiology/ physicochemical analysis, respectively while the amplicons were sent to Inqaba, South Africa for 16S RNA Illumina Miseq.
Bioremediation study
Ibaa site, Rivers state: This was a 56 day bioremediation of the polluted sites using remediation by enhanced natural attenuation (RENA). There was no plate to show for in this site as a result of insecurity in this region during the study period.
Microbiological analysis
Enumeration of total culturable heterotrophic bacteria (TCHB): The spread plate method on plate count agar (Anatech Laboratories Ltd) was used in the enumeration of heterotrophic bacteria [20].
Enumeration of total culturable hydrocarbon utilizing bacteria (TCHUB): The enumeration of total culturable hydrocarbon utilizing bacteria (HUB) was done on Bushnell Hass agar using the vapour phase method.
Isolation, characterization and identification of hydrocarbon utilizing bacteria: After enumeration, representative colonies of the different morphological types that appeared on the plates after incubation was carefully picked with a sterile inoculating needle and sub-cultured to purify them. This was done by streaking aseptically, onto freshly prepared nutrient agar plates. After incubation the purity of the isolates was checked by subjecting them to the Gram staining technique and molecular methods was used in identification.
The diversity of the bacteria was determined to species or strain levels using Next generation Seguencing (Illumina Miseq platform) by Inqaba, Pretoria, South Africa. Meanwhile the Polymerase Chain Reaction (PCR) with appropriate primers was done at the Niger Delta University Bedford, Bayelsa State.
Molecular identification
DNA extraction: Extraction was done using a ZR bacterial DNA mini prep extraction kit supplied by Inqaba South Africa. Two hundred and fifty mg of soil was added into a ZR Bashing Bead Lysis tubes, 750 microlitre of lysis solution was added to the tube. The tubes were secured in a bead beater fitted with a 2 ml tube holder assembly and processed at maximum speed for 5 minutes. The ZR bashing bead lysis tubes were centriguged at 10,000 xg for 1 minute.
Four hundred (400) microlitres of supernatant was transferred to a Zymo-Spin IV spin Filter (orange top) in a collection tube and centrifuged at 7000 xg for 1 minute. One thousand two hundred (1200) microlitres of soil DNA binding buffer was added to the filtrate in the collection tubes bringing the final volume to 1600 microlitre, 800 microlitre was then transferred to a Zymo-Spin IIC colum in a collection tube and centrifuded at 10,000 xg for 1 minute, the flow through was discarded from the collection tube. The remaining volume was transferred to the same Zymo-spin and spun. Two hundred (200) microlitre of soil the DNA Pre-Was buffer was added to the Zymo-spin IIC in a new collection tube and spun at 10,000 xg for 1 minute followed by the addition of 500 microlitre of soil DNA Wash Buffer and centrifuged at 10,000 xg for 1 minute.
The Zymo-spin IIC colum was transferred to a clean 1.5 microlitre centrifuge tube, 100 microlitre of DNA elution buffer was added to the colum matrix and centrifuged at 10,000 xg microlitre for 30 seconds to elute the DNA. The eluted DNA was transferred into a zymospin IVHRC spin filter placed in a 1.5 ml microcentrifuge and spun at 8000 rpm for 1 min. The ultra pure DNA was then stored at -20 degrees for other downstream reaction.
DNA quantification: The extracted genomic DNA was quantified using the Nanodrop 1000 spectrophotometer
16S rRNA amplification: PCR targeting bacterial V1-V3 hyper variable region of 16S rRNA was done using universal primers 27F: 5’ TCGTCGGCAGCGTCAGATGTGTATAAGAGACAGGAGTTTGAT CCTGGCTCAG and 518R:5’ GTCTCGTGGGCTCGGAGATGTGTATAAGAGACAGATTACCGC GGCTGCTGG primers with adapters on a ABI 9700 Applied Biosystems thermal cycler at a final volume of 50 micro litres for 35 cycles. The PCR mix included: the X2 Dream taq Master mix supplied by Inqaba, South Africa (taq polymerase, DNTPs, MgCl), the primers at a concentration of 0.4 M and the extracted DNA as template. The PCR conditions were as follows: Initial denaturation, 95°C for 5 minutes; denaturation, 95°C for 30 seconds; anealing, 52°C for 30 seconds; extension, 72°C for 30 seconds for 35 cycles and final extention, 72°C for 5 minutes. The product was resolved on a 1% agarose gel at 120 V for 15 minutes and visualized on a UV transilluminator.
Sequencing: Sequencing was done on an Illumina Miseq platform by Inqaba, Pretoria, South Africa.
Protocols for DNA sequencing using Illumina Miseq platform: See supplementary materials.
Soil physicochemical analysis
The Physicochemical properties of the polluted site were determined at the beginning of the study in order to have a baseline for the soil characterization. The following parameters were determined and monitored; soil pH (digital pH meter; Jenway 3015, United Kingdom)), total organic carbon (Nelson and Sommers 1975), Nitrate (Brucine method as reported by UNEP, 2004), Phosphate (Colorimetric method as adopted by UNEO, 2004), total petroleum hydrocarbon [22], polyaromatic hydrocarbons and bacterial indices (total heterotrophic bacterial count; total hydrocarbon utilizing bacterial).
DNA extraction, library construction and metagenomic sequencing
The DNA for metagenomic analysis was extracted from the samples using a ZR bacterial DNA mini prep extraction kit supplied by Inqaba South Africa. Two hundred and fifty mg of soil was added into a ZR Bashing Bead Lysis tubes, 750 microlitre of lysis solution was added to the tube. The tubes were secured in a bead beater fitted with a 2 ml tube holder assembly and processed at maximum speed for 5 minutes. The ZR bashing bead lysis tubes were centriguged at 10,000 xg for 1 minute.
Four hundred (400) microlitres of supernatant was transferred to a Zymo-Spin IV spin Filter (orange top) in a collection tube and centrifuged at 7000 xg for 1 minute. One thousand two hundred (1200) microlitres of soil DNA binding buffer was added to the filtrate in the collection tubes bringing the final volume to 1600 microlitre, 800 microlitre was then transferred to a Zymo-Spin IIC colum in a collection tube and centrifuded at 10,000 xg for 1 minute, the flow through was discarded from the collection tube. The remaining volume was transferred to the same Zymo-spin and spun. Two hundred (200) microlitre of soil the DNA Pre-Was buffer was added to the Zymo-spin IIC in a new collection tube and spun at 10,000 xg for 1 minute followed by the addition of 500 microlitre of soil DNA Wash Buffer and centrifuged at 10,000 xg for 1 minute.
The Zymo-spin IIC colum was transferred to a clean 1.5 microlitre centrifuge tube, 100 microlitre of DNA elution buffer was added to the colum matrix and centrifuged at 10,000 xg microlitre for 30 seconds to elute the DNA. The eluted DNA was transferred into a zymospin IVHRC spin filter placed in a 1.5 ml microcentrifuge and spun at 8000 rpm for 1 min. The ultra-pure DNA was then stored at -20 degree for other downstream reaction.
Sequencing
Sequencing was done on an Illumina Miseq platform by Inqaba, Pretoria, South Africa.
Statistical analysis
Statistical analyses were carried out using Statistical package for social sciences (SPSS, Version 17.0). Analysis of variance (ANOVA) was carried out at 95% level of confidence using statistical package for social sciences.
Results
Site description and microbiological properties of crude oil polluted soil
The Baseline Physicochemical and Microbiological properties of crude oil polluted soil in Ibaa community are presented in Table 1 while the Physicochemical and Microbiological properties during bioremediation monitoring are shown in Table 2. The baseline TOC of the site was 5.647 ± 0.12%, while the control was 1.973 ± 0.08% which revealed an increase in TOC because of the pollution (Table 1). The PAHs and TPH of the polluted soil decreased progressively with time during treatments (Table 1). The study of TPH from the baseline to the end of the study was done using gas chromatography frame ionization detection. The TPH and PAHs concentrations at the baseline, day 0, 9, 29, 36, 56 and control, the TPH and PAHs concentrations were 9146.6 ± 20.19 mg/kg and 3453.9 ± 43.12 mg/kg, 8635.68 ± 19.56 mg/kg and 3248.2 ± 19.97 mg/kg, 6125.7 ± 17.79 mg/kg and 2750.1 ± 15.03 mg/kg, 4171.9 ± 2011 mg/kg and 1894.2 ± 9.04 mg/kg, 2435.2 ± 13.7 mg/kg and 1177.9 ± 17.03 mg/kg, 677.2 ± 4.98 mg/kg and 356.5 ± 6.12 mg/kg, 479.7 ± 2.33 mg/kg and 2797 ± 3.06 mg/kg, respectively (Tables 1 and 2).
| Samples | Parameters | |||||||
|---|---|---|---|---|---|---|---|---|
| pH | TOC | NO3- | PO43- | TPH | PAH | THBC | THUBC | |
| Baseline | 5.03 ± 0.01 | 5.647 ± 0.12 | 0.833 ± 0.003 | 8.105 ± 0.21 | 9146.6 ± 20.19 | 3453.9 ± 43.12 | 6.70 × 10² ± 0.4 | 1.36 102 ± 0.08 |
| Polluted day zero | 4.82 ± 0.03 | 5.068 ± 0.18 | 0.667 ± 0.005 | 10.834 ± 0.14 | 8635.68 ± 19.56h | 3248.8 ± 19.97 | 7.50 × 10³ ± 0.21l | 5.80 ×10²± 0.11 |
| Unpolluted (CTRL) | 6.12 ± 0.03 | 1.973 ± 0.08 | 3.841 ± 0.08 | 20.521 ± 0.37 | 479.7 ± 2.33 | 279.7 ± 3.06 | 8.4x10⁴ ± 0.7 | 1.40 ×10²± 0.09 |
Table 1: Baseline Physicochemical and Microbiological properties of crude oil polluted soil in Ibaa Community. Data in the table represent mean of triplicate values. Values with the same superscript letter(s) in a given column are significant at the 0.05 level, whereas values with different superscript letter(s) or combinations of letters in a column are not significant at the 0.05 level. Legend: THBC; Total petroleum bacterial count, NO3-; Nitrate concentrations, PO43-; TOC; Total organic carbon, pH; Hydrogen ion concentration, Phosphate concentrations, HUBC; Hydrocarbon utilizing bacterial count, TPH; Total petroleum hydrocarbons, PAHs; Polycyclic aromatic hydrocarbons
| Samples | Parameters | |||
|---|---|---|---|---|
| TPH | PAH | THBC | THUBC | |
| Treatment 9 | 6125.7 ± 17.79 | 2750.1 ± 15.03 | 2.3 × 10⁴ ± 0.15 | 3.60 × 10² ± 0.14 |
| Treatment 29 | 4171.9 ± 20.11 | 1894.2 ± 9.04 | 8.40 × 10⁵ ± 0.08 | 7.10 ×10³± 0.06 |
| Treatment 36 | 2435.2 ± 13.17 | 1177.9 ± 17.03 | 5.0 × 10⁵ ± 0.3 | 1.50 ×10³± 0.15 |
| Treatment 56 | 677.2 ± 4.98 | 356.5 ± 6.12 | 4.20 × 10³ ± 0.05 | 3.30 × 10² ± 0.3 |
Table 2: Physicochemical and microbiological properties of crude oil polluted soil during bioremediation monitoring in Ibaa community. Data in the table represent mean of triplicate values. Values with the same superscript letter(s) in a given column are significant at the 0.05 level, whereas values with different superscript letter(s) or combinations of letters in a column are not significant at the 0.05 level. Legend: THBC; Total
petroleum bacterial count, THUBC; Total hydrocarbon utilizing bacterial count, TPH; Total petroleum hydrocarbons, PAHs; Polyaromatic hydrocarbons.
OTU based analysis of Alpha diversity of the various samples
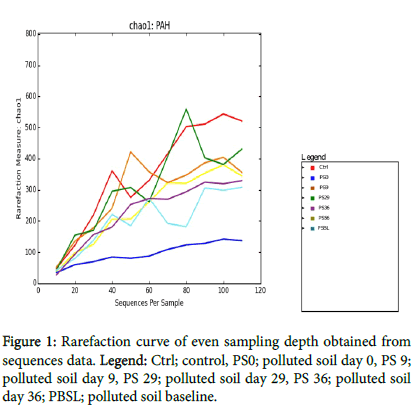
After quality screening to remove sequencing errors and chimeric sequences, the samples were rarefied to even number of 115 to accommodate all the samples (Figure 1). the total number of OTUs were 4258 while the total number of counts were 22727. The summary of microbial counts per sample is showm below PS36: 153.0, PSBL: 736.0, PS0: 1965.0, PS29: 2096.0, PS9: 3608.0, Ctrl: 7054.0, PS56: 7115.0.
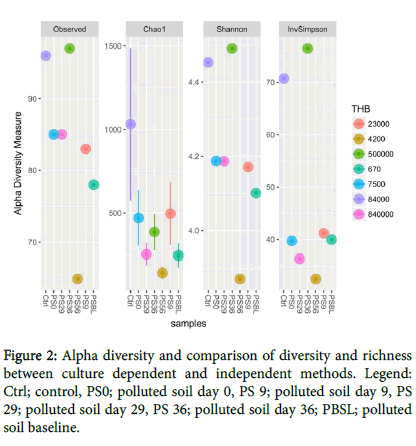
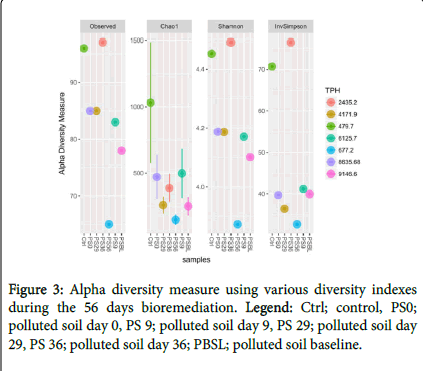
Bacterial diversity: The alpha diversity measure was carried out using different diversity indices (Figure 2) and compared with THBC from culture dependent method. This showed a high bacterial diversity increase at day 29 followed by day 36 during treatments and a corresponding and progressive increase of THBC from culture dependent method (Figure 3). Also when compared with TPH, we observed a progressive decrease from 9146.5 to 677.2 during PSBL and PS56, respectively (Figure 3).
Weighted unifrac PCoA plot comparing the samples during bioremediation
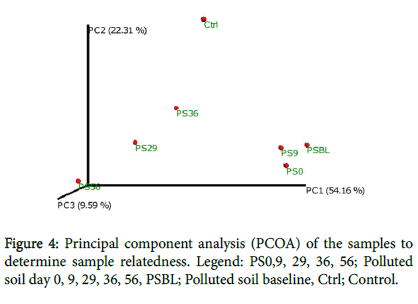
Principal Coordinates Analysis (PCoA)/NMDS (Non-metric multidimentional scaling) is a technique that helps to extract and visualize a few highly-informative components of variation from complex, multidimensional data.
This is a transformation that maps the samples present in the distance matrix to a new set of orthogonal axes such that a maximum amount of variation is explained by the first principal coordinate, the second largest amount of variation is explained by the second principal coordinate, (Figure 4). The principal coordinates can be plotted in two or three dimensions to provide an intuitive visualization of differences between samples.
This showed the samples spread based on how related they are. In the first principal component (PC1 54.16%), the samples (PSO, PS9, PSBL) together which showed that they are polluted and are from a single source. The PC2 (29.59%) showed the distance between the samples (PS36, PS29, PS56) which was as a result of the changes as the remediation progresses. Meanwhile, the PS56 was further away from the CTRL because the CTRL was taken 80 km away from the polluted soil.
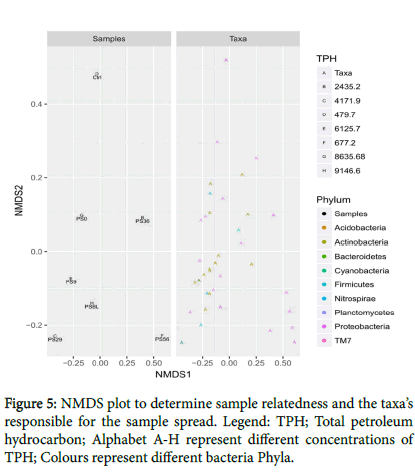
Moreover, the NMDS split plot (Figure 5) was used to determine the sample relatedness and the taxa’s responsible for the sample spread. In Figure 4.1, there were changes in the PS during the remediation as remediation progresses with their respective phyla and changes in TPH. The polluted soils (PS0, PS9, PSBL, PS29) were all clustered together and PS36, PS56 and CTRL were distant from each other which showed that the remediation was successful and loss of TPH achieved.
Bacterial distribution and abundance study
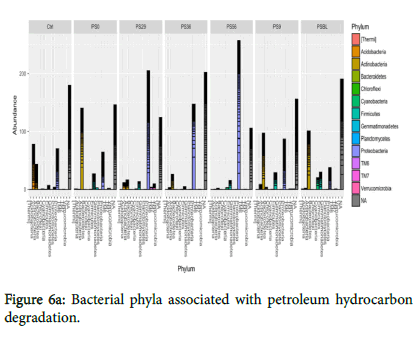
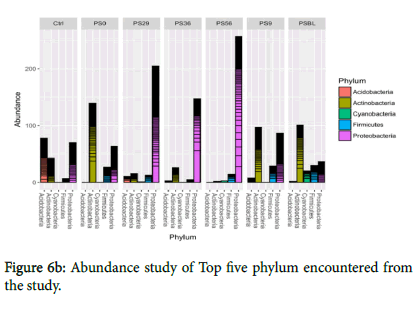
Figures 6a and 6b showed the representative of the phyla and top five phyla encountered from the study. All the five phyla were present in polluted soil baseline (PSBL) but the growth of Cyanobacteria was not encouraged during the treatments. However, TM6 and TM7 are unclassified organisms that are novel. Figures 6a and 6b have shown that there was a shift in bacterial communities as remediation progressed. Proteobacteria was generally the most abundant phylum during remediation (PS29, PS36, PS56) while Actinobacteria was predominant in PSBL, PS0 and PS9.
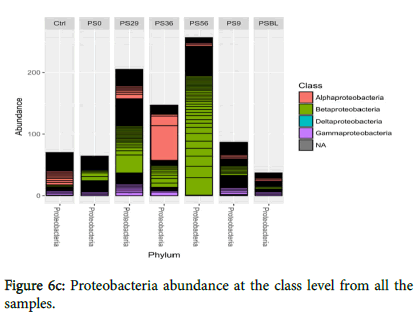
Also, Acidobacteria dominated the control sample and was the least predominant (low abundance) in PSBL while treatments slightly encouraged their growth. Treatments do not encourage the growth of Firmicutes and Cyanobacteria, but they still remain present in the polluted soil. The Proteobacteria abundance at class level from all the samples (Figure 6c) showed that Alphaproteobacteria were the most predominant followed by beta and gammaproteobacteria.
The NMDS plot revealed the sample relatedness and taxa’s responsible for the sample spread (Figure 5). The samples PS0, PS9 and PSBL were closely related while as remediation progressed there was a change among the samples PS29 and PS36. Also, PS 56 and control was distant away from the polluted soil which revealed eco-restoration of the polluted site. Moreover, different phyla responsible for the spread were also identified.
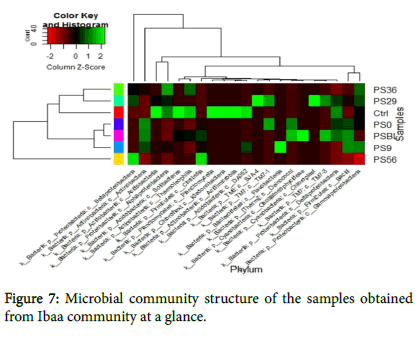
The hierarchical heat map at phylum level revealed the microbial community structure of the samples at a glance (Figure 7). The PS0, PSBL and PS9 were closely related as well PS29 and PS36 while PS56 represent the root of all the samples and contain all the component of other samples (Figure 7). The colours indicate the relative abundance. Light and dark green colours indicate high and low abundance level, respectively. The abundance study showed that Proteobacteria dominate during the treatments followed by Actinobacteria and Firmicutes. Meanwhile Acidobacteria predominate the control.
The Phylogenetic analysis of the samples during treatments (PS29, PS36 and PS56) corresponded with the abundance study. Meanwhile the phylogenetic analysis of PSBL, PS0 and PS9 indicate that Actinobacteria dominate followed by Proteobacteria and Firmicutes while control Proteobacteria, predominates followed by Acidobacteria, Actinobacteria and Firmicutes.
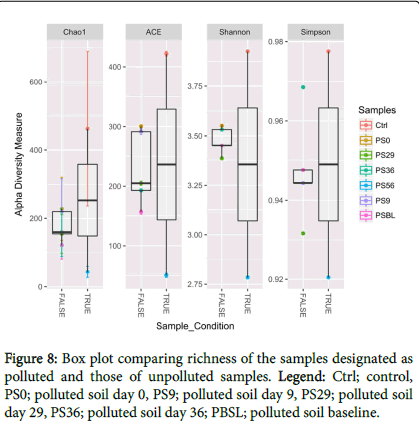
Box plot analysis of Ibaa polluted site was carried out to determine and compare the richness of the samples as designated polluted and unpolluted (Figure 8). True represent the unpolluted while false represent polluted. The minimum and maximum extent of the box represents the first and third quartiles, respectively while the centre lines indicate the median value. Also, the bars represent the minimum and maximum extent of the data.
Discussion
The bacterial community composition and diversity of crude oil polluted site (Ibaa, Rivers state) undergoing remediation by enhanced natural attenuation were monitored in a 56-day bioremediation study. A number of studies have been done on laboratory scale to bioremediate a polluted media [23-25] and one of the challenges of laboratory scale studies is that some of the environmental conditions on site cannot be recreated in the laboratory. Also, not all microorganisms can be cultured and grown on petridish. Studies have shown that only 1% of microorganisms are culturable i.e., only 99.9% are viable but non culturable (VBNOC). Similarly, Ghosal et al. [26] stated that the use of modern microbiological and molecular techniques over the past 40 years so far showed that only an extremely small fraction (<1%) of the total microbial diversity has been cultivated from all habitats investigated while culturing novel environmental microorganisms is indispensable [27]. In view of all these, the bioremediation monitoring of crude oil-impacted site undergoing remediation by enhanced natural attenuation using high-throughput functional genomics and sequencing platforms were investigated in this study.
The baseline pH of the crude oil polluted site was documented to be basic soil and studies have shown that the optimum pH for bioremediation is basic. Therefore, the sites have the basic pH requirement for optimum bioremediation.
Conductivity studies in bioremediation experiments both in-situ and ex-situ is related to salinity but it is often used than salinity as a result of ease of measurement [28].
The total organic carbon (TOC) measured as percentage total organic carbon (%TOC) is an alternative analytical method for measuring oil and grease and or total petroleum (TPH). It is a measure of the total extractable carbon present in a sample. It is worthy to categorically state the %TOC is just an integral parameter used with other parameters to study bioremediation, for it is not precise on its own. However, since this is an in-situ bioremediation where natural attenuation process such as photo-oxidation, volatilization, dispersion, oxidation, spreading and evaporation must have acted on the total organic carbon in ways that reduced TOC presence and availability in the polluted soil.
The decrease in TPH and PAH was as a result of enhancement during bioremediation and actions of weathering processes such as volatilization, evaporation and utilization by microorganisms which led to increase in microbial populations (THBC and THUBC). Ezekoye et al. [23,24] in their laboratory studies concluded that biostimulation through utilization of organic and inorganic nutrients and management of parameters such as aeration and moisture content revealed that the indigenous soil bacteria responded to nutrient amended evidenced by increased counts recorded in the amended treatments and removal of hydrocarbons.
It is not surprising that at day 0, there was loss of petroleum hydrocarbons. At day 0, bioremediation has not actually begun, but other weathering processes such as photo-oxidation, volatilization and evaporation amongst others are actively acting on the pollutant. Their effects are usually associated with breaking down or weathering of crude oil in the environment. On day 29 of this study, during treatments, active biodegradation has set in and loss of TPH increased significantly and progressively towards the 56th day.
In a laboratory, Okoro [29] studied bioremediation in Escravos mangrove swamp polluted by crude oil using NPK fertilizer. The scholar reported a decrease in the mean total petroleum hydrocarbon from 5360 ppm to 2360 ppm at zero hour to 5th week of study, respectively. It was reported that inclusion of biosurfactant established a significant biodegradation after 7 days of application of the biosurfactant and NPK oleophilic fertilizer. In a crude oil contaminated agricultural soil at Federal University of Technology, Owerri Nigeria; the amendment of 100 grams of contaminated soil with 30 grams of organic nutrient (poultry wastes) led to the loss of 40% total petroleum hydrocarbon [30]. In a tropical crude oil polluted soil undergoing bioremediation, Chikere et al. [31] observed that the use of NPK fertilizer, urea fertilizer and poultry wastes effectively stimulated bacterial organisms into utilization of the pollutant. In a laboratory scale bioremediation of phenol, Singh and Fullekar [32] observed that cow dung can assist in the degradation of about 500 mg/l of phenol completely within 120 hours.
The effect of biostimulation through the utilization of inorganic nutrients, and management of other parameters like aeration and moisture content showed that indigenous soil bacteria responded to nutrient amendment evidenced by increased counts recorded in the amended treatments and decrease in petroleum hydrocarbons. However, oil contaminated control (CTRL) demonstrated similar hydrocarbon degradation as the nutrient amended treatments which may not be unconnected with the terrain of the oil rich Niger Delta occasioned by increased multifarious activities of the oil and allied industries. Hydrocarbon-laden outfalls from these activities enrich the natural ecosystem with hydrocarbon degraders such that the bacterial communities respond rapidly to subsequent input of hydrocarbons by using them as sole source of carbon and energy.
The initial decrease in total culturable heterotrophic (TCHBC) and total hydrocarbon utilizing bacterial count (THUBC) between the polluted baseline and control has confirmed the toxic impacts of hydrocarbon in indigenous microbial flora which is in accordance with the reports by previous studies [23,24,33-36].
The findings obtained from the study showed that treatments or RENA during bioremediation induced shifts in the bacterial structure/ community with concomitant degradation of the hydrocarbons. The same trend was also observed in previous laboratory studies [23,24,33,37-39], who reported that there is always an increase in the population density of hydrocarbon utilizers in the ecosystems exposed to crude petroleum and petroleum products. Also, the populations of hydrocarbon utilizers in treatments were higher when compared with the control (without amendment). Increases in bacterial counts (for both TCHB and TCHUB) in crude oil polluted soil amended with organic and inorganic nutrient sources have been reported by other researchers. The physicochemical characteristics of the crude oil polluted site indicate that the hydrocarbon utilizing bacteria in crude oil polluted soil was relatively adequate for bioremediation. This observation was in-line with Ebuehi et al. [3].
The response of the indigenous hydrocarbon utilizing bacteria to the RENA was generally positive with higher population occurring progressively as time elapsed. The bacteria exhibited ability to degrade or utilize the different petroleum hydrocarbon components as sole carbon sources [24]. The hydrocarbon utilizing bacteria identified using Illumina Miseq includes Proteobacteria, Actinobacteria, Acidobacteria, Firmicutes and Planctomycetes.
Next Generation Sequencing (NGS) has revolutionized the field of microbiome research [40-45]. Over the last decade, NGS has become a faster, more accurate, and cost-effective tool for the study of complex microbial communities [46].
In this study, with the aim of developing a high-throughput polyphasic monitoring techniques that will be suitable and acceptable by regulatory bodies (DPR and NOSDRA) for evaluating the success of pollutant degradation during RENA, we investigated oil-contaminated site using illumina Miseq technique. This technique generates the highest number of reads per run. Phylogenetic and functional gene evidence indicates that Proteobacteria and Actinobacteria were the key hydrocarbon and polyaromatic degradation in crude oil polluted site (Figures 5a-6).
From our microbial community sequencing results, Proteobacteria remain the candidate phylum in day 9, 36 and 56 while Actinobacteria dominate PS baseline, day 0 and 29. Meanwhile Acidobacteria predominate US baseline and other few phylum that play a chief role in the hydrocarbon degradation and metabolism during in-situ bioremediation monitoring (Figures 5a-5c). A recent review study by Gkorezis et al. [47] reported that Proteobacteria are a diverse group of organisms that include hydrocarbonoclasts and plant growth promoting bacterial (PGPB) species [48]. In their review they concluded that the ability of bacteria to degrade hydrocarbons is attributed to the presence of catabolic genes and enzymes, which allow them to utilize the complex chemicals found in petroleum mixtures for carbon and energy.
In this study, there was a bacterial shift in the microbial communities as remediation progressed. Proteobacteria was the most abundant phylum in all the samples during the study period. There was less bacterial diversity in pre-remediation while high bacterial diversity was observed during remediation. Interestingly, acidobacteria was the least predominant (low abundance) in pre-remediation soil but increased progressively during remediation and thereafter decreased slightly in post –remediation (Figure 5b). Also, Firmicutes decreased in abundance during remediation and increased in post remediation soil. This result showed that hydrocarbon pollution has high toxic impacts on acidobacteria while nutrient enhancement encourages their growth. Meanwhile the decrease in abundance of Firmicutes during remediation might be attributed to the toxic effect of oxygen which was created during tilling of the soil which suggests that they are anaerobic bacteria. However, ADS, OP3, TM7, and WPS-2 are unclassified organisms that are novel. Similarly, other studies by Toth and Gieng [49] revealed a shift in microbial community composition during the 17-month incubation of under simulated reservoir condition in oil amended culture. In their study they revealed that Firmicutes and Euryarchaeota were the most abundant over time. Comprising 60 and 74% of quality sequence reads in both oil amended cultures.
The principle behind biostimulation as a method to increase crude oil degradation relies on establishment of favourable environmental conditions for hydrocarbonoclastic bacterial communities through the addition of nutrients [47,50-54].
Several authors have investigated the impacts of in situ biostimulation treatments on bacterial diversity to understand the relationships between the dominance, physiology and function of specific genera able to degrade contaminants of concern [47,55,56]. These observations suggest that identifying the key players that drive community structure is a prerequisite to comprehend, model, monitor and control biostimulation [57].
Our overall results revealed that microbial indices are very important in clean up or bioremediation of crude oil polluted sites as such play a key role in hydrocarbon degradation and metabolism. Microbial community sequencing identified Proteobacteria as key hydrocarbon degrader under RENA. Also, other phyla such as Actinobacteria and Acidobacteria play important roles in hydrocarbon degradation and metabolism expanding an existing knowledge of the diversity of hydrocarbon degrading consortia.
This study also showed that the ability of these bacteria to degrade hydrocarbon is attributed to the presence of catabolic genes which allows them to utilize the complex chemicals found in the crude oil mixtures for carbon and energy. This was in accordance with the review by Gkorezis et al. [47] on the Interaction between Plants and Bacteria in the Remediation of Petroleum Hydrocarbons: An Environmental Perspective.
Generally, there is a positive link between the relative abundance of the genes associated with pollutant removal and the efficiency of bioremediation. However, sometimes it is possible that the genes associated with pollutant removal can be present but not expressed. Therefore, there is an increasing interest in quantifying the mRNA for key catabolic genes via real time PCR [26,58]. The knowledge of the catabolic potential of a contaminated site virtually remains unknown by using culture-dependent techniques. High throughput metagenomics reduces the bottleneck.
Recently, bioremediation has become an intense area of research. However, more advancement has to be made in developing practically efficient microbial bioremediation framework or protocols.
Conclusion
The contribution of bacterial in hydrocarbon removal was observed. This study demonstrated that Proteobacteria probably played key role in the remediation of a polluted site with a shift in bacterial community during the remediation process.
Recommendation
Interdisciplinary/multidisciplinary supervision should be encouraged to widen the knowledge of the researcher. Also, Ecotoxicity assays should be conducted in assessing remediated site before it is certified clean or closed out.
Availability of Data and Materials
This project sequence data is available at NCBI under BioProject ID: PRJNA445643 with Sequence Reads Archive (SRA) accession number SRP136436.
Authors’ Contributions
CBC and GCO designed the experiment. ECC planned and conducted all the Experiments, collected and calculated all data and drafted the manuscript under CBC and GCO’s supervision. CBC and GCO proof read and corrected the manuscript. All authors read and approved the final manuscript.
References
- Philp JC, Whitely AS, Criric L, Bailey MJ (2005) Monitoring bioremediation. In: Bioremediation: Applied Microbial Solutions for Real–World Envronmental Clean up. American Society for Microbiology (ASM) Press, Washington, USA, pp: 237-292.
- Duke NC, Burns KA, Swannell RPJ, Dalhans O, Rubb RJ (2000) Dispersant use and a bioremediation strategy as alternate means of reducing impacts of large oil spills on mangroves: The Gladstone field trials. Marine Pollut Bullet 41: 403-412.
- Ebuehi OAT, Abibo IB, Shekwolo PD, Iheagwam KS, Adoki A, et al. (2005) Remediation of crude oil contaminated soil by enhanced natural attenuation technique. J Appl Sci Environ Managt 9: 103-105.
- Cappello S, Denaro R, Genovese M, Giuliano L, Yakimov MM (2007) Predominant growth of Alcanivorax during experiments on ‘oil spill bioremediation’ in mesocosms. Microbiol Res 162: 185-190.
- Kumar M, Khanna S (2010) Diversity of 16S rRNA and dioxygenase genes detected in coal-tar-contaminated site undergoing active bioremediation. J Appl Microbiol 108: 1252-1262.
- Chikere CB, Surridge KJ, Cloete TE, Okpokwasili GC (2011) Phylogenetic diversity of dominant bacterial communities during bioremediation of crude oil – polluted soil. Revista Ambi-agua 6: 61-76.
- Okpokwasili GC, Odokuma LO (1994) Tolerance of Nitrobacter to toxicity of some Nigerian crude oils. Bullet Environ Cont Toxicol 52: 388-395.
- Okpokwasili GC (2006) Microbes and the Environmental Challenge. Inaugural lecture series No. 53. University of Port Harcourt Press. Port Harcourt, Nigeria, pp: 31-56.
- Kostka JE, Prakash O, Overholt WA, Green SJ, Freyer G, et al. (2011) Hydrocarbon degrading bacteria and the bacterial community response in Gulf of Mexico beach sands impacted by the deep water horizon oil spill. Appl Environ Microbiol 77: 7962-7974.
- De la Huz R, Lastra M, Junoy J, Castellanos C, Vieitez JM (2005) Biological impacts of oil pollution and cleaning in the intertidal zone of exposed sandy beaches: Preliminary study of the “Prestige†oil spill. Estuarine, Coast. Shelf Sci 65: 19-29.
- Levy JK, Gopalakrishnan C (2010) Promoting ecological sustainability and community resilience in the US Gulf Coast after the 2010 Deepwater Horizon oil spill. Journal of Natural Resources Policy Research 2: 297-315.
- Boopathy R (2000) Factors limiting bioremediation technologies. Bioresource Technology 74: 63-67.
- Sanscartier D, Reimer K, Koch I, Laing T, Zeeb B (2009) An investigation of the ability of a 14C-labeled hydrocarbon mineralization test to predict bioremediation of soils contaminated with petroleum hydrocarbons. Bioremediation Journal 13: 92-101.
- Muyzer G, De Waal EC, Uitterlinden AG (1993) Profiling of complex microbial populations by denaturing gradient gel electrophoresis analysis of polymerase chain reaction amplified genes coding for 16S rRNA. Appl Envion Microbiol 59: 695-700.
- Beller HR, Kane SR, Legler TC, Alvarez PIJ (2002) A real-time polymerase chain reaction method for monitoring anaerobic, hydrogen-degrading bacteria based on a catabolic gene. Environ Sci Technol 36: 3977-3984.
- Mason OU, Hazen TC, Borglin S, Chain PSG, Dubinsky EA, et al. (2012) Metagenome, metstranscriptome and single – cell sequencing reveal microbial response to Deepwater Horizon oil spill. ISME J 6: 1715-1727.
- Yergeau E, Sanschagrin S, Beaumier D, Greer CW (2012) Metagenomic Analysis of the Bioremediation of Diesel-Contaminated Canadian High Arctic Soils. PLoS ONE 7: e30058.
- Bikel S, Valdez-Lara A, Cornejo-Granados F, Rico K, Canizales-Quinteros S, et al. (2015) Combining metagenomics, meta transcriptomics and viromics to explore novel microbial interactions: towards a systems-level understanding of human microbiome. Computational and Structural Biotechnology Journal 13: 390-401.
- Sharpton TJ (2014) An introduction to the analysis of shotgun metagenomic data. Front Plant Sci 5: 209.
- Chikere CB, Ekwuabu CB (2014) Culture-dependent characterization of hydrocarbon utilizing bacteria in selected crude oil-impacted sites in Bodo, Ogoniland, Nigeria. Afri J Environ Sci Technol 8: 401-406.
- Eziuzor CS, Okpokwasili GC (2009) Bioremediation of hydrocarbon contaminated mangrove soil in bioreactor. Nig of Microbiol 23: 1777-1791.
- Saari E, Peramaki P, Jalonen J (2007) A comparative study of solvent extraction of total petroleum hydrocarbons in soil. Microchim Acta 158: 261-268.
- Ezekoye CC, Amakoromo EB, Ibiene AA (2015) Bioremediation of Hydrocarbon polluted Mangrove Swamp Soil from the Niger Delta using Organic and Inorganic Nutrients. British Biotechnol J 6: 62-78.
- Ezekoye CC, Amakoromo EB, Ibiene AA (2017) Laboratory-Based Bioremediation of Hydrocarbon polluted Mangrove Swamp soil in the Niger Delta using poultry wastes. Microbiol Res J Int 19: 1-14.
- Orji FA, Ibiene AA, Dike EN (2012) Laboratory scale bioremediation of petroleum hydrocarbon – polluted mangrove swamps in the Niger Delta using cow dung. Malaysian J Microbiol 8: 219-228.
- Ghosal D, Ghosh S, Dutta TK, Ahn Y (2016) Current State of Knowledge in Microbial Degradation of Polycyclic Aromatic Hydrocarbons (PAHs): A review. Front Microbiol 7: 1369.
- Zinder SH (2002) The future for culturing environmental organisms: a golden era head? Environ Microbiol 4: 14-15.
- Zhu X, Venosa AD, Suidan MT, Lee K (2001) Guidelines for the bioremediation of marine shorelines and freshwater wetlands Report under a contract with office of Research and Development U.S. Environmental Protection Agency, pp: 201.
- Okoro CC (2010) Enhanced Bioremediation of hydrocarbon contaminated mangrove swamp in the Nigerian oil rich Niger Delta using sea water microbial inoculate amended with crude oil biosurfactants and macronutrients. Nat Sci 8: 195-206.
- Ibekwe VI, Ubachi KC, Ezechi EU (2006) Effects of organic nutrient on microbial utilization of hydrocarbon on crude oil contaminated soil. Afr J Biotechnol 5: 983-986.
- Chikere CB, Okpokwasili GC, Chikere BO (2009) Bacterial diversity in a tropical crude oil-polluted soil undergoing bioremediation. Afri J Biotechnol 8: 2535-2540.
- Singh D, Fulekar MH (2007) Bioremediation of phenol using microbial consortium in bioreactor. Innovat Romanian Food Biotechnol 1: 31-36.
- Umanu G, Babade MF (2013) Biological degradation of Kerosene in soil amended with poultry droppings. Int J Adv Biol Res 3: 254-259.
- Nwoko CO, Okeke PN, Agwu OO, Akpan IE (2007) Performance of Phaseolus vulgaris L. in a soil contaminated with spent-engine oil. Afr J Biotechnol 6: 1922-1925.
- Akoachere JTK, Akenji TN, Yongabi FN, Nkwelang G, Ndip RN (2008) Lubricating oil degrading bacteria in soils from filling stations and auto-machanic workshops in Buea, Cameroon: Occurrence and characteristics of isolates. Afri J Biotechnol 7: 1700-1706.
- Atlas RM (1981) Microbial degradation of petroleum hydrocarbons: An environmental perspective. Microbiolog Rev 45: 180-209.
- Calomiris JJ, Austin B, Walker JD, Colwell RR (1976) Enrichment for estuarine petroleum-degrading bacteria using liquid and solid media. J Appl Microbiol 42: 135-144.
- Nwachukwu SCU (2000) Enhanced rehabilitation of tropical aquatic environments polluted with crude petroleum using Candida subtilis. J Environ Biol 21: 241-250.
- Obire O, Anyanwu EC, Okigbo RN (2008) Saprophytic and crude oil degrading fungi from cow dung and poultry droppings as bioremediating agents. Int J Agric Sci Technol 4: 81-89.
- Metzker ML (2005) Emerging technologies in DNA sequencing. Gen Res 15: 1767-1776.
- Metzker ML (2010) Sequencing technologies-the next generation. Nat Rev Genet 11: 31-46.
- Zhang J, Chiodini R, Badr A, Zhang G (2011) The impact of next-generation sequencing on genomics. J Genet Genom 38: 95-109.
- Meldrum C, Doyle MA, Tothill RW (2011) Next-generation sequencing for cancer diagnostics: a practical perspective. Clin Biochem Rev 32: 177-195.
- Netrutenko A, Taylor J (2012) Next-generation sequencing data interpretation: enhancing reproducibility and accessibility. Nat Rev Genet 13: 667-672.
- Wu K, Huang RS, House L, Cho WC (2013) Next-generation sequencing for lung cancer. Future Oncol 9: 1323-1336.
- Venter JC, Levy S, Stockwell T, Reminghton K, Halpern A (2003) Massive parallelism, randomness and genomic advances. Nat Genet 33: 219-227.
- Gkorezis P, Daghio M, Franzetti A, van Hamme JD, Sillen W, et al. (2016) The Interaction between Plants and Bacteria in the Remediation of Petroleum Hydrocarbons: An Environmental Persspective. Front Microbiol 7: 1836.
- Bruto M, Prigent-Combaret C, Muller D, Moenne-Loccoz Y (2014) Analysis of genes contributing to plant-beneficial functions in plant growth promoting rhizobacteria and related Proteobacteria. Scientific Reports 4: 6261.
- Toth CRA, Gieg LM (2018) Time course-Dependent Methanogenic crude oil biodegradation: Dynamics of Fumarate Addition Metabolites, biodegradative Genes and Microbial community composition. Front Microbiol 8: 2610.
- Gallego JLR, Loredo J, Llamas JF, Vazquez F, Sanchez J (2001) Bioremediation of diesel-contaminated soils: evaluation of potential in situ techniques by study of bacterial degradation. Biodeg 12: 325-335.
- Molina-Barahona L, Rodriguez-Vazquez R, Hernandez-Velasco M (2004) Vega-removal from contaminated soils by biostimulation and supplementation with crop residues. Appl Soil Ecol 27: 165-175.
- Qin G, Gong D, Fan MY (2013) Bioremediation of petroleum-contaminated soil by biostimulation amended with biochar. Int Biodet Biodegrad 85: 150-155.
- Zhao Y, Qu D, Hou Z, Zhou R (2015) Enhanced natural attenuation of BTEX in the nitrate-reducing environment by different electron acceptors. Environmental Technology 36: 615-621.
- Ladino-Orjuela G, Gomes E, Silva R, Salt C, Parsons JR (2016) Metabolic pathways for degradation of aromatic hydrocarbons by bacteria. Rev Environ Contam Toxicol 237: 105-121.
- Iwamoto T, Tani K, Nakamura K, Suzuki Y, Kitagwa M, et al. (2000) Monitoring impact of in situ biostimulation treatment on groundwater bacterial community by DGGE. FEMS Microbiol Ecol 32: 129-141.
- Evans FF, Rosado AS, Sebastian GV, Casella R, Holmstrom C, et al. (2004) Impact of oil contamination and biostimulation on the diversity of indigenous bacterial communities in soil microcosms. FEMS Microbiol Ecol 49: 295-305.
- Hazen, TC (2010) Biostimulation. In: Handbook of Hydrocarbon and Lipid Microbiology. Springer, Berlin, Germany pp: 4518-4527.
- DeBruyn JM, Sayler GS (2009) Microbial community structure and biodegradation activity of particle-associated bacteria in a coal tar contaminated creek. Environ Sci Technol 43: 3047-3053.
Citation: Ezekoye CC, Chikere CB, Okpokwasili GC (2018) Field Metagenomics of Bacterial Community Involved in Bioremediation of Crude Oil-Polluted Soil. J Bioremediat Biodegrad 9: 449. DOI: 10.4172/2155-6199.1000449
Copyright: © 2018 Ezekoye CC, et al. This is an open-access article distributed under the terms of the Creative Commons Attribution License, which permits unrestricted use, distribution, and reproduction in any medium, provided the original author and source are credited.
Select your language of interest to view the total content in your interested language
Share This Article
Recommended Journals
Open Access Journals
Article Tools
Article Usage
- Total views: 5648
- [From(publication date): 0-2018 - Dec 23, 2025]
- Breakdown by view type
- HTML page views: 4543
- PDF downloads: 1105

