Forecasting Climate Change Scenarios in the Bago River Basin, Myanmar
Received: 28-Aug-2017 / Accepted Date: 20-Oct-2014 / Published Date: 30-Oct-2014 DOI: 10.4172/2157-7617.1000228
Abstract
This study aims to forecast the climate change scenarios of Bago River Basin in Myanmar. A delta change method was used to correct the bias of maximum and minimum temperature and precipitation. The future projection period from 2010-2100 is classified into 2020s (2010-2039), 2050s (2040-2069), and 2080s (2070-2099) for analyzing meteorological parameters under RCP4.5 and RCP8.5 scenarios. It is observed that average annual maximum and minimum temperatures are projected to rise in the entire basin under both scenarios — most significantly in the 2080s. Average summer temperature is projected to decrease by approximately 0.25°C in the first century period under both RCPs. However winter season witnessed an increase in average temperature of 1.5-2.5°C, following by the rainy season with increase of average temperature of 0.9-2.6°C in future. Average annual precipitation shows a distinct increase in all three periods with the greatest upturn in the 2050s. Winter season is projected to receive more precipitation for both scenarios with an average increase of approximately 200 mm, whereas summer season shows the least rainfall change (25 mm) under both future scenarios. The highest mean monthly precipitation occurs in September during the 2020s (933 mm) and in July during the 2080s (868 mm) respectively. The average annual precipitation is projected to be at maximum in the 2020s (4085 mm, 40% increase) for RCP4.5 and in the 2050s (4263 mm, 43% increase) under RCP8.5.
Keywords: Climate change; Temperature; Precipitation; Bago River Basin; RCP4.5 and 8.5 scenarios
8224Introduction
Industrialization and urbanization are increasing dramatically, along with population growth all over the world. Increased emission of greenhouse gases, especially CO2, causes global warming. The global and regional climate has been changing as evidenced by increases in temperature and rainfall intensity. The impacts of climate change; primarily driven by global warming, are highly extensive, complicated, and uncertain. Global surface temperature has risen by 0.74°C during the twentieth century and the warming trend has accelerated in the last 50 years [1]. Climate change impacts, such as changes in precipitation and temperature, are leading to more floods and droughts events each year. Climate variability and change has a huge effect on the general well-being of communities across the world, and many living organisms are sensitive to changing climate patterns. Availability and variability of water resources have been affected by climate change effects. Climate change has affected water resources globally and regionally in the last 30 years. In Particular, rainfall, known as the main driver of hydrological cycle, has been varying in most parts of the world. The change in climate variables such as rainfall and temperature has redistributed the public health, industrial, irrigation, and municipal water demands and the ecosystem [2].
Climate change is threatening the socio-economic development of Myanmar. The study area, the Bago River Basin is the smallest of the ten basins in Myanmar (Minister of Transport, 2000). The precipitation and river flow in the Bago River Basin have changed, resulting in floods and droughts in this watershed because of climate change impacts. Consequently, floods and droughts have caused degradation of natural and water resources [3]. It was reported that annual rainfall has decreased and seasonal inflow to this watershed was also reduced during the summer season. In summer, many areas in the Bago River Basin are known for their scanty annual rainfall, very high rates of evaporation and consequent insufficiency in renewable water resources, and reduced water storage capacity. Water yields declined at the basin outlet during the summer and winter but increased during the rainy season. The outflow from this basin is insufficient for the downstream area. On the other hand, there are also serious floods in the Bago River Basin when cyclones pass through the coastal area. During the rainy season, a rapid flow occurs when there is a large amount of water in the river. In the dry period, especially in March because there is less water in the river, the flow of the river reduced to a velocity ranging from 6-40 cm/s. In the rainy season, a greater quantity of water in the river at the flood level of 860 cm causes the river to regain its flowing rate of 137 cm/s, and as the flood level becomes higher to the point of 900 cm there is an increase in the flow rate, for instance to 200 cm/s [4].
Prediction of rainfall and temperature several months in advance has long been possible by analyzing sea surface temperature and air pressure differences at key locations around the world. General Circulation Models (GCMs) have been widely used to predict the future changes in meteorological parameters such as temperature and precipitation. However, their outputs are temporally and spatially very coarse [5]. Although these outputs are useful at continental and global levels, finer resolution outputs are needed to assess the climate change impacts on the environment and hydrological cycle at the local and regional levels. To use the local and regional scales of 0–50 km and 50 × 50 km, many methods for downscaling have been developed [6]. As climate models are not perfect, the simulated climatology will differ somewhat from observed climatology. The model state will drift towards the model climate as the forecast progresses, and this drift will be confounded by the climate evolution being predicted. For this reason, climate predictions are usually bias corrected so that it will be useful for impact and adaptation studies.
The delta change/ratio method is the most straightforward method for correcting the coarse scale climate projections with reference to a high resolution observed climate baseline. Various researchers have successfully used this method in impact studies. Most of the studies in relation to forecasting climate change scenarios using RCPs were conducted in European countries. However few studies have used bias correction methods to project climate change scenarios at local level in Asia [7].
Seasonal climate forecasts are very useful for different communities and decision makers. These forecasting methods also aid in improving water management and can greatly benefit farmers and land managers, especially in areas where rainfall is inherently variable and unreliable. For climate change adaptation, both seasonal and annual climate forecasting are indeed becoming important elements because the changes in seasonal temperature and precipitation have a significant impact on crop production and water supply. High seasonal temperature increases water scarcity during summer and high seasonal rainfall also increases water insecurity and stress. Considerable progress has been made during the last decade in understanding the atmospheric and oceanic processes causing floods and droughts. This knowledge is now used to make more accurate seasonal climate forecasts. Predicting climate change scenarios represents a major twenty-first century scientific advancement. The annual and seasonal climate predictions are based on local observation of past and current climate. Several past studies [8-10] have used seasonal climate forecasts. However, many studies have used the Statistical Downscaling Model (SDSM) to forecast seasonal temperature and rainfall patterns. SDSM is a statistical downscaling method to establish empirical relationships between GCM output, climate variables and local climate. The main concept of this method is to provide some kind of regression relationship and local scale information in climate change studies.
So far no study have reported the future changes in maximum and minimum temperature and precipitation under RCP4.5 and 8.5 scenarios using bias corrected projections in the Bago River Basin in Myanmar. Therefore the major objectives of this study are to forecast the temperature and precipitation for the Bago River Basin and to analyze the changes in future temperature and precipitation under different future emission scenarios. This study envisions capturing the benefits of the new, detailed climate forecasts and could be used for improvement of agricultural and municipal water management in the Bago River Basin. The outcome of this study is expected to improve water management decisions, better adaptation, and preparation for climate change.
Study Area and Data Description
Study area
The Bago River Basin is located between 95°53´ 30"E – 96°43´30" E longitudes and 16°43´ 15" N-18°26´17" N latitudes. The study area is amongst the most fragile environments in Myanmar and is a repository of biodiversity, water, and many ecosystem services. The total population of the Bago River Basin stood at 5.327 million in 2010 according to a government survey, and its population density is 1091 per km2. The Bago River (335 km), draining a total area of 4883 km2, is the main river of the Bago River Basin. A large portion (almost twothirds) of the Bago River, including the river’s source, lies in the Bago Township of the Bago Division, while only a small portion (the river mouth) falls under the Yangon Division. The main river originates south of the Bago mountain range, then flows southward and drains into the Yangon River near Yangon. The highest elevation of the sources of the Bago River is about 800 m above sea-level in the southern Bago mountain range. Hence, the whole river system is located in Lower Myanmar between the two larger systems of the Sittaung River (420 km) on the east and the Ayeyarwaddy (1550 km) and the Myintmakha Rivers on the west.
The local people rely on water resources of this watershed for their livelihoods — fishing and seasonal farming. Farmers represent 40% of the local population, farming over 89,000 hectares annually (Ministry of Agriculture and Irrigation, 2012). Fishermen comprise 30% of the population; 20% are self-employed, while the rest are in government service. Most of the local people have poor living standards. The impacts of climate change have been visible in this watershed with the dawn of the twenty-first century. Increase in the surface runoff, land cover changes, forest degradation, and soil erosion are the major impacts instigated by climate change in the Bago River Basin. Climate change has rendered the poor people more vulnerable to water scarcity, food security, and hunger [3]. Moreover, the drainage systems of the Bago River Basin are in poor condition and are the major cause of flooding. Changes in temperature and precipitation are expected to significantly affect the hydrological process of Bago River Basin. This study is the first study of forecasting climate change in this Bago River Basin in Myanmar.
Data description
Historical observed daily data of maximum temperature (Tmax), minimum temperature (Tmin), and precipitation (P) are collected from the Meteorology and Hydrology Department of Myanmar. The dataset obtained are four climate stations located inside and near the basin (Figure 1) for the period 1975–2005. Daily stream flow data consists of two meteorological stations (Bago and Zaungtu as seen in Figure 1) in the basin for a period of 1990 to 2009. The brief statistics of these climate stations for the period 1975–2005 are shown in Table 1. In this study, landuse map can be classified into 9 types of land covers such as agriculture (39.7%), Grassland (32.4 %), Thistle (0.11%), Forest (9.14%), Lake (0.08%), Open land (10.51%), Pond (3.37%), River (0.15%) and Orchid (4.54%) respectively with the use of landuse map developed from 30 m resolution raster data with projection of WGS_1984_ Zone_47N extracted from USGS with the use of image processing for the year 2010. Three major classes of soils can be found: Eutric Gleysols (Ge37-2/3a) (59.26%), Eutric Gleysols (Ge50-2/3a) (2.04%) and Nitosols (Nd55-2/3b) (38.7%) according to Digital Soil Map of the World (DSMW). In addition to the model projections, the simulations from six global climate models participating in CMIP5 were used. The simulations cover the period from 1975–2005 (historical run) and from 2010–2099 with IPCC Representative Concentration Pathways 4.5 (RCP4.5) and 8.5 (RCP8.5). The RCP4.5 is a stabilization scenario where total radioactive forcing is stabilized before 2100 by employing technologies and strategies to reduce greenhouse gas emissions. The RCP8.5 is a business as usual scenario and characterized by increasing greenhouse gas emissions and high greenhouse gas concentration levels. Daily data of climatic variables (Tmax, Tmin, and P) are built by converting the original downloaded file (netCDF) of GCMs into raster data using ArcGIS 10.1. The temperature and precipitation from each model are then bias corrected by using the delta change method. All of the meteorological stations used in this study do not have the missing data within the baseline period (1975–2005) as mentioned in Table 1.
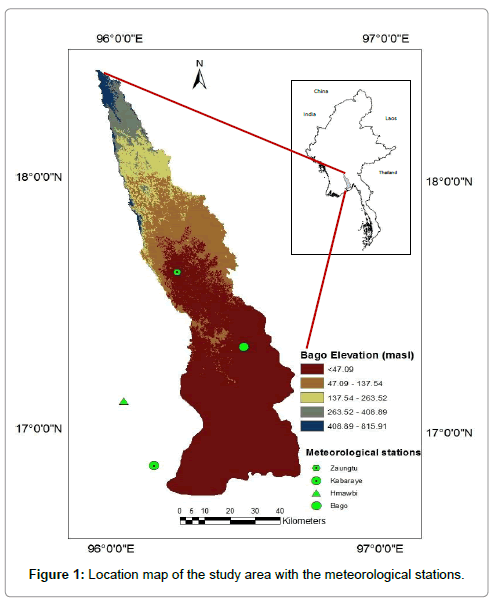
Figure 1: Location map of the study area with the meteorological stations.
| Station | Avg annual rainfall (mm) | Mean Tmax (°C) | Mean Tmin (°C) | Tmean (°C) | Lat_N (degree) | Lon_E (degree) | Elevation (masl) |
|---|---|---|---|---|---|---|---|
| Bago | 3185 | 32.6 | 20.6 | 26.6 | 17.3 | 96.5 | 19 |
| Kabaraye | 2607 | 33.1 | 21.2 | 27.2 | 16.9 | 96.2 | 31 |
| Zaungtu | 2746 | 33 | 20.1 | 26.6 | 17.6 | 96.2 | 37 |
| Hmawbi | 2541 | 33.1 | 21.7 | 27.4 | 17.1 | 96.0 | 22 |
Tmean= mean temperature, Tmax= maximum temperature, Tmin= minimum temperature
Table 1: Statistics of meteorological parameters at four meteorological stations for the period 1975–2005 in the Bago River Basin.
Climatic conditions in the study area
The Bago River Basin has a tropical monsoon climate with a heavy seasonal rainfall, high temperature, and distinct wet and dry seasons. The mean monthly rainfall and temperature regimes of all the meteorological stations (Figure 1) used in this study for the period 1975–2005 are shown in Table 1. According to the meteorological records, January and December are the coldest months, whereas April is the hottest month. Table 1 illustrates that the Kabaraye and Hmawbi stations have a slightly greater average maximum temperature. The latter has a higher average minimum temperature as well as mean temperature. All stations experience one big peak of maximum temperature and minimum temperature in April shown in Figure 2. The basin scale average annual values for maximum temperature, minimum temperature, and mean temperature are 33°C, 21°C, and 27°C respectively. Analysis of time series data for all the stations from 1975– 2005 has shown that the Kabaraye station as the hottest station for both maximum and minimum temperatures in 1993. The year 1993 is also the hottest with mean temperature of 27.4°C during the baseline period for the whole basin. However, taking spatial variability into account, the annual range will be less in the south compared to the north because the upper basin is located more inland than the lower. The basin scale mean maximum temperature peaks in April to 37.5°C and plunges down in August to 29.4°C. The mean minimum temperature is lowest in January at 16.0°C, and the highest in May at 24.3°C as mentioned in Figure 3. Increase in temperature has significant influence on water supply in the region.
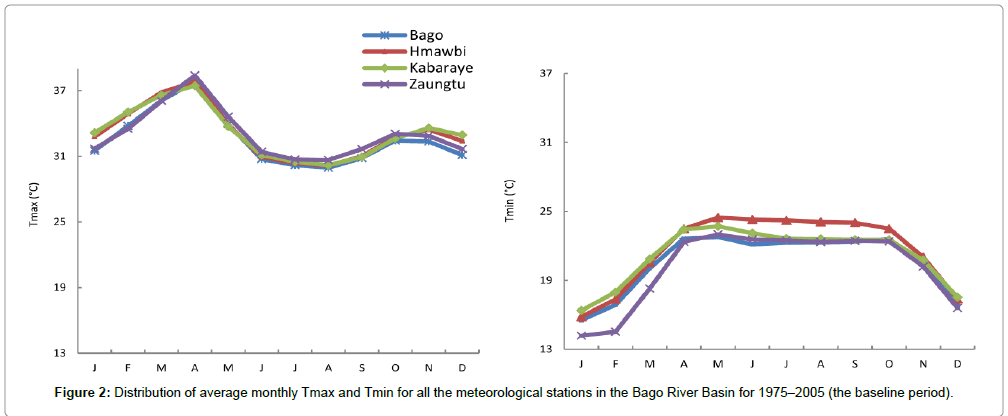
Figure 2: Distribution of average monthly Tmax and Tmin for all the meteorological stations in the Bago River Basin for 1975–2005 (the baseline period).
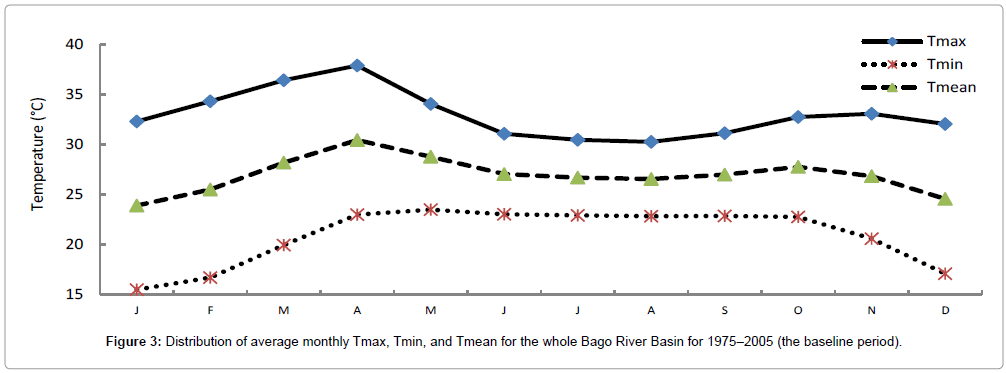
Figure 3: Distribution of average monthly Tmax, Tmin, and Tmean for the whole Bago River Basin for 1975–2005 (the baseline period).
During the last 30 years from 1975-2005, July is the wettest month in the whole basin (Figure 4). Figure 4 and Table 1 illustrate that Bago station, with an average annual rainfall of 3185 mm, is the wettest location out of the four and 20% wetter than the station with the lowest rainfall (Hmawbi). It can be observed that Bago station is also the wettest station in 1997. The high average annual precipitation of 3143 mm occurred in 1997 for the whole basin. Within the baseline period, Bago River Basin has had an average annual rainfall of 2980 mm with 130 rainy days per annum on average. The monthly distribution of precipitation is directly related to the southwest monsoon. The monsoon precipitation (May to September) comprises 91.02% of the yearly cumulative. With 46% of annual precipitation being shared between them; July and August are the wettest months for the basin. On the other hand, January and February are the driest months. The frequency and magnitude of extreme events have gradually increased in the last 10 years. Extreme events are more challenging than gradual changes in this area. Floods and droughts change the livelihood when extreme climate events occur concurrently.
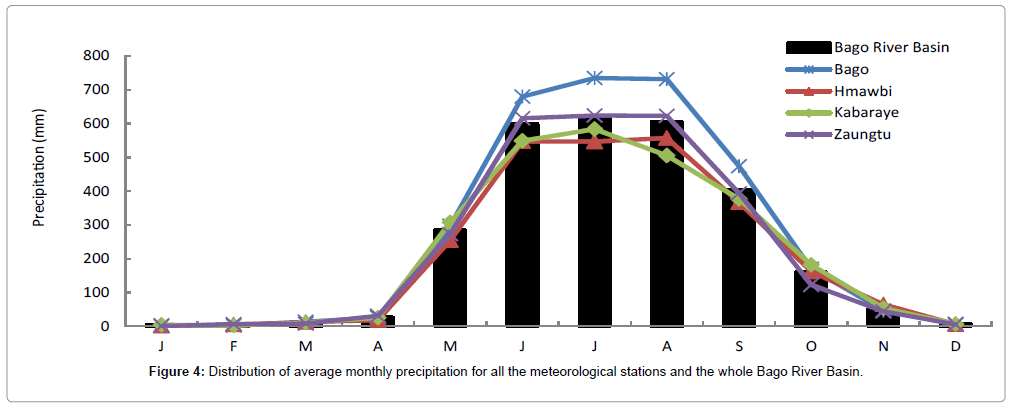
Figure 4: Distribution of average monthly precipitation for all the meteorological stations and the whole Bago River Basin.
Methodology
Description of bias correction
The performance of bias corrected climate model outputs is satisfactory in different hydro climatological studies [11,12]. For future climate, bias correction has led to a higher level of agreement among the models in predicting the magnitude and capturing the spatial pattern of extreme climate indices. Among many kinds of methods for bias correction, the delta change/ratio method is applied in this study. This method is preferable when Regional Climate Model (RCM) output is not available for the rapid assessment of multiple climate change scenarios or when multi GCM experiments are required, as in this case. The GCM outputs cannot be used directly to local scale or basin scale due to coarse resolution. Therefore, this delta change method can be applied to correct the errors instead of using RCM. The delta change method assumes the future model biases for both mean and variability will be the same as that of present day simulations. Changes in the climate are calculated from model results and applied to the baseline data. For example, changes in climate can be calculated either as the difference or ratio between the simulated future climate and the simulated baseline climate. These differences or ratios are then applied to the observed baseline climate series. Generally, differences are applied to temperature and the ratio is applied to precipitation. The approach uses only 10 or 30 year average monthly mean changes in the GCM simulations. Consequently, the confidence in the climate model can be moderated in terms of ability of the model to simulate the daily variability, but on the other hand, the assumption must be made that there is no change in inter-annual and daily variability between the baseline and future climate. For example, in the case of precipitation, the wet day variability will not change, since only wet days in the baseline change and all observed dry days will also be dry in the scenario time series. Various researchers have successfully used this method in impact studies [9,13]. The delta change/ratio method uses observed climate as a baseline and the capability of the GCM to produce simulations comparable to observed climate is less crucial. It is stable and always gives results that can be related to present conditions. Constraint associated with the Delta change/ratio method is that the number of rainy days for the observed climate remains unchanged for the future climate. Similarly, all extreme precipitation events are modified by the same factor. In this technique, the observed climate time series is adapted to estimated monthly climate changes from the GCM output. The future monthly temperature shifts (Tf) and precipitation (Pf) scaling factors are calculated by Equations 1 and 2 respectively. Equations 3 and 4 are then used in predicting the future meteorological parameters.
 (1)
(1)
 (2)
(2)
Where, P is used for the present and f is used for the future time period. The future scenarios are then generated using Equations 3 and 4.
 (3)
(3)
 (4)
(4)
Where  is for future temperature,
  is for future precipitation and PPT is used for precipitation
Selection of GCMs
For the IPCC AR5, the simulations from the new generation of state-of-the-art global climate models are available for analysis within the Coupled Model Intercomparison Project Phase 5 (CMIP5) [14]. To choose GCMs from CMIP5, the performance indicator coefficient of determination (R2) and Root Mean Square Error (RMSE) are compared with and without bias correction in the study. The R2 and RMSE of monthly average meteorological parameters; precipitation, minimum temperature, and maximum temperature are developed between GCM data and observed station data for the period 1991-2005. These values are compared with the values of simulated meteorological parameters provided with bias correction in the same period for each station. Improvement in R2 (higher value) and RMSE (lower value) is the criteria for decision making. As a general rule of thumb, R2 and RMSE of meteorological parameters after bias correction must be greater and lower than those before bias correction. Results (Table 2) has shown that six GCMs: BCC-CSM1.1, CCSM4, MIROC5, MRI-CGCM3, BNU-ESM, and FGOALs-g2 can be used for the study area with good values of R2 and RMSE at four stations in the Bago River Basin and that bias correction is successfully carried out using the chosen method. The R2 and RMSE are compared before and after bias correction and the improvement in the values are observed after bias correction (Table 2).
| Station | Meteorological parameter | Before Bias correction | After Bias correction |
|---|---|---|---|
| Bago | Precipitation | R2=0.6433 RMSE=7.313 |
R2=0.7785 RMSE=4.894 |
| Tmax | R2=0.3686 RMSE=4.24 |
R2=0.679 RMSE=1.68 |
|
| Tmin | R2=0.4003 RMSE=5.94 |
R2=0.5996 RMSE=2.733 |
|
| Zaungtu | Precipitation | R2=0.5139 RMSE=7.881 |
R2=0.7308 RMSE=5.335 |
| Tmax | R2=0.3748 RMSE=2.829 |
R2=0.7346 RMSE=1.693 |
|
| Tmin | R2=0. 3905 RMSE=5.036 |
R2=0.5875 RMSE=2.682 |
|
| Kabaraye | Precipitation | R2=0.2982 RMSE=21.066 |
R2=0.6743 RMSE=6.371 |
| Tmax | R2=0.3061 RMSE=3.298 |
R2=0.6894 RMSE=2.865 |
|
| Tmin | R2=0.3204 RMSE=1.854 |
R2=0.5048 RMSE=0.987 |
|
| Hmawbi | Precipitation | R2=0.5778 RMSE=7.739 |
R2=0.7588 RMSE=5.135 |
| Tmax | R2=0.4031 RMSE=5.469 |
R2=0.5812 RMSE=3.446 |
|
| Tmin | R2=0.3178 RMSE=9.8407 |
R2=0.6812 RMSE=6.884 |
R2= Coefficient of determination and RMSE=Root mean square error
Table 2: Summary statistics of observed and simulated precipitation and temperature at four stations of the Bago River Basin for the period 1991–2005 before and after bias correction.
The monthly time series of observed and simulated mean Tmin, Tmax, and precipitation average over the respective stations in the Bago River Basin are shown in Figures 5 and 6. The mean monthly values of both Tmin and Tmax bias corrected by the model for the baseline period are in close agreement with those from the observed values. These results indicate that this bias correction can reliably simulate the Tminand Tmax at all the stations and thus can be used with confidence for both temperature and precipitation bias correction in the Bago River Basin. The annual patterns of Tmin, Tmax, and precipitation are satisfactorily simulated for the whole basin. The results indicate that all the models can produce the meteorological parameters quite well and the statistical results were satisfactory for each of the four stations in the Bago River Basin. The models listed in Table 3 have different spatial resolutions and different realization numbers (ensemble runs) for the historical run and future scenarios. These GCMs cover different resolutions, varying from 0.75°×0.75° to 2.815°×2.815° and come from different climate centers around the world and have vintage after year 2010. The data for these GCMs in selected RCP4.5 and 8.5 scenarios is available for the period 2010–2099. The future climate projections derived from these RCP4.5 and 8.5 scenarios provide updated research for climate change. GCMs are used separately for their global climate data. After that, each GCM is compared with observed data to calculate changes relative to observed value. Finally average changes of all GCMs are calculated.
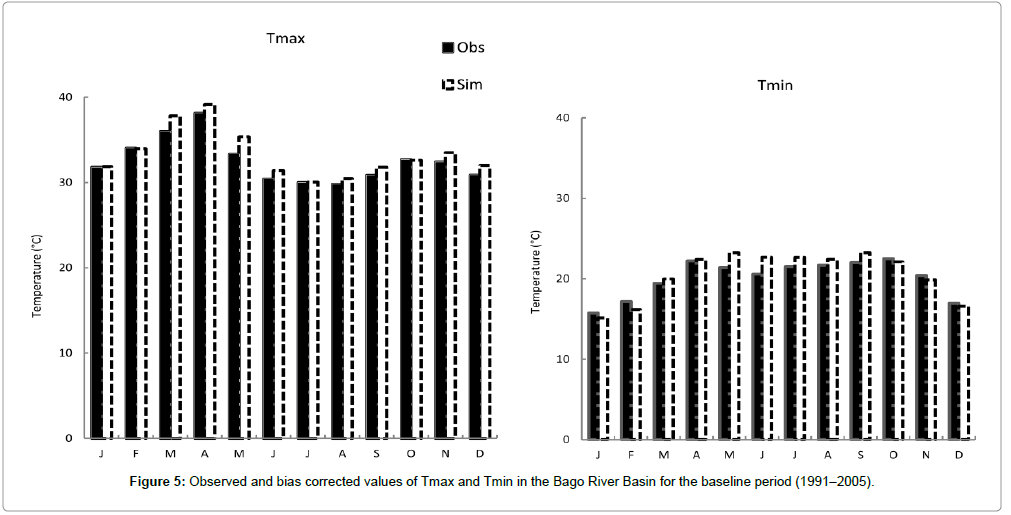
Figure 5: Observed and bias corrected values of Tmax and Tmin in the Bago River Basin for the baseline period (1991–2005).
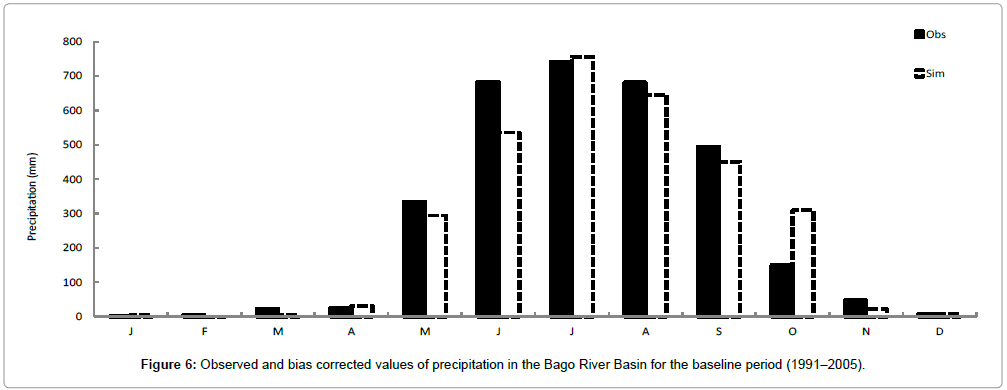
Figure 6: Observed and bias corrected values of precipitation in the Bago River Basin for the baseline period (1991–2005).
| Model | Resolution (long by lat) | Scenarios | Origin |
|---|---|---|---|
| BCC-CSM1.1 | 2.815 °×2.815 ° | RCP2.6RCP4.5RCP6RCP8.5 | Beijing Climate Center, China |
| CCSM4 | 1.25 °×0.9 ° | RCP2.6RCP6RCP8.5 | National Center for Atmospheric Research, USA |
| MIROC5 | 1.40 °×1.40 ° | RCP2.6RCP4.5RCP6RCP8.5 | Atmosphere and Ocean Research Institute, Japan |
| MRI-CGCM3 | 1.125 °×1.125 ° | RCP2.5RCP4.5RCP8.5 | Meteorological Research Institute, Japan |
| BNU-ESM | 0.75 °×0.75 ° | RCP2.6RCP4.5RCP8.5 | College of Global Change and Earth System Science |
| FGOALs-g2 | 1.9 °×1.9 ° | RCP2.6RCP4.5RCP8.5 | Chinese Academy Science |
Source : IPCC, 2007
Table 3: A list of the climate models used in this study with a brief introduction of their origin, resolution, and realization available for each climate change scenario.
Analysis of Temperature and Precipitation Projections
Temperature
To understand the variations in temperature and precipitation, the projected changes in both variables are analyzed for three periods: the 2020s (2010-2039), the 2050s (2040-2069), and the 2080s (2070- 2099) relative to the 1975-2005 climatology under the RCP4.5 and 8.5 scenarios. A 30-year timescale is used for the baseline period as recommended by IPCC [1]. In the whole study area, the simulated mean Tmax in April is observed to be 40.7°C under RCP8.5 and 39.2°C under RCP4.5 scenarios. In addition, the simulated mean Tmin in April is expected to reach 25.5°C under RCP8.5 and 25.4°C under RCP4.5 respectively. An increase of 4.7°C in Tmax under RCP8.5 and 4.2°C under RCP4.5 is projected as compared to the mean observed maximum temperature of the Bago River Basin. It shows an increase of Tmin of 4.5°C under RCP8.5 and 4.1°C under RCP4.5 compared with the mean of the observed minimum temperature of the whole basin. It can be concluded that, at the basin scale, the projected mean temperature will be higher than the observed temperature with peak values in the month of April under both scenarios. The simulated maximum temperature is projected to be the highest in April, while the minimum temperature is observed to be at its peak in May under both RCPs for all three periods. However, the mean temperature is projected to be highest in April under both scenarios for all three periods. The mean temperature is projected to be at 38.4°C (2020s), 38.8°C (2050s), and 39.3°C (2080s) in April under RCP4.5 and at 38.5°C (2020s), 39.4°C (2050s), and 40.8°C (2080s) under RCP8.5 scenarios.
The change in the mean monthly maximum temperature and minimum projected by 6 GCMs under RCP4.5 and 8.5 scenarios relative to the baseline period is shown in Figure 7. Projections of all the GCMs under both scenarios indicate an increase in Tmax in each month for all three future periods except the 2020s in January and February under both scenarios. Compared to present-day conditions, Tmax over the basin is projected to increase by 2.9°C by the 2080s under the high emission scenario RCP8.5 and 1.7°C under RCP4.5. Strong temperature change for all three periods (>1.8°C) appears along the whole basin in May and November under RCP4.5, whereas under RCP8.5, It is observed that higher temperature change will occur for all three periods (>2.7°C) only in May. Moderate temperature change for all three periods (>1°C) appears in April, June, October, and November under RCP4.5 and only in November under RCP8.5 (>2°C). Although the observed Tmax is high in April in the whole basin, the temperature change for April is quite moderate. However for August, the observed Tmax is low, but its temperature change is high in the 2080s under RCP8.5 scenario.
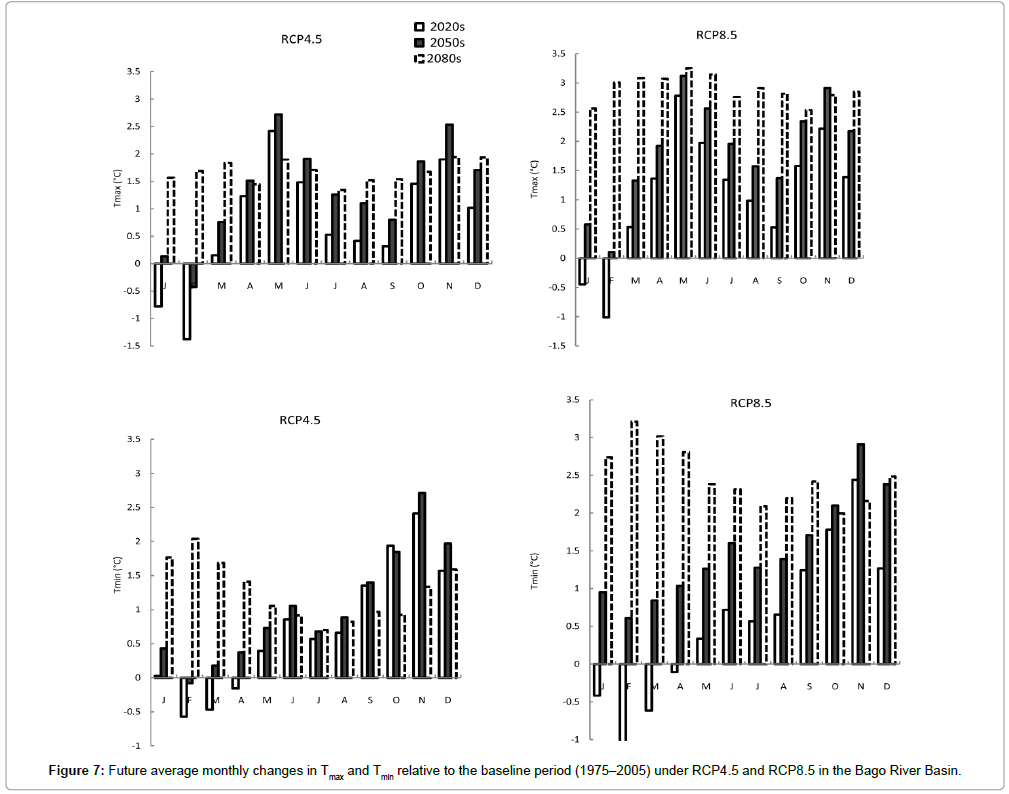
Figure 7: Future average monthly changes in Tmax and Tmin relative to the baseline period (1975–2005) under RCP4.5 and RCP8.5 in the Bago River Basin.
For minimum temperature, except for the months of January, February, March, and April of the 2020s, all projections under both RCPs indicate an increase in Tmin. The Tmin over the whole basin is projected to increase by 2.5°C by the 2080s under RCP8.5 and 1.3°C under RCP4.5. Strong minimum temperature change for all periods (>1.3°C) appears in November under RCP4.5 and also (>2°C) under the RCP8.5 scenario. Moderate temperature change for all three periods (>1.5°C) appears in December under RCP4.5 and October under RCP8.5 (>1.8°C). According to observed data for all of the four stations, Tmin is highest in May. But its corresponding temperature change as per the projections is not high except for the 2080s under RCP8.5. It is also observed that mean temperature will undergo the greatest change (rise) in the 2080s as most of the high temperature changes are observed in this period.
Table 4 shows mean seasonal and annual Tmax and Tmin changes in the Bago River Basin under RCP4.5 and 8.5 scenarios for all periods. The seasonal results are based on three clearly distinguished seasons in Myanmar: summer (JFMA), rainy (MJJA), and winter (SOND). Almost all GCMs under both RCP scenarios indicate an increase in Tmax and Tmin for seasonal as well as annual projections. Mean annual Tmax is projected to increase by 0.7-1.7°C and 1.1-2.9°C under RCP4.5 and 8.5 respectively. Similarly, all seasons show positive (increasing) changes under both scenarios in all three periods except in summer of the 2020s for RCP4.5. Under the RCP8.5 scenario, all seasonal and annual changes in Tmax are projected to be equal to 2.7°C or higher in the 2080s. Similar future changes in Tmax are projected under RCP4.5 but at much smaller magnitude. Mean annual Tmin is projected to rise by 2.5°C and 1.3°C under RCP8.5 and 4.5 respectively. In the case of seasonal changes, winter in the 2050s is affected the most under RCP4.5, while for the 2080s it is summer as per RCP8.5. The same was the case with Tmax. Future changes in Tmin are projected to be larger in magnitude under RCP8.5 than RCP4.5, reflecting the same pattern as for Tmax projections.
| Periods | RCPs | Increase / decrease of Tmax and Tmin (°C) due to GCMs w.r.t. baseline period (1975–2005) | |||||||
|---|---|---|---|---|---|---|---|---|---|
| Annual change | Summer season change | Rainy season change | Winter season change | ||||||
| Tmax | Tmin | Tmax | Tmin | Tmax | Tmin | Tmax | Tmin | ||
| 2020s | RCP4.5 | 0.7 | 0.7 | -0.2 | -0.3 | 1.2 | 0.6 | 1.2 | 1.8 |
| RCP8.5 | 1.1 | 0.6 | 0.1 | -0.5 | 1.8 | 0.6 | 1.4 | 1.7 | |
| 2050s | RCP4.5 | 1.3 | 1.0 | 0.5 | 0.2 | 1.7 | 0.8 | 1.7 | 2.0 |
| RCP8.5 | 1.8 | 1.5 | 1.0 | 0.9 | 2.3 | 1.4 | 2.2 | 2.3 | |
| 2080s | RCP4.5 | 1.7 | 1.3 | 1.6 | 1.7 | 1.6 | 0.9 | 1.8 | 1.2 |
| RCP8.5 | 2.9 | 2.5 | 2.9 | 2.9 | 3.0 | 2.2 | 2.7 | 2.3 | |
Table 4: Future seasonal and annual changes in Tmax and Tmin relative to the baseline period (1975–2005) under RCP4.5 and RCP8.5 in the Bago River Basin.
The boxplots in Figure 8 show the mean annual changes in Tmax and Tmin in the 2020s, 2050s, and 2080s as projected by six GCMs under RCP4.5 and 8.5 scenarios relative to the baseline. Projections of all the GCMs under both scenarios indicate an increase in both annual Tmax and Tmin for all three future periods. While it is evident from the whiskers of the boxplots that the GCMs do not agree on the magnitude of change, they do agree that the range of annual temperature change will increase with the time horizon. The box represents the middle 50% range and the bar represents the median value. The whiskers at the two ends represent the extreme projections. The small size of the box indicates more agreement among the GCMs. The projections of annual Tmax and Tmin changes under RCP8.5 are higher than RCP4.5 in all periods except the 2020s for Tmax. The differences between projected values become larger in accordance with the choice of scenario during the late-century periods. This sharp difference is because of the significant increase among the different emission scenarios themselves. The median values of the projections justify this finding. During the 2080s, the median for Tmax value as projected under the RCP8.5 scenario is 1.1°C higher than as projected under the RCP4.5 scenarios. During the same period, the change in Tmin is 2.2°C higher for RCP8.5 than RCP4.5 as projected by median values. This will influence the seasonal flow during the dry season.
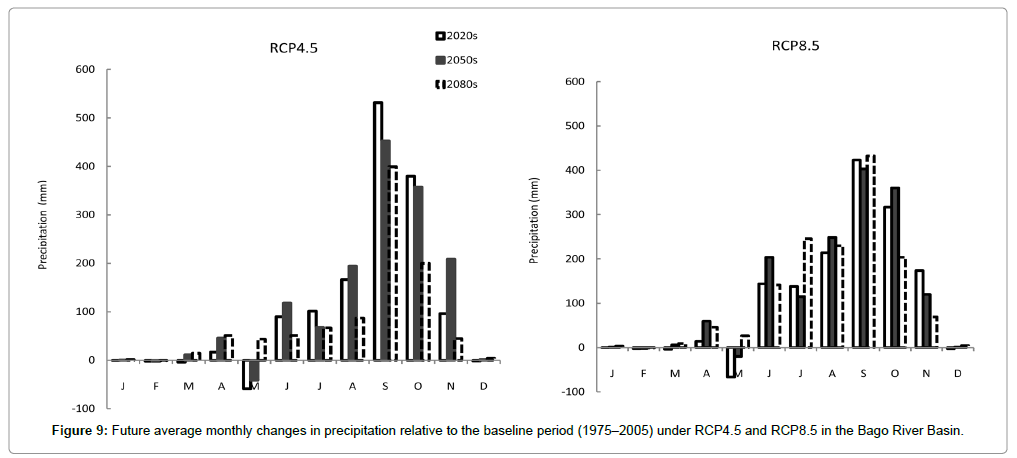
Figure 8: Changes in annual average Tmax and Tmin for the 2020s, 2050s, and 2080s relative to the baseline period (1975–2005) under RCP4.5 and RCP8.5 in the Bago River Basin.
Precipitation
The simulations of mean monthly precipitation under RCP4.5 and 8.5 scenarios can be compared with the baseline period for the whole basin as shown in Table 5. The peak observed precipitation in the whole basin can be seen in July, but the simulated precipitation peaks change according to the scenarios. The September is observed at peak precipitation level (934 mm) in the 2020s, 855 mm in the 2050s under RCP4.5, and 826 mm in the 2020s under RCP8.5. The other months of peak precipitation are August (691 mm) in the 2080s under RCP4.5, 806 mm in the 2050s under RCP8.5, and July (868 mm) in the 2080s under RCP8.5. Under the RCP4.5 scenario, the simulated annual precipitation levels are observed to be 4085 mm (a 37% increase from observed annual precipitation) in the 2020s, 4185 mm (40% increase) in the 2050s, and 3157 mm (6% increase) in the 2080s. For the RCP8.5 scenario, the simulated annual precipitation is predicted at 4116 mm (a 38% increase from the baseline data) in the 2020s, 4263 mm (a 43% increase), and 4178 mm (a 40% increase) in the 2080s.
| Month | Average monthly precipitation (mm) | ||||||||
|---|---|---|---|---|---|---|---|---|---|
| Baseline | RCP4.5 | RCP8.5 | |||||||
| 2020s | 2050s | 2080s | 2020s | 2050s | 2080s | 2020s | 2050s | 2080s | |
| January | 2.2 | 2.2 | 2.2 | 2.1 | 2.8 | 3.7 | 2.0 | 3.3 | 5.2 |
| February | 3.9 | 3.9 | 3.9 | 1.9 | 1.8 | 3.2 | 1.2 | 1.6 | 2.8 |
| March | 11.0 | 11.0 | 11.0 | 7.2 | 22.4 | 25.4 | 7.1 | 16.6 | 19.9 |
| April | 25.1 | 25.1 | 25.1 | 41.9 | 71.0 | 76.4 | 39.0 | 84.6 | 71.1 |
| May | 283.1 | 283.1 | 283.1 | 224.6 | 242.5 | 326.8 | 216.7 | 262.8 | 309.5 |
| June | 597.8 | 597.8 | 597.8 | 687.6 | 716.3 | 649.2 | 741.6 | 801.6 | 738.9 |
| July | 622.2 | 622.2 | 622.2 | 723.5 | 689.9 | 689.1 | 759.8 | 736.6 | 867.6 |
| August | 604.1 | 604.1 | 604.1 | 770.7 | 798.6 | 691.2 | 818.0 | 852.1 | 833.7 |
| September | 402.6 | 402.6 | 402.6 | 933.8 | 855.0 | 421.7 | 825.9 | 805.7 | 834.8 |
| October | 159.2 | 159.2 | 159.2 | 538.8 | 516.1 | 163.9 | 476.3 | 519.1 | 362.8 |
| November | 52.2 | 52.2 | 52.2 | 148.5 | 261.1 | 97.0 | 225.7 | 172.1 | 121.0 |
| December | 6.1 | 6.1 | 6.1 | 4.6 | 7.7 | 10.0 | 3.3 | 7.0 | 10.3 |
Table 5: Average monthly precipitation in the Bago River Basin during the baseline period (1975–2005) and the three future periods under RCP4.5 and 8.5 scenarios.
The annual precipitation under RCP 4.5 and 8.5 do not show a constant trend but rather fluctuate throughout the 2010–2099 period. Rainfall shows the greatest drop of 70 mm in May in the Bago River Basin for both scenarios. The highest rise in precipitation fluctuation is projected for the month of September. The months of December, January, and February shows comparatively insignificant fluctuations. The changes in precipitation can play an important role in causing the shift of weather patterns from 2010–2099 (Figure 9). The column plot of Figure 10 presents the changes in mean annual and seasonal precipitation for the whole basin under both scenarios. Mean annual precipitation is estimated to increase by 30–120 mm under RCP4.5 and by 110–125 mm under RCP8.5. Annual precipitation during the 2080s under RCP4.5 is projected to decrease by 90 mm compared with that projected by RCP8.5.
Figure 9: Future average monthly changes in precipitation relative to the baseline period (1975–2005) under RCP4.5 and RCP8.5 in the Bago River Basin.
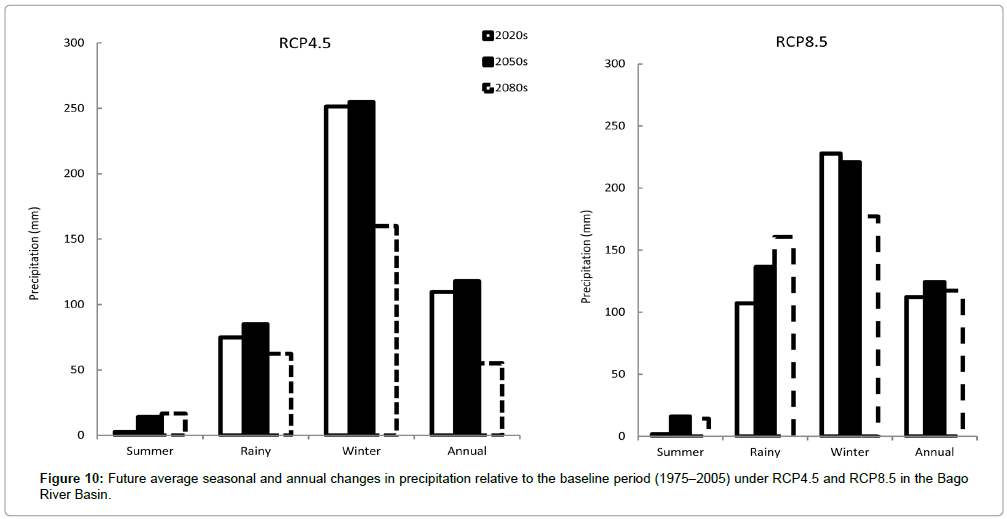
Figure 10: Future average seasonal and annual changes in precipitation relative to the baseline period (1975–2005) under RCP4.5 and RCP8.5 in the Bago River Basin.
As for seasonal changes, all seasons are likely to receive increased precipitation in the future with respect to the baseline values. Winters of the 2020s and 2050s show a definite increase in precipitation of about 225 mm under RCP8.5 and 250 mm under RCP4.5. But the increase in precipitation in the 2020s for summer under both scenarios is relatively small. The RCP4.5 projects a greater increase in winter precipitation compared to RCP8.5. Both scenarios show similar changes in annual precipitation for the first two periods. On reaching the 2080s, RCP8.5 still projects a continued precipitation rise, while in RCP4.5 the change is subsiding. Therefore, as per the projection, the future climate in the Bago River Basin is expected to be wetter than before under both scenarios as compared to the baseline period. Figure 11 shows differences among the minimum, median, and maximum values of projections under RCP4.5 and 8.5 scenarios. The increase in median value of RCP8.5 (160 mm) in the 2080s and 60 mm in the 2020s compared with RCP4.5 is observed. However, the same level of median value for RCP4.5 and RCP8.5 in the 2050s is observed. The precipitation changes under RCP4.5 are high in the 2020s and 2050s compared with those changes under RCP8.5 with the maximum amount in the 2080s.
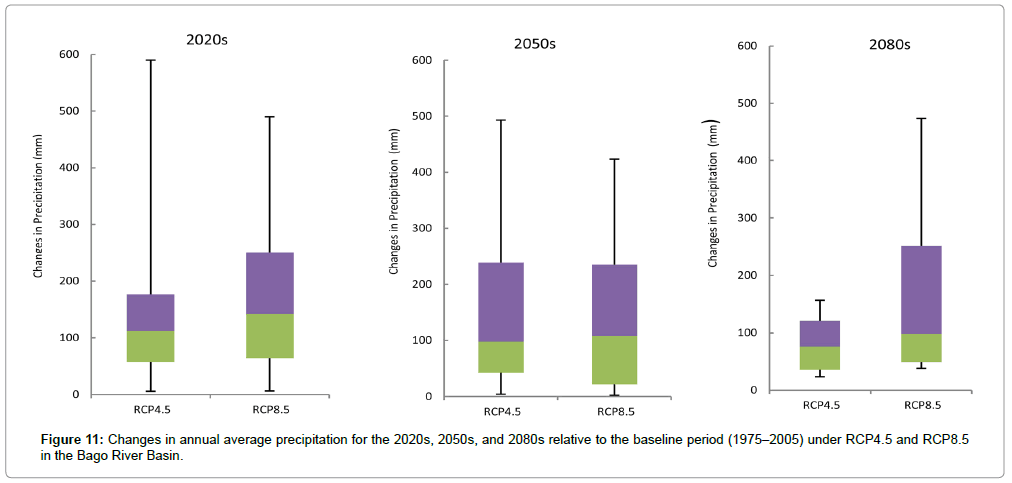
Figure 11: Changes in annual average precipitation for the 2020s, 2050s, and 2080s relative to the baseline period (1975–2005) under RCP4.5 and RCP8.5 in the Bago River Basin.
A similar study in the Jhelum River Basin of Pakistan also investigated the mean annual temperature and precipitation, which were found to be raised significantly in the entire basin under the two emission scenarios: seasonally and annually [8]. An additional study in the Koshi River Basin also showed that both seasonal and annual precipitation projected an increase in all three periods under both RCPs [9]. In the Songhuajiang River Basin, both seasonal and annual precipitation in all periods indicates various tendencies under both RCPs except for annual changes [10].
Conclusions
Climate change may have significant impacts on water resources management in Bago River Basin. Therefore this study forecasted the change in maximum, minimum temperature and precipitation for three future periods: an early-century period from 2010–2039 (2020s), a midcentury period from 2040–2069 (2050s) and a late-century period from 2080–2099 (2080s) under two Regional Concentration Pathways (RCP) 4.5 and RCP 8.5. The outputs of six General Circulation Models (GCMs) were bias corrected using delta change method to construct the future climate scenarios at basin level. It was found that the performances of GCMS were increased after bias correction.
The mean annual Tmax and Tmin in basin are projected to increase in Bago River Basin under both scenarios in all three future periods. The rise in maximum and minimum temperature projected by RCP8.5 is higher than those projected by RCP4.5. The highest upturn of mean annual temperature (Tmax and Tmin) is projected for the winter season under RCP4.5 and for the rainy season under RCP8.5. The highest increase in temperature is projected in 2080s. The increase in the temperature will influence the runoff and water availability in the basin.
The mean annual precipitation in basin is projected to increase by 90 mm under RCP4.5 and 115 mm under RCP8.5. The winter season is expected to receive higher increase in precipitation: 175 mm under RCP4.5 and 210 mm under RCP8.5 scenarios. The wettest month keeps shifting over the three periods and is in contrast from the baseline months of observed data. The July, August, and September are projected to be the wettest months and the 2050s the wettest period as per the projections [15,16].
The findings of this study will be useful for improved water resources management in Bago River Basin. Policy makers and relevant stakeholders such as farmers can formulate and implement proper structural and non-structural adaptation options to offset the negative impact of climate change on water availability, water balance, and extreme events such as floods and droughts in the basin.
Acknowledgements
The authors acknowledge the financial support provided by a Norwegian Scholarship and by the Asian Institute of Technology, Thailand, to conduct this research. The authors would also like to thank the Department of Hydrology and Meteorology, Myanmar, for providing important and valuable data for the research.
References
- IPCC (2007) Climate change 2007: the physical science basis. Contribution of Working Group I to the Fourth Assessment Report of the Intergovernmental Panel on Climate Change. Cambridge University Press, Cambridge, UK.
- Zhang Y, Sun S, Seth C, Manvendra K, He J (2011) CCSM3 simulated regional effects of anthropogenic aerosols for two contrasting scenarios: rising Asian emissions and global reduction of aerosols. Int J Climatol 31: 95-114.
- Hlaing K, Haruyama S, Aye M (2008) Using GIS-based Distributed Soil Loss Modeling and Morphometric Analysis to Prioritize Watershed for Soil Conservation in Bago River Basin of Lower Myanmar. Front Earth Sci China 2: 465-478.
- ITC (2011) Report for mitigation of Bago Flood, Ministry of Agriculture and Irrigation. Republic of Union of Myanmar.
- IPCC (2001) Third Assessment Report, Working Group-I Report. Cambridge University Press, Cambridge, UK.
- Bates BC, Kundzewicz ZW, Wu S, Palutikof JP (2008) Climate Change and Water. Technical Paper of the Intergovernmental Panel on Climate Change. IPCC Secretariat, Geneva.
- Piani C, Weedon G, Best M, Gomes S, Viterbo P, et al. (2010) Statistical bias correction of global simulated daily precipitation and temperature for the application of hydrological models. J Hydrol 395: 199–215.
- Mahmood R, Babel MS (2013) Evaluation of SDSM developed by annual and monthly sub-models for downscaling temperature and precipitation in the Jhelum basin, Pakistan and India. TheorApplClimatol113: 27-44.
- Agarwal A, Babel MS, Maskey S (2014) Analysis of future precipitation in the Koshi River Basin, Nepal. J Hydrol 513: 422-434.
- Su B, Zeng X, Zhai J, Wang Y, Li X (2014) Projected precipitation and stream flow under SRES and RCP emission scenarios in the Songhuajiang River Basin, China. J Quaternary Int 18.
- Cherkauer KA, Sinha T (2010) Hydrologic impacts of projected future climate change in the Lake Michigan region. J Great Lakes Research 36: 33-50.
- Coats R, Dettinger M, Riverson J, Reuter J, Sahoo G, et al. (2013) Projected 21st century trends in hydro climatology of the Tahoe Basin. J Quaternary International 310.
- Xiong LH, Yu KX, Zhang HG, Zhang LP (2013) Annual runoff change in the headstream of Yangtze River and its relation to precipitation and air temperature. Hydrol Res 44: 850.
- Feng S, Hu Q, Huang W, Ho C, Li R, et al. (2014) Projected climate regime shift under future global warming from multi-model, multi-scenario CMIP5 simulations. J Global and Planetary Change 112: 410-52.
- Reyers M, Pinto JG, Paeth H (2013) Statistical-dynamical downscaling of present day and future precipitation regimes in the Aksu river catchment in Central Asia. Global Planet Change 107: 36-49.
- Kawasaki A, Sutat W, Jourdain D (2012) Investigating Socio-economic Impacts of Flood on the People Affected by Poverty, A case study in Bago, Myanmar. Master Thesis, Asian Institute of Technology.
Citation: Htut AY, Shrestha S, Nitivattananon V, Kawasaki A (2014) Forecasting Climate Change Scenarios in the Bago River Basin, Myanmar. J Earth Sci Clim Change 5: 228. DOI: 10.4172/2157-7617.1000228
Copyright: ©2014 Htut AY, et al. This is an open-access article distributed under the terms of the Creative Commons Attribution License, which permits unrestricted use, distribution, and reproduction in any medium, provided the original author and source are credited.
Select your language of interest to view the total content in your interested language
Share This Article
Recommended Journals
Open Access Journals
Article Tools
Article Usage
- Total views: 17431
- [From(publication date): 11-2014 - Aug 30, 2025]
- Breakdown by view type
- HTML page views: 12629
- PDF downloads: 4802