Genotypic Response to Salt Stress:I-Relative Tolerance of Certain Wheat Cultivars to Salinity
Received: 27-May-2015 / Accepted Date: 22-Sep-2015 / Published Date: 28-Sep-2015 DOI: 10.4172/2329-8863.1000192
Abstract
Forty two wheat (Triticum aestivum L) cultivars screened for their relative salt resistance raising seedlings in half-Hoagland solution (control) salinized with NaCl and maintained at 4, 8, 12 and 16 dsm-1 showed a wide range of salt resistance. The growth response to salinity, judged by the shoot and root lengths, ranged from a stimulation in the case of some cultivars at lower salinity levels (4 and 8 EC) to a severe suppression in most of the cultivars at higher levels (12 and 16 EC). It was further observed that the shoot growth was often suppressed more than the root growth with this a level of 12 EC also found to be critical for most of the cultivars except HD–2160 which showed good stand even at a salinity level of 16 EC. Based on these observations, cultivar IWP–72 of the 42 cultivars tested was found to have the maximum sensitivity to salt stress whereas cultivar HD–2160 showed highest salt tolerance. The remaining 40 cultivars fell between the two extremes and were categorized into sal–sensitive, moderately salt – tolerant and salt – tolerant groups exhibiting more than 60%, 40 – 60% and less than 40% reduction respectively in shoot length at 12 EC dsm-1 over control.
Keywords: Wheat (Triticum aestivum L); Salt stress; Critical level; Salt–tolerant; Moderately salt–tolerant; Salt–sensitive genotypes
404175Introduction
The complexion of salt tolerance and the multitude of ways in which plants adapt to it have caused much confusion. Sodium (Na+) and chloride (Cl-) are among the most common ions found in excess in saline soils, and some plant species are especially sensitive to one or both of these ions [1-8]. A general suppression of growth is probably the most common plant response to salinity [9]. Crop plants differ greatly in their tolerance to salinity. Differences between species and varieties in regard to salt tolerance have been reported by several workers Bernstein, Hayward, Shannon, Ogra, Sharma , Baijal, Nauhbar, Yadav, Rani , Gautam and Parashar [1-4,6-8,10-20]. In saline soils [2,4,8,21-24] the control of water, the proper techniques of planting and the choice of tolerant crops are essential for their successful use in crop production. The choice of crops is based on: (1) the tolerance to salt; (2) adaptability to climatic or soil characteristics and (3) value of the crop in the individual farm activity. The chances of a crop failure are less if an adequately salt tolerant crop or its variety is selected. The key to improving salt tolerance in plants and studying its inheritance lies in finding sufficient variation within breeding populations and devising a screening procedure capable of identifying resistant or tolerant genotypes.
Further, as the period of seed germination and early seedling stage is the most crucial and important stage in the life cycle of species growing in saline environment [25] the present investigation was, therefore, undertaken to analyze the relative salt tolerance in wheat (Triticum aestivum L) at the early seedling stage and to select varieties that could withstand varying concentrations of the salts in their environment.
Materials and Methods
Forty two wheat cultivars (Triticum aestivum L) were procured from Wheat Directorate, Cummings Laboratory, Division of Genetics and Plant Breeding, Indian Agricultural Research Institute, New Delhi and Chandra Sekhar Azad University of Agriculture and Technology, Kanpur (UP), India. Screening of wheat cultivars for salt resistance was made by Garrad’s Technique (1945) as modified by Sarin and Rao [26] and Sharma [2] and as per method of Sheoran and Garg [11] wherein shoot and root lengths of seedlings were recorded at definite intervals. Here test tubes of uniform size (30 ml capacity) were fitted with rolls of filter paper folded at the top into a cone to support the seeds. The tubes were filled to one-third part with the test solutions so that the solution might not come in direct contact with the growing roots, the salt solution being supplied to the roots through capillary action of the filter paper. Distilled water (represented the mean loss of water from the blanks) was added to each test tube after every 24 hr of interval in order to maintain salt concentration near the target levels throughout the germination period. The seeds were initially sterilized with 0.1% mercuric chloride (HgCl2) solution and later washed thoroughly with distilled water. Three seeds per tube were then transferred to the edge of the filter paper cone and were allowed to grow between the filter paper roll and the wall of the test tube in dark growth chamber at 25 ± 2ºC. Fifteen replicates (five tubes each having three seeds) were maintained for each treatment including the controls (half-strength Hoagland solution grown). Observations on the influence of salinity levels at 4, 8, 12 and 16 EC dsm-1 of salt solution and the controls on the total length of coleoptile and root at early seedling stage were recorded at 24 hour intervals from 48 hr after sowing up to the end of 120 hr under green safe light. The relative tolerance of different cultivars was evaluated on the basis of the percentage reduction in shoot growth at 12 EC.
All parameters were analyzed by ‘Analysis of Variance’ (ANOVA) method as given by Panse and Sukhatme [27] wherein Critical Differences (CD at 1 and 5% probability were calculated wherever the results were significant.
Results And Discussion
The observations summarized here clearly demonstrate that exposure to salinity during early seedling stage resulted in stunting of growth of the shoot and root at higher salinity levels. This reduction in shoot and root growth is one of the most commonly observed responses to salinity [2-4,6-8,12-20,28,29].
In agreement with Richards [30] it is observed that the changes induced by addition of NaCl to the growth medium became more distinct with increasing salinity and with prolongation of the period of exposure to salinity. This is perhaps due to a higher intake of ions [2,13,16-18,22] which resulted in toxicity [31-33]. Osmotic effects might also have contributed to the low growth rates under saline conditions [34].
Seed lots of 42 wheat cultivars screened for salinity tolerance at the early seedling stage for shoot and root lengths under varying salinity levels (0,4,8,12 and 16 dsm-1) induced by NaCl as indicated (Table 1), all the main effects viz., variety, treatment and seedling age and their interactions (V × D, V × T, D × T and V × D × T) were highly significant at 0.01 probability with significant differences noticed in the shoot and root growth of all the cultivars studied (Figure 1). The highest mean shoot growth (3.091 cm) was recorded in the cultivar Kharchia followed by HD-2009, Sonalika, Sharbati sonora, WL-410, HD-2236, UP-262, HS-43, IWP-503, HP-1303, HD-2177, HD-2135, WH-246, K-7634, HD-2260, Raj-1556, UP-115, WL-711, Moti, HD-2282, WL- 2200, Raj-1482, HD-1980, IWP-72, CC-464, HD-2275, Raj-1409, HD-2160, HD-1593, Raj-1494, HD-2252, WL-908, HD-2267, UP- 171, Raj-1493, HD-1977, HD-2204, K-7631, WL-1531, WG-1559, UP-154 and lastly WG-1558 with the lowest shoot length of 0.282 cm (Table 2). Similarly, significant differences were also noticed in the root growth of the cultivars studied. The maximum root length (5.974 cm) was observed in the cultivar Kharchia followed by HD-2009, IWP- 503, Sonalika, Sharbati sonora, HS-43, WL-410, CC-464, UP-262, HD-2135, HD-2177, Raj-1556, UP-115, HP-1303, WL-2200, Moti, HD-2275, HD-2160, HD-2252, WL-711, WH-246, HD-1980, IWP- 72, Raj-1494, Raj-1482, K-7634, HD-2260, HD-1593, Raj-1409, UP- 171, WL-903, HD-2282, Raj-1493, HD-2236, HD-1977, HD-2267, K-7631, HD-2204, WL-1531, UP-154, WG-1558, and minimum (0.658 cm) was observed in WG-1559 (Table 2).
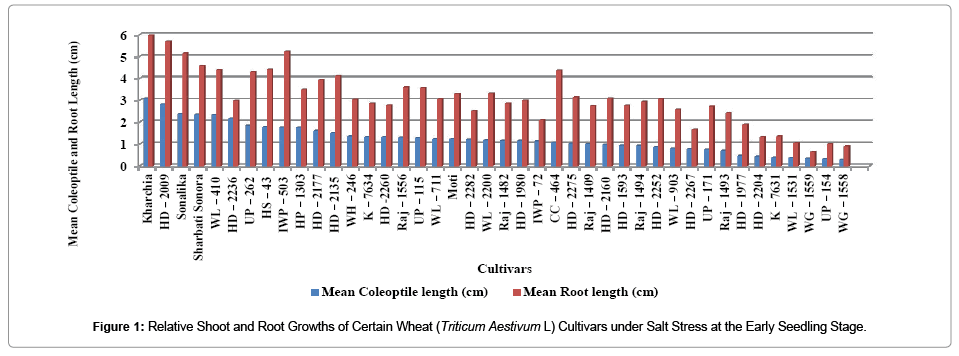
Figure 1: Relative Shoot and Root Growths of Certain Wheat (Triticum Aestivum L) Cultivars under Salt Stress at the Early Seedling Stage.
| Source of Variation | DF | Characters (MSS) | |
|---|---|---|---|
| Shoot Length | Root Length | ||
| Replication (R) | 4 | 0.486375** | 0.061000 |
| Varieties (V) | 41 | 45.705478** | 161.962530** |
| Duration (D) | 3 | 1477.620900** | 5062.824300** |
| Treatment (T) | 4 | 298.855950** | 884.461750** |
| V X D | 123 | 10.662409** | 12.680032** |
| V X T | 164 | 3.96484** | 7.322207** |
| D X T | 12 | 70.434100** | 87.099666* |
| V X D X T | 492 | 0.989345** | 0.970510** |
| Error | 3356 | 0.053137** | 0.319951** |
Shoot Length: G.M. = 1.259 S.Em. ± 0.231 C.V. = 18.310 ** P = 0.01
Root Length: G.M. = 3.093 S.Em. ± 0.566 C.V. = 18.289 ** P = 0.01
Table 1: ANOVA Table (Shoot and Root Growth in 42 Wheat Cultivars).
| S No |
Cultivar | Shoot Growth (cm) | Root Growth (cm) | ||||||||||
|---|---|---|---|---|---|---|---|---|---|---|---|---|---|
| Cont | 4EC | 8EC | 12EC | 16EC | Mean | Cont | 4EC | 8EC | 12EC | 16EC | Mean | ||
| 1 | HD-2236 | 3.768 | 4.279 | 2.142 | 0.433 | 0.211 | 2.167 | 4.502 | 5.004 | 3.783 | 1.017 | 0.581 | 2.977 |
| 2 | WL-410 | 3.326 | 3.767 | 2.488 | 1.455 | 0.623 | 2.332 | 5.122 | 5.856 | 4.736 | 3.849 | 2.417 | 4.396 |
| 3 | Sharbatisonora | 3.263 | 2.956 | 2.639 | 1.585 | 1.315 | 2.352 | 5.271 | 5.190 | 5.017 | 4.221 | 3.158 | 4.571 |
| 4 | Moti | 2.171 | 2.063 | 1.441 | 0.248 | 0.217 | 1.228 | 5.075 | 4.463 | 3.591 | 1.886 | 1.501 | 3.303 |
| 5 | Sonalika | 3.406 | 2.947 | 2.409 | 1.641 | 1.472 | 2.375 | 5.945 | 5.661 | 5.319 | 4.813 | 3.965 | 5.140 |
| 6 | HD-2160 | 1.069 | 1.017 | 0.974 | 0.911 | 0.883 | 0.970 | 3.627 | 3.432 | 3.038 | 2.814 | 2.582 | 3.098 |
| 7 | HD-2135 | 2.790 | 2.052 | 1.452 | 0.992 | 0.276 | 1.512 | 6.451 | 5.287 | 4.232 | 2.783 | 1.843 | 4.119 |
| 8 | IWP-503 | 3.135 | 2.527 | 1.869 | 0.921 | 0.437 | 1.778 | 7.118 | 6.626 | 5.745 | 4.340 | 2.266 | 5.219 |
| 9 | HS-43 | 2.710 | 2.509 | 1.557 | 1.191 | 0.793 | 1.792 | 6.012 | 5.568 | 4.517 | 3.555 | 2.454 | 4.421 |
| 10 | UP-262 | 3.374 | 2.647 | 2.003 | 0.977 | 0.275 | 1.855 | 6.630 | 5.683 | 4.429 | 2.969 | 1.735 | 4.289 |
| 11 | HD-2177 | 2.948 | 2.329 | 1.719 | 0.841 | 0.198 | 1.607 | 5.019 | 5.482 | 4.488 | 2.790 | 1.853 | 3.926 |
| 12 | WG-1559 | 0.748 | 0.623 | 0.193 | 0.153 | 0.070 | 0.357 | 1.442 | 1.211 | 0.293 | 0.227 | 0.095 | 0.653 |
| 13 | HD-2267 | 1.516 | 1.358 | 0.745 | 0.180 | 0.125 | 0.785 | 3.658 | 2.891 | 1.039 | 0.619 | 0.105 | 1.662 |
| 14 | IWP-72 | 2.430 | 2.015 | 0.950 | 0.190 | 0.125 | 1.142 | 4.119 | 3.496 | 2.006 | 0.607 | 0.240 | 2.093 |
| 15 | HD-2282 | 1.613 | 1.543 | 1.445 | 0.927 | 0.568 | 1.219 | 3.046 | 2.902 | 2.844 | 2.007 | 1.719 | 2.503 |
| 16 | WL-711 | 1.537 | 1.429 | 1.373 | 1.098 | 0.709 | 1.229 | 3.678 | 3.586 | 3.259 | 2.756 | 1.999 | 3.055 |
| 17 | Raj-1482 | 1.711 | 1.654 | 1.229 | 0.660 | 0.554 | 1.161 | 3.909 | 3.762 | 3.072 | 1.893 | 1.729 | 2.873 |
| 18 | HD-2260 | 1.935 | 1.491 | 1.406 | 1.360 | 0.443 | 1.327 | 3.470 | 3.213 | 3.096 | 2.692 | 1.395 | 2.773 |
| 19 | WH-246 | 2.069 | 1.909 | 1.227 | 0.903 | 0.702 | 1.362 | 3.811 | 4.353 | 2.964 | 2.152 | 1.904 | 3.036 |
| 20 | WL-2200 | 1.644 | 1.028 | 1.850 | 0.767 | 0.580 | 1.174 | 3.934 | 3.342 | 4.148 | 2.796 | 2.370 | 3.318 |
| 21 | K-7634 | 1.583 | 1.533 | 1.465 | 1.272 | 0.826 | 1.336 | 3.449 | 2.941 | 3.132 | 2.776 | 2.046 | 2.869 |
| 22 | Raj-1556 | 1.895 | 1.542 | 1.267 | 1.002 | 0.835 | 1.308 | 4.855 | 3.957 | 3.618 | 2.901 | 2.704 | 3.607 |
| 23 | UP-154 | 0.420 | 0.381 | 0.319 | 0.255 | 0.208 | 0.316 | 1.196 | 1.092 | 1.034 | 0.898 | 0.821 | 1.008 |
| 24 | HD-1977 | 0.744 | 0.620 | 0.409 | 0.320 | 0.301 | 0.479 | 2.842 | 2.506 | 1.556 | 1.366 | 1.178 | 1.889 |
| 25 | WG-1558 | 0.409 | 0.388 | 0.292 | 0.177 | 0.144 | 0.282 | 0.988 | 1.290 | 1.191 | 0.645 | 0.428 | 0.908 |
| 26 | HD-2204 | 0.681 | 0.447 | 0.524 | 0.292 | 0.238 | 0.436 | 1.716 | 1.332 | 1.573 | 1.068 | 0.954 | 1.328 |
| 27 | WL-1531 | 0.490 | 0.445 | 0.412 | 0.348 | 0.162 | 0.371 | 1.384 | 1.265 | 1.105 | 0.926 | 0.566 | 1.049 |
| 28 | K-7631 | 0.560 | 0.410 | 0.385 | 0.315 | 0.265 | 0.387 | 1.834 | 1.411 | 1.338 | 1.164 | 1.080 | 1.365 |
| 29 | Raj-1409 | 1.824 | 1.263 | 0.849 | 0.711 | 0.323 | 1.006 | 4.377 | 3.571 | 2.583 | 1.952 | 1.223 | 2.741 |
| 30 | Raj-1493 | 1.104 | 0.839 | 0.716 | 0.561 | 0.295 | 0.703 | 3.599 | 2.636 | 2.415 | 2.189 | 1.335 | 2.427 |
| 31 | Raj-1494 | 2.095 | 0.925 | 0.825 | 0.594 | 0.235 | 0.935 | 5.685 | 3.311 | 2.393 | 2.013 | 1.265 | 2.933 |
| 32 | WL-903 | 1.172 | 0.883 | 0.797 | 0.700 | 0.455 | 0.801 | 3.187 | 2.969 | 2.711 | 2.222 | 1.825 | 2.583 |
| 33 | UP-171 | 1.355 | 1.116 | 0.814 | 0.233 | 0.198 | 0.743 | 4.435 | 3.592 | 2.643 | 1.693 | 1.245 | 2.722 |
| 34 | HD-2275 | 1.760 | 1.463 | 1.127 | 0.453 | 0.305 | 1.021 | 4.840 | 3.869 | 3.138 | 2.085 | 1.828 | 3.152 |
| 35 | HD-1593 | 2.148 | 0.665 | 0.986 | 0.596 | 0.321 | 0.943 | 5.365 | 2.390 | 3.030 | 1.870 | 1.098 | 2.750 |
| 36 | HD-2252 | 1.139 | 1.216 | 0.858 | 0.749 | 0.403 | 0.873 | 3.830 | 4.189 | 2.935 | 2.736 | 1.637 | 3.065 |
| 37 | HP-1303 | 2.640 | 2.275 | 1.504 | 1.430 | 1.032 | 1.776 | 4.886 | 3.869 | 3.366 | 3.288 | 2.054 | 3.493 |
| 38 | UP-115 | 1.775 | 1.523 | 1.289 | 1.181 | 0.713 | 1.296 | 4.808 | 4.312 | 3.934 | 2.803 | 2.050 | 3.581 |
| 39 | HD-1980 | 1.634 | 1.536 | 0.987 | 0.889 | 0.725 | 1.154 | 4.335 | 4.048 | 2.534 | 2.295 | 1.760 | 2.994 |
| 40 | CC-464 | 1.931 | 1.103 | 0.985 | 0.905 | 0.465 | 1.078 | 6.199 | 4.515 | 4.293 | 3.835 | 2.968 | 4.362 |
| 41 | HD-2009 | 4.077 | 3.627 | 2.583 | 2.337 | 1.514 | 2.824 | 7.755 | 6.441 | 5.383 | 4.891 | 3.909 | 5.675 |
| 42 | Kharchia | 5.291 | 3.661 | 2.610 | 2.277 | 1.616 | 3.091 | 7.838 | 7.070 | 5.522 | 5.110 | 4.332 | 5.974 |
| Means | 1.997 | 1.666 | 1.267 | 0.834 | 0.527 | 1.259 | 4.315 | 3.799 | 3.167 | 2.416 | 1.767 | 3.092 | |
| CD at 5% P = 0.064S.Em. ± 0.023 | CD at 5% P = 0.351S.Em. ± 0.126 | ||||||||||||
Table 2: Shoot and Root Growth of Forty two Wheat Cultivars at Different Salinity Levels.
As indicated in the Table 3 only 11 cultivars showed less than 60% reduction in shoot growth while majority of the 31 cultivars had more than 60% reduction at 16 EC. This is in contrast with root growth (Table 3) where almost a reverse trend was noticed, i.e, out of the 42 cultivars only 15 showed more than 60% reduction at 16 EC whereas 27 had less than 60% reduction. This clearly showed that the shoot is more sensitive to salinity than the root growth. This differential response of shoot and root growth is shown in Table 4 and Figure 2 where the mean shoot growth was found to be more adversely affected than the root growth. Thus, it was interesting to find that not all plant parts were equally affected. In spite of the fact that the roots were directly exposed to the saline environment it seemed significant that shoot growth was affected more adversely than the root growth. With this also 12 EC was found to be a critical level for most of the cultivars. Thus, shoot growth seemed to be better criterion for relative salt tolerance of the cultivars of the same species at early seedling stage. Based on these observations all the 42 wheat (Triticum aestivum L) cultivars were categorized into three groups viz., salt–tolerant, moderately salt–tolerant and salt– sensitive, showing <40%, 40–60% and >60% reduction in shoot growth at 12 EC over respective controls (Table 3). Further, the different rates of shoot growth of the three groups (Figure 4) as affected by increasing level of salinity showed a gradual decline in both the salt–tolerant and moderately salt–tolerant cultivars. On the other hand, the salt– sensitive cultivars had a sharp decline in growth with increasing salt concentrations.
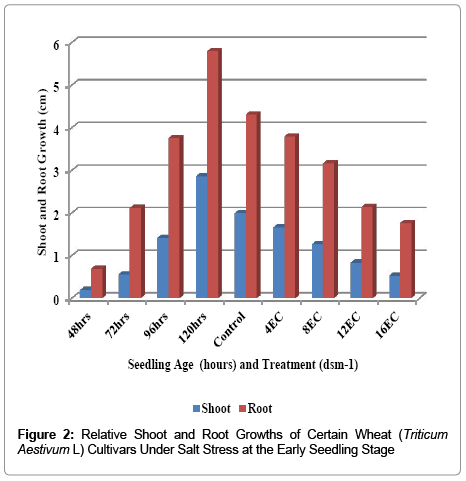
Figure 2: Relative Shoot and Root Growths of Certain Wheat (Triticum Aestivum L) Cultivars Under Salt Stress at the Early Seedling Stage
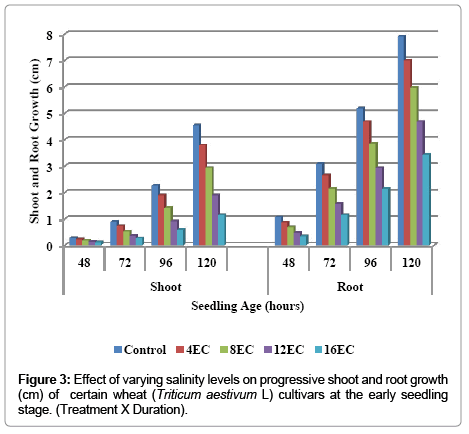
Figure 3: Effect of varying salinity levels on progressive shoot and root growth (cm) of certain wheat (Triticum aestivum L) cultivars at the early seedling stage. (Treatment X Duration).
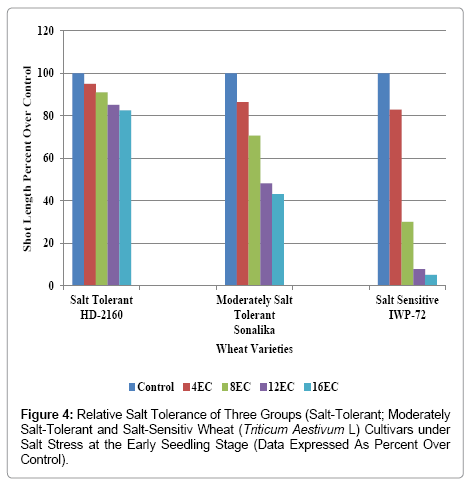
Figure 4: Relative Salt Tolerance of Three Groups (Salt-Tolerant; Moderately Salt-Tolerant and Salt-Sensitiv Wheat (Triticum aestivum L) Cultivars under Salt Stress at the Early Seedling Stage (Data Expressed As Percent Over Control).
| S.No. | Cultivar | Shoot Growth | Root Growth | ||||||
|---|---|---|---|---|---|---|---|---|---|
| 4EC | 8EC | 12EC | 16EC | 4EC | 8EC | 12EC | 16EC | ||
| 1 | HD-2236 | 113.561* | 56.847 | 11.491 | 05.599 | 111.150* | 84.029 | 22.589 | 12.905 |
| 2 | WL-410 | 113.259* | 74.804 | 43.746 | 18.731 | 114.330* | 92.463 | 75.146 | 47.188 |
| 3 | Sharbatisonora | 90.591 | 80.876 | 48.574 | 40.300 | 98.463 | 95.181 | 80.079 | 59.912 |
| 4 | Moti | 95.025 | 66.374 | 11.423 | 09.995 | 87.940 | 70.758 | 37.162 | 29.576 |
| 5 | Sonalika | 86.523 | 70.728 | 48.179 | 43.217 | 95.222 | 89.470 | 80.958 | 66.694 |
| 6 | HD-2160 | 95.135 | 91.113 | 85.219 | 82.600 | 94.623 | 83.760 | 77.584 | 71.188 |
| 7 | HD-2135 | 73.548 | 52.043 | 35.555 | 09.892 | 81.956 | 65.602 | 43.140 | 28.569 |
| 8 | IWP-503 | 80.606 | 59.617 | 29.346 | 13.939 | 93.087 | 80.710 | 60.972 | 31.834 |
| 9 | HS-43 | 92.583 | 64.833 | 43.948 | 29.261 | 92.614 | 75.133 | 59.131 | 40.818 |
| 10 | UP-262 | 78.452 | 59.844 | 28.956 | 08.150 | 85.716 | 66.802 | 44.781 | 26.168 |
| 11 | HD-2177 | 79.002 | 58.310 | 28.527 | 06.716 | 109.224* | 89.420 | 55.588 | 36.919 |
| 12 | WG-1559 | 83.288 | 25.802 | 20.454 | 09.358 | 83.980 | 20.319 | 15.742 | 6.588 |
| 13 | HD-2267 | 89.577 | 49.142 | 11.873 | 08.245 | 79.032 | 28.403 | 16.921 | 02.870 |
| 14 | IWP-72 | 82.921 | 39.094 | 7.818 | 05.144 | 84.874 | 48.701 | 14.736 | 05.826 |
| 15 | HD-2282 | 95.600 | 89.584 | 57.470 | 35.213 | 95.272 | 93.368 | 65.889 | 56.434 |
| 16 | WL-711 | 92.973 | 89.329 | 71.437 | 46.128 | 97.498 | 88.607 | 74.932 | 54.350 |
| 17 | Raj-1482 | 96.668 | 71.829 | 38.573 | 32.378 | 96.239 | 78.587 | 48.426 | 44.231 |
| 18 | HD-2260 | 77.059 | 72.661 | 70.284 | 22.894 | 92.593 | 89.221 | 77.579 | 40.201 |
| 19 | WH-246 | 92.266 | 59.304 | 43.644 | 33.929 | 114.221* | 77.774 | 56.468 | 49.960 |
| 20 | WL-2200 | 62.530 | 112.530 | 46.654 | 35.279 | 84.951 | 105.439* | 71.072 | 60.244 |
| 21 | K-7634 | 96.841 | 92.545 | 80.353 | 52.179 | 85.271 | 90.808 | 80.487 | 59.321 |
| 22 | Raj-1556 | 81.372 | 66.860 | 52.875 | 44.063 | 81.503 | 74.521 | 59.752 | 55.695 |
| 23 | UP-154 | 90.714 | 75.952 | 60.714 | 49.523 | 91.303 | 86.454 | 75.083 | 68.645 |
| 24 | HD-1977 | 83.333 | 54.973 | 43.010 | 40.456 | 88.177 | 54.750 | 48.064 | 41.449 |
| 25 | WG-1558 | 94.865 | 71.393 | 43.276 | 35.207 | 130.566* | 120.546* | 65.282 | 43.319 |
| 26 | HD-2204 | 65.638 | 76.945 | 42.878 | 34.948 | 77.622 | 91.666 | 62.237 | 55.594 |
| 27 | WL-1531 | 90.816 | 84.081 | 71.020 | 33.061 | 91.401 | 79.841 | 66.907 | 40.895 |
| 28 | K-7631 | 73.214 | 68.750 | 56.250 | 47.321 | 76.935 | 72.955 | 63.467 | 58.887 |
| 29 | Raj-1409 | 69.243 | 46.546 | 38.980 | 17.708 | 81.585 | 59.013 | 44.596 | 27.941 |
| 30 | Raj-1493 | 75.996 | 64.855 | 50.815 | 26.721 | 73.242 | 67.101 | 60.822 | 37.093 |
| 31 | Raj-1494 | 44.152 | 39.379 | 28.353 | 11.217 | 58.240 | 42.093 | 35.408 | 22.251 |
| 32 | WL-903 | 75.341 | 68.003 | 59.726 | 38.822 | 93.159 | 85.064 | 69.720 | 57.263 |
| 33 | UP-171 | 82.361 | 60.073 | 17.195 | 14.612 | 80.992 | 59.594 | 38.173 | 28.072 |
| 34 | HD-2275 | 83.125 | 64.034 | 25.738 | 17.329 | 79.938 | 64.834 | 43.078 | 37.768 |
| 35 | HD-1593 | 30.959 | 45.903 | 27.746 | 14.944 | 44.547 | 56.477 | 34.855 | 20.465 |
| 36 | HD-2252 | 106.760* | 75.329 | 65.759 | 35.381 | 109.373* | 76.631 | 71.436 | 42.741 |
| 37 | HP-1303 | 86.174 | 56.969 | 54.166 | 39.090 | 79.185 | 68.890 | 67.294 | 42.038 |
| 38 | UP-115 | 85.802 | 72.619 | 66.535 | 40.169 | 89.683 | 81.821 | 58.298 | 42.637 |
| 39 | HD-1980 | 94.002 | 60.403 | 54.406 | 44.369 | 93.379 | 58.454 | 52.941 | 40.599 |
| 40 | CC-464 | 57.120 | 51.009 | 46.866 | 24.080 | 72.834 | 69.253 | 61.864 | 47.878 |
| 41 | HD-2009 | 88.962 | 60.902 | 57.321 | 39.097 | 83.056 | 69.413 | 63.068 | 50.406 |
| 42 | Kharchia | 69.192 | 49.329 | 43.035 | 30.542 | 90.201 | 70.451 | 65.195 | 55.269 |
Table 3: Shoot and Root Growth of Forty two Wheat Cultivars at Different Salinity Levels (Data expressed as percent over control).
| Interaction Duration | Interaction Treatment | ||||||||
|---|---|---|---|---|---|---|---|---|---|
| Seedling Age (hours) | Salinity Level dsm-1 | ||||||||
| 48hrs | 72hrs | 96hrs | 120hrs | Control | 4EC | 8EC | 12EC | 16EC | |
| Shoot | 0.192 | 0.562 | 1.419 | 2.863 | 1.997 | 1.666 | 1.267 | 0.835 | 0.529 |
| CD at 5% P = 0.048SEm ± 0.017 | CD at 5% P = 0.022SEm ± 0.008 | ||||||||
| Root | 0.693 | 2.122 | 3.759 | 5.798 | 4.314 | 3.799 | 3.167 | 2.147 | 1.767 |
| CD at 5% P = 0.020SEm ± 0.007 | CD at 5% P = 0.054SEm ± 0.020 | ||||||||
Table 4: Relative Shoot and Root Growth (cm) of Certain Wheat Cultivars at Varying Salinity Levels (dsm-1).
A significant reduction in shoot and root growth with increasing salinity levels was observed irrespective of cultivars and seedling age (Table 4 and Figure 2). The reduction was more pronounced after 8 EC salinity level. It was observed that the cultivars showed the first sign of germination at 48 hr after sowing irrespective of salinity level and thereafter shoot growth increased significantly with seedling age till 120 hr (Table 4 and Figure 2). In the significant interaction of varieties with treatment the cultivars showed a decrease in shoot growth with salinity levels; however, the varietal variations were quite evident. All the cultivars except HD-2160, Sharbati sonora, Sonalika, WL-171, K-7634, Raj-1556, UP-154, HD-1977, K-7631, UP-115, and HD-1980 showed more than 60% reduction in shoot growth at 16 EC salinity level (Table 3). Like shoot growth, salinity in general, resulted in a reduction in root growth irrespective of cultivars and duration. This decline in root growth was significant at all EC levels. On the other hand, root growth increased significantly with the age of the seedling (Table 5 and Figure 3). Further, it was observed that the cultivars differed significantly in their response to increasing salinity levels and all other cultivars except HD-2160, UP-154, Sonalika, and WL-2200 showed less than 60% root growth at 16 EC level (Table 6).
| Seedling Age (hours) | Salinity Level dsm-1 | |||||
|---|---|---|---|---|---|---|
| Control | 4EC | 8EC | 12EC | 16EC | ||
| Shoot | 48 | 0.280 | 0.236 | 0.184 | 0.145 | 0.114 |
| 72 | 0.901 | 0.741 | 0.531 | 0.372 | 0.266 | |
| 96 | 2.263 | 1.905 | 1.417 | 0.922 | 0.588 | |
| 120 | 4.544 | 3.783 | 2.935 | 1.903 | 1.148 | |
| CD at 5% P = 0.044SEm ± 0.016 | ||||||
| Root | 48 | 1.065 | 0.868 | 0.697 | 0.486 | 0.347 |
| 72 | 3.083 | 2.653 | 2.152 | 1.571 | 1.148 | |
| 96 | 5.192 | 4.674 | 3.848 | 2.934 | 2.148 | |
| 120 | 7.915 | 7.002 | 5.972 | 4.675 | 3.425 | |
CD at 5% P = 0.039SEm ± 0.108
Table 5: Relative Shoot and Root Growth (cm) of Certain Wheat Cultivars at Varying Salinity Levels (dsm-1) (Treatment X Duration).
| Group I Salt-tolerant (Less than 40% reduction) |
Group II Moderately Salt-tolerant (40 – 60% reduction) |
Group III Salt-sensitive (More than 60% reduction) |
|
|---|---|---|---|
| CULTIVARS | HD-2160 K-7634 WL-711 WL-1531 HD-2260 UP-115 HD-2252 UP-154 |
WL-903 HD-2282 HD-2009 K-7631 HD-1980 HP-1303 Raj-1556 Raj-1493 Sharbati Sonora Sonalika CC-464 WL-2200 HS-43 WL-410 WH-246 WG-1558 Kharchia HD-1977 HD-2204 |
Raj-1409 Raj-1482 HD-2135 IWP-503 UP-262 HD-2177 Raj-1494 HD-1593 HD-2275 WG-1559 UP-171 HD-2267 HD-2236 Moti IWP-72 |
Table 6: Showing Relative Tolerance of Certain Cultivars of Wheat Based on the Percent Reduction in Coleoptile Growth at 12 EC (dsm-1) Salinity Level.
The relative comparisons of seedling growth between different wheat cultivars indicated better performance of HD–2160 at almost all levels of salinity when compared with controls. It showed highest tolerance to salinity (i.e., 82.60 percent shoot growth at 16 EC over control) and IWP–72 showing highest inhibition in shoot growth (i.e., only 5.14 percent growth at 16 EC over control). The next cultivars which were relatively lesser tolerant but close to HD–2160 were K–7634, WL–711, WL–1531, HD–2260, UP–115, HD–2252 and UP– 154. Based on these growth responses other cultivars of wheat followed a sequence of decrease as shown in Table 3 as far as their resistance to salt stress was concerned.
On the other hand, all the cultivars showed an increase in shoot growth with seedling age. It was evident that the different cultivars exhibited marked differences in their early seedling growth with increasing age of the seedling and that with advancement of seedling age the effect of salt declined and that, in general, tolerance to salinity increased. It was observed that root length increased with age of the seedlings in all the 42 cultivars studied irrespective of the salinity levels. This table also shows that the cultivars differed significantly in their relative root growth. Like shoot, it was observed in the present investigation that irrespective of the cultivars studied the seedlings exhibited increase in salt tolerance with the advancement of age (Tables 4 and 5, Figures 2 and 3).
A stimulation observed in growth of some cultivars as shown in Table 3 marked with asterisk (*) at moderate levels of salinity (4 and 8 dsm-1) confirmed similar observations of Eaton [35] Nieman [9] Ogra and Baijal [36] Sharma [2,7] Nauhbar [16], Yadav [17], Rani [18], Gautam [19] Parashar [20] in certain crop plants. Poljak off- Mayber and Gale [37] reported that Na+ and Cl- ions play important roles in the life of the plant within the range of suitable concentrations. The stimulation in growth might be attributed to the nutritional supplementation at low concentrations of the salt [2,4,13].
Thus, it is clear from the data that the cultivars differed in their ability to grow as seedlings under high salinity levels. That wheat showed fairly large varietal differences to salt stress had also been reported earlier by Bhardwaj [38] Sarin and Narayanan [39]. Varietal differences to salt stress were also reported in other agricultural crops by several workers Ayers [40] , Sarin [41], Bhumbla and Singh [42], Puntamkar et al .[43] Taylor [44] Epstein [45] Maas and Hoffman [46], Garrard A [47], Sheoran [48].
Conclusion
The observations recorded clearly indicated that the shoot is more sensitive to salt stress than the root and that shoot growth is a better index of relative salt tolerance of different cultivars of the same species at early seedling stage with this also 12 EC salinity level was found to be a critical level for majority of the cultivars. Thus, on the basis of the percent reduction in shoot growth at 12 EC salinity level over respective control all the cultivars were categorized into three groups viz., salt-tolerant, moderately salt-tolerant and salt-sensitive, showing less than 40%, 40–60% and more than 60% reduction respectively.
Acknowledgements
Author is indebted to Dr B D Baijal (Retd Professor Plant Physiology Department of Botany Agra College, Agra) for expert comments and to the Principal K R College, Mathura for providing necessary facilities.
References
- Bernstein L, Hayward HE(1958) Physiology of salt tolerance. Ann Rev Plant Physiol 9: 25-46.
- Sharma, Ravi (1982) Physiology of plant tolerance to salinity at early seedling stage. Ph D Thesis, Agra Univ., Agra.
- Sharma, Ravi,Baijal BD (1985a) genotypic response to salt stress I: Screening for salt-resistance – selection of salt-tolerant and salt-sensitive wheat varieties. National Seminar on Plant Physiology. Institute of Agricultural Sciences BHU Varanasi 12-23127:74-75.
- Sharma, Ravi (1987) towards an understanding of the physiology of salt tolerance in wheat (Triticumaestivum L) at early seedling stage; XIV International Bot Cong Berlin, W Germany, 19th July-1 Aug Sym 22: 32.
- Rani, Saroj (2007) Investigation on salt tolerance parameters specially growth and biochemical traits for selection of salt tolerant lines in legumes at the early seedling stage. PhD Thesis Dr B RAmbedkar Univ. formerly Agra University, Agra.
- Rani, Saroj, Sharma SK, Ravi Sharma (2009) Germination and early seedling growth in six leguminous crops under salt stress. Plant Archives 9:145 –151.
- Sharma, Ravi, Nidhi Parashar, Sharma SK, Singh DK, et al.(2011) Toxic effects of city and industrial effluents vis – a – vis effects of salinity and heavy metal stresses on certain crop plants. XXXIV All India Botanical Conference of The Indian Botanical Society, Oct., 10 – 12, 2011, Department of Botany University of Lucknow, Souvenir and Abstracts, Section VII Plant Physiology, Biochemistry and Pharmacology, O. VII. 29: 285.
- Sharma (2013) Screening for salt tolerance – Selection of salt tolerant and salt sensitive wheat cultivars; Third National Conference on Innovations in Indian Science, Engineering and Technology (Bilingual Hindi & English) Organized by Swadeshi Science Movement of India, Delhi at CSIR National Physical Laboratory and IARI, New Delhi, Feb. 25 – 27.
- Nieman RH (1962) some effects of NaCl on growth, phtosynthesis and respiration of twelve crop plants. Bot Gaz 123:279-285.
- Hayward HE, Bernstein L (1958) Plant growth relationships on salt-affected soils. Bot Rev 24:584-635.
- Shannon M C (1978) Testing salt tolerance variability among tall wheat grass populations. Agron J70:719-722.
- Ogra RK(1981) Physiological studies on salt tolerance in Sorghum.Ph D Thesis. Agra University, Agra.
- Sharma Ravi, Baijal BD (1984) Ion uptake and ATPase activity in certain wheat cultivars under salt stress conditions. VIII All India Bot Conference, Rajasthan University. J Ind Bot Soc Abst 63:97.
- Sharma, Ravi, Baijal BD (1984) Carbohydrate metabolism in salt tolerant and salt sensitive wheat cultivars under salt stress conditions. VII All India Botanical Conference, Rajasthan Univ. J Ind Bot Soc63: 93.
- Sharma, Ravi,Baijal BD (1985) Genotypic response to salt stress II: Differential physiological and biochemical response of salt-tolerant and salt-sensitive wheat cultivars; National Seminar on Plant Physiology, Institute of Agricultural Sciences, BHU Varanasi 12-23, Feb. 128:75-76.
- Nauhbar, Suman (2005) Relative Tolerance of Crop Plants to Salt Stress at the Early Seedling Stage, PhD Thesis, Dr B R Ambedkar Univ. formerly Agra University, Agra.
- Yadav, Neetu (2006) Physiology of Salt Tolerance for Effective Biological Control of Salinity, PhD Thesis, Dr B R Ambedkar Univ. formerly Agra University, Agra.
- Rani, Saroj, Sharma SK, Ravi Sharma (2007)Effect of salinity on germination and early seedling growth in six leguminous pulse crops. XXX Annual Conference Indian Botanical Society, Jiwaji University, Gwalior (MP) India, 28 – 30 Nov. Abst& Souvenir S7. 27: 156.
- Gautam, Aruna (2009) the Problem of Saline Wastelands and their Management – A Biological Approach with Special Reference to Mathura. PhD Thesis, Dr B R Ambedkar Univ. formerly Agra University, Agra.
- Parashar, Nidhi (2011) Planning and Investigation for City and Industrial Effluent Utilization in Abating Pollution of River Yamuna and Improving Agricultural Production.PhD Thesis, Dr B R Ambedkar Univ. formerly Agra University, Agra.
- Sharma, Ravi, Baijal BD,Goyal AK (1981a) Salinity – an increasing environmental hazard; First International Conference on Environmental Education, VigyanBhavan, New Delhi 16th – 20th Dec. Proc Indian Environmental Society115:116 – 117.
- Sharma, Ravi, Baijal BD (1987) The problem of saline wastelands and their management – a biological approach; National Seminar on Pollution, Conservation awareness and Wastelands development, K.R. College, Mathura 14 – 15 Feb.
- Babu, Dinesh, Singh DK, Sharma SK, Arti et al. (2011) The problem of saline wastelands and their management – a biological approach. XXXIV All India Botanical Conference of The Indian Botanical Society, Oct., 10 – 12, 2011, Department of Botany University of Lucknow, Lucknow, Souvenir and Abstracts, Section VII Plant Physiology, Biochemistry and Pharmacology 6: 274.
- Sharma (2012) Strategy for sustainable improvement of selected crops-production under saline conditions emphasizing biocontrol of salinity.National Conference on Emerging Trends in Biotechnology and Pharmaceutical Research Feb 18 – 19, Mangalayatan University, Aligarh, Souvenir and Abstract Book, Technical Session II, OP-013: 60.
- Ranganathan R, RajalakshmiAK (2006) the effect of NaCl and Na2SO4 salinity on germination behavior of Avicennia officinalis L. Plant Archives 6: 585 – 588.
- Sarin MN, Rao IM (1956) Effect of sodium sulphate on early seedling growth of gram and wheat. Agra Univ J Res Sci 5: 143–154.
- Panse VG,Sukhatme PV (1957) Statistical Methods for Agricultural Workers. ICAR (IARI), New Delhi.
- Ayers AD, Brown JW, Wadleigh CH (1952) Salt tolerance of barley and wheat in soil plots receiving several salinization regimes.Agron J 44: 307-310.
- Uprety DC (1970) Physiological studies on salt tolerance in two varieties of pea.Ph D Thesis, Agra Univ, Agra.
- Richards LA (1954) Diagnosis and Improvement of Saline and Alkali Soils. USDA, Agric Hand Book No 60.
- Ayers AD, Hayward HE (1948) A method for measuring the effects of soil salinity on germination with observations on several crop plants. AmerProc Soil Sci13: 224-226.
- Ota K, Yasue T (1957) Studies on the salt injury to crops, XI the differences on the salt resistance in the young wheat varieties. Gifu U FaculAgric Res Bull 8: 14.
- Wahhab A (1961) Salt tolerance of various varieties of agricultural crops at the germination stage, Salinity Problems in Arid Zone.Proc Tehran Symp UNESCO 185.
- Dumbroff EB, Cooper AW (1974) Effects of salt stress applied in balanced nutrient solutions at several stages during growth of tomato. Bot Gaz 135: 219 – 224.
- Eaton FM (1942) Toxicity and accumulation of chloride and sulphate salts in plants. J Agric Res 64: 357-399.
- Ogra RK, Baijal BD (1978) Relative tolerance of some sorghum varieties to salt stress at early seedling stage. Indian J AgricSci48: 713-717.
- Poljakoff-Mayber A, Gale J (1975) Plants in Saline Environments, Ecological studies. Springer-Verlag15: 213.
- Bhardwaj SN (1959) Influence of NaCl and Na2CO3 on some aspects of carbohydrate metabolism in wheat.Mem Indian bot soc 2: 75-78.
- Sarin MN, Narayanan A (1968) Effects of soil salinity and growth regulators on germination and seedling metabolism of wheat.Physiol Plant 21: 1201-1209.
- Ayers AD (1953) Germination and emergence of several varieties of barley in salinized soil cultures.Agron J 45:68-71.
- Sarin MN (1962) Physiological studies on salt tolerance of crop plants V. Use of IAA to overcome depressing effect of sodium sulphate on growth and maturity of wheat. Agra Univ J Res (Sci) 11: 187 – 196.
- Bhumbla DR, Singh NT (1965) Effect of salt on seed germination.Sci Cult31:96-97.
- Puntamkar SS, Mehta PC, Seth SP (1970) Note on the inducement of salt resistance in two wheat varieties by presoaking with different salts of varying concentrations. Indian J AgricSci 41: 717 – 718.
- Taylor RM, Young EF, Rivera RL (1975) Salt tolerance in cultivars of grain Sorghum. Crop Sci 15: 734-735.
- Epstein E (1976) Genetic adaptation of crops to salinity; Proceedings, Workshop on Salt Effects on Plant Structures and Processes. Riverside Calif: 51-53.
- Maas EV, Hoffman GJ (1977) Crop salt tolerance current assessment. J Irrig Drainage Div ASCE 103: 115-134.
- Garrard A (1945) the effect of b-indolyl acetic acid on the germination and root growth of certain members of cruciferae. New Phytol 53: 165 – 176.
- Sheoran IS, Garg OP (1978) Effect of salinity on the activities of RNase, DNase and protease during germination and early seedling growth of mung bean.Physiol Plant 44: 171 – 174.
Citation: Sharma R (2015) Genotypic Response to Salt Stress: I–Relative Tolerance of Certain Wheat Cultivars to Salinity. Adv Crop Sci Tech 3:192. DOI: 10.4172/2329-8863.1000192
Copyright: © 2015 Sharma R. This is an open-access article distributed under the terms of the Creative Commons Attribution License, which permits unrestricted use, distribution, and reproduction in any medium, provided the original author and source are credited.
Select your language of interest to view the total content in your interested language
Share This Article
Recommended Journals
Open Access Journals
Article Tools
Article Usage
- Total views: 15489
- [From(publication date): 11-2015 - Jun 14, 2025]
- Breakdown by view type
- HTML page views: 10773
- PDF downloads: 4716