Geophysical Investigation for Groundwater Potetial around Ladoke Akintola University of Technology Campus, Ogbomoso, Southwestern Nigeria
Received: 24-Jul-2018 / Accepted Date: 14-Aug-2018 / Published Date: 20-Aug-2018 DOI: 10.4172/2157-7617.1000485
Keywords: Geophysical; Vertical Electrical Sounding (VES); Magnetic intensity; Basement depression; Groundwater potential; Ogbomoso
Introduction
Groundwater is a valued freshwater resource which constitutes about two-third of the fresh water reserves of the world [1]. Since its abstraction for domestic, agricultural and industrial usage has increased, the need for groundwater exploration, particularly in the basement complex terrain where the aquifer systems are localized, has also become inevitable. Acute shortage of potable water delivery on Ladoke Akintola University of Technology Campus, Ogbomosho, Southwestern Nigeria has been a perennial problem from its inception in 1990. The shortfall in water demand has been partly met via groundwater development through few surviving hands dug wells and boreholes and through purchase of water from public vendors due to lack of government water supply to the university community. Therefore, there is the need to assess the geologic structural disposition favorable to groundwater accumulation on the campus.
The use of ground magnetic and electrical resistivity data for structural disposition, groundwater resource mapping and water quality evaluations has increased dramatically over recent decades in much of the world due to the rapid advances in microprocessors and associated numerical modeling solutions [2]. The magnetic and the vertical electrical resistivity (VES) have proved very popular with groundwater studies due to simplicity of the techniques. The techniques are applied in groundwater investigation for the delineation of the aquifer configuration (e.g. [3-12]. Magnetic survey is quick in the investigation of the subsurface geology on the basis of anomalies in the earth’s magnetic field resulting from the magnetic properties of the underlying rocks while a well-designed geoelectrical investigation is also capable of determining thickness of aquifers, locate fissured or fractured basement column and qualitatively estimate local groundwater flow pattern [13-17].
Ladoke Akintola University of Technology (LAUTECH) Campus (the study area) located in Ogbomosho, Southwestern Nigeria, lies within Latitudes 4° 15′ and 4° 16′ and Longitudes 8° 9′ and 8° 10′ (Figure 1). As the population of the students and staff increases, there is the need for the expansion of existing infrastructures such as buildings and water supply. This has necessitated groundwater exploration within the university community.
The study integrated the magnetic intensity with vertical electrical sounding data to delineate the structural disposition and geoelectric layers parameters of the subsurface in the study area as a means of identifying the type and nature of the aquifer system and classify same into different groundwater potential zones.
Description of the Environment of the Study Area
The study area is underlain by the Basement Complex Rocks of Southwestern Nigeria [18]. However, the study area is devoid of rock outcrops which make it difficult to have a complete description of the underlying geology. Samples of grey gneiss have been extracted from few boreholes and hand dug wells constructed around the campus. The vegetation is the tropical rainforest type. However, the rainforest vegetation has been transformed to a derived savannah type as a result of human activities such as intensive land cultivation, bush burning, land clearing for agricultural and construction purposes. The area is characterized by two distinct seasons: the rainy season and the dry season. The rainy season lasts for seven months (April to October) with mean annual rainfall of 1500 mm-2000 mm while the dry season begins in November and ends in March. The diurnal range in temperature is not significant, but the daily temperature can reach 29°C and is seldom lower than 25°C.
Research Methodology
Magnetic data were acquired at every 10 m inter-station interval across the roads network on the campus using the proton precession magnetometer (PPM). The data were processed using the Geosoft Oasis Montaj software package. The processed magnetic data were used to generate 2D Total Magnetic Intensity (TMI) regional map from which the residual map was generated using the revisualization process. Qualitative interpretation of the residual magnetic intensity map was carried out to reveal area with basement high and depressions in the study area. Blakely [19] showed that residuals can be derived by analytically continuing ground magnetic data to a slightly higher surface and subtracting that from the regional data. Seventy (70) Vertical Electrical Sounding (VES) data were also acquired (Figure 1). Schlumberger Array was used while the half current electrode spacing (AB/2) was varied between 1 m and a maximum of 100 m. The apparent resistivity data acquired with the Campus Ohmega Resistivity Meter were plotted on a log-log paper and the resulting sounding curves were interpreted quantitatively. The preliminary geoelectrical parameters (resistivities and thicknesses) obtained were used as starting model parameters in 1-D forward modelling using the WinResist software. The final geoelectrical parameters were used to generate 2-D geoelectric sections, isopach and isoresistivity maps of the weathered layer. The study area was subsequently categorized into different groundwater potential zones by integrating the results obtained from the two methods.
Results and Discussion
Ground magnetic survey
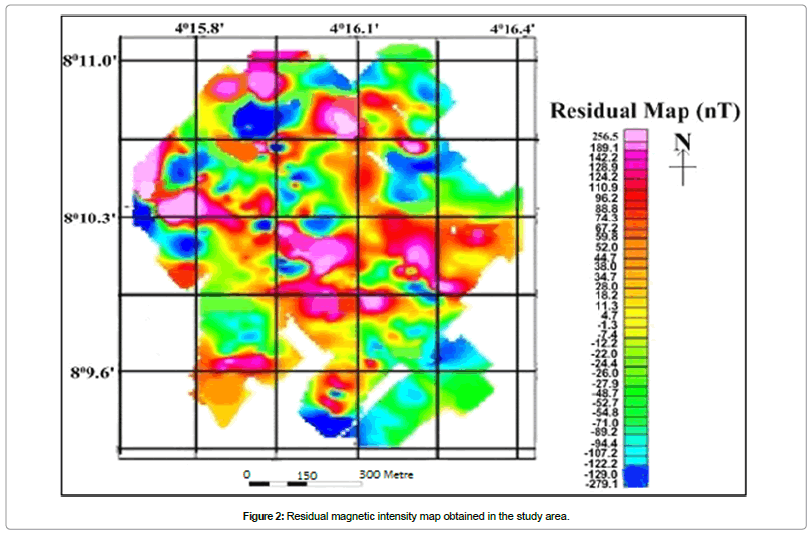
Figure 2 presents the residual magnetic intensity maps obtained in the study area. Three (3) major magnetic anomaly zones were delineated from the residual magnetic intensity map. These included area with magnetic intensity value ranged between 111 nT and 256 nT. The area presumably coincides with the basement high in the study area. The second magnetic structural trend is the area with intermediate geomagnetic intensity values ranged between -12 nT and 38 nT. The third structural trend has magnetic intensity range of between -279 nT and -89 nT which presumably underlain by deep-seated basement bedrock. According to Jiakang and Morozov [20], these trends often coincide with litho-tectonic domains and depend on the scale of investigation. Hence, the third anomalous zone is presumably the weathered layer or tectonically influenced part of the study area which could be conduit for groundwater accumulation.
Electrical resistivity investigation
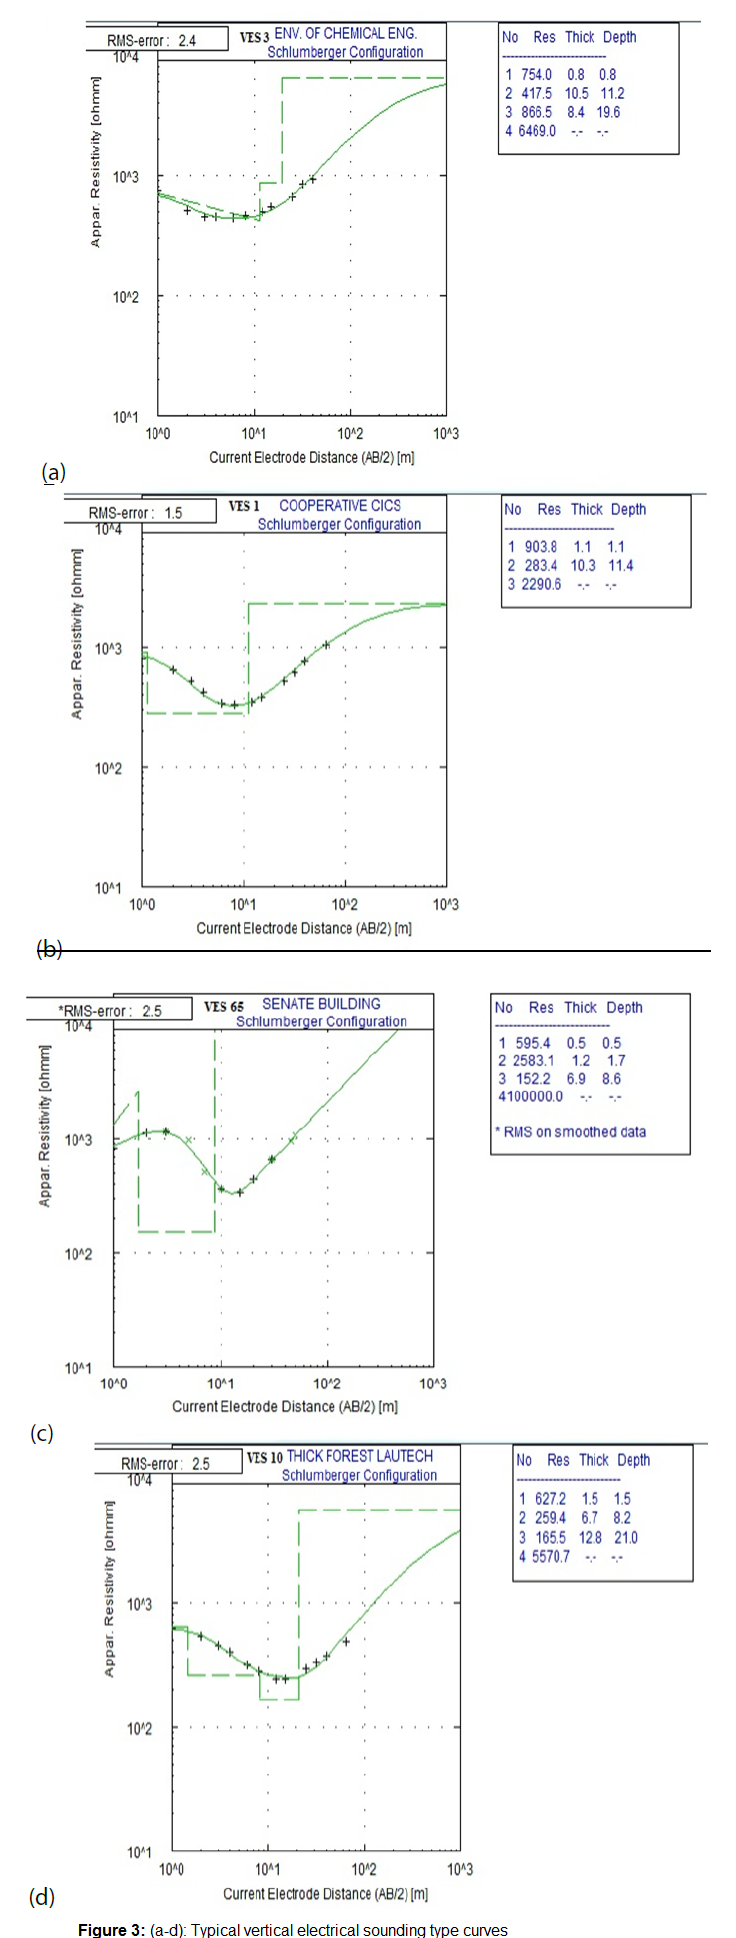
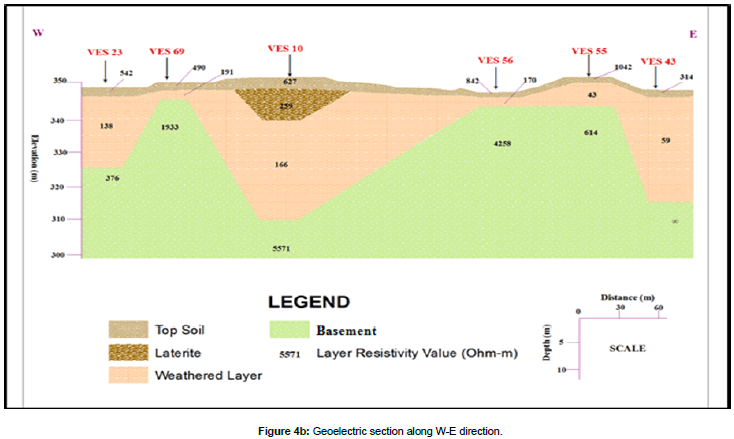
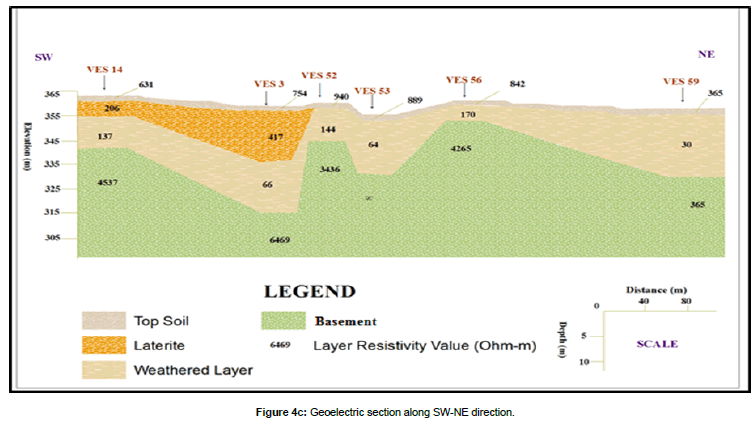
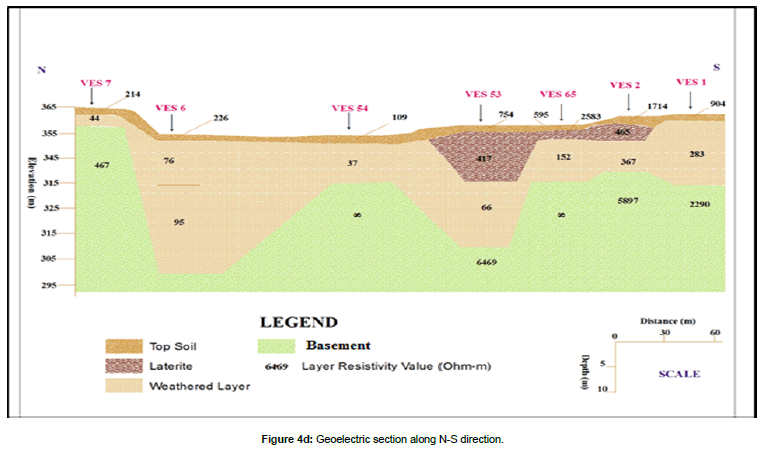
The type curves obtained from the study are the H, QH, HA and KH type (Figures 3a-3d) (Figures 4a-4d) show 2-D geoelectric sections along NW-SE, W-E, NE-SW and N-S azimuth directions (Figure 1). Three to four subsurface layers were delineated beneath the sections.
These include the topsoil, laterite, the weathered layer (which constitutes the main aquifer in the study area) and the fresh basement respectively. The topsoil has thickness ranged of between 0.3 m and 2.1 m while the resistivity value ranged between 170 Ωm and 2586 Ωm. It is composed of sandy clay/clayey sand and laterite. Laterite constituted the second layer. Its resistivity values ranged between 206 Ωm and 417 Ωm while the layer thickness ranged between 3.0 m and 4.5 m. The weathered layer thickness ranged between 2.1 m and 23.2 m while its resistivity values ranged between 30 and 367 Ωm. This layer is composed of clay, sandy clay and clayey sand. Low resistivity values <100 Ωm is characteristic of clay. Clay is porous but has low permeability and hence low groundwater yielding tendency. The relatively high resistivity value (>100 Ωm) typify sandy clay and clayey sand. The sandy layer is porous and permeable with tendency for relatively high groundwater yielding capacity [21]. The fourth layer is the basement bedrock. Its resistivity values ranged between 376 Ωm and ∞. The depth to the basement rockhead varies between 0.3 m and 23.2 m which is an indication that the study area is characterized by relatively thin overburden cover.
The isopach and isoresistivity maps of the weathered layer
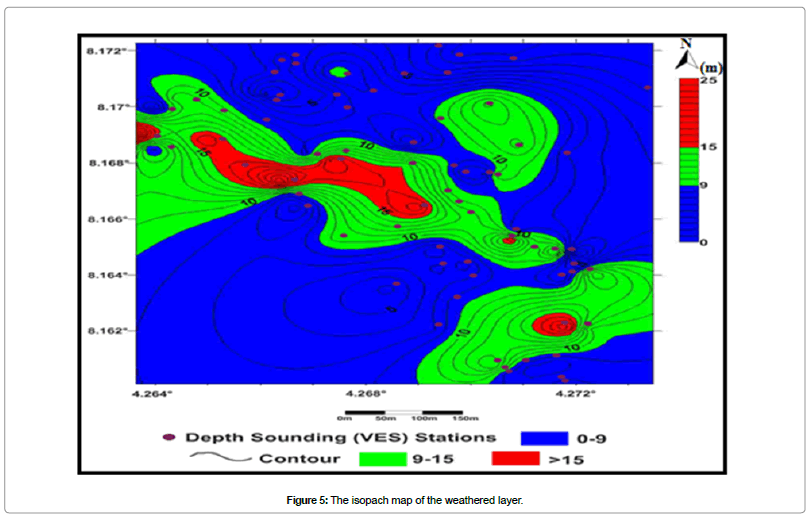
Figure 5 presents the isopach map of the weathered layer in the study area. The map shows that the weathered layer thickness in the study area was categorized into 0-9 m; 9-15 m and ˃15 m thickness zones.
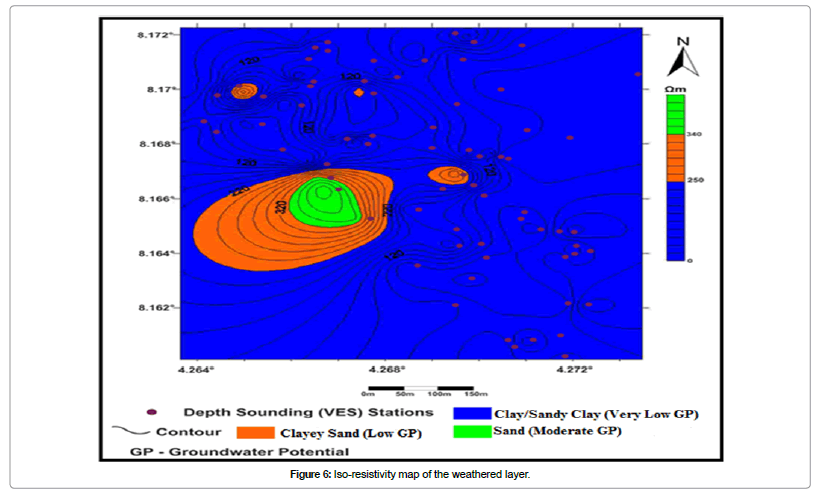
Figure 6 shows the isoresistivity map of the weathered layer. The map indicates that most part of the study area are underlain essentially by clay/sandy clay of resistivity range of between 1 Ωm and 250 Ωm while the North-Western, West and central parts of the area are underlain by clayey sand with resistivity value ranged between 250 Ωm and 340 Ωm.
Groundwater potential rating
The nature of the weathered layer is a very important parameter in groundwater potential evaluation of a basement complex terrain [22-29]. The thickness of weather layer is insignificant in groundwater potential rating. A horizon is regarded as a significant water-bearing layer if the resistivity parameters suggest saturated conditions [30,31]. By integrating (Figures 2-6) the groundwater potential of the study area could be categorized. Area with weathered layer thickness value of between 1 and 9 m, 111 nT and 257 nT residual magnetic intensity value (which indicates basement high) and 1-250 Ωm weathered layer resistivity value range (typifies clay/sandy clay) is characterized by very low groundwater potential; area with -12 nT to 38 nT residual magnetic intensity value, 9 and 15 m weathered layer thickness and 250-340 Ωm weathered layer resistivity value range (characterized by clayey sand) are underlain by low groundwater potential while area with magnetic intensity value of between -279 to -89 nT (basement depressions), weathered layer thickness of ˃15 m and ˃340 Ωm (probably sand) is characterized by moderate groundwater potential.
North-Eastern, East and the South-Eastern parts of the study area are underlain essentially by clay/sandy clay of resistivity range of between 1 Ωm and 250 Ωm (this zone is characterized by very low groundwater potential) while the North-Western, West and central part are underlain by clayey sand with resistivity value range of between 250 and 340 Ωm is underlain by low groundwater potential. However, there is pocket of moderate groundwater potential with resistivity value ˃340 Ωm around the southwestern part of the study area.
The generally low groundwater potential rating of the area may be as a result of the low permeability usually associated with clayey weathered aquifer which underlain the study area coupled with relatively thin overburden cover (materials above the weathered layer) in most places. Summary of the groundwater rating of the study area is contained in Table 1.
| Groundwater Potential Rating |
Range of Thickness of Weathered Layer (m) |
Range of Magnetic Intensity (nT) |
Range of Resistivity of Weathered Layer (Ωm) |
Inferred Nature of Aquifer System in the Zone |
|---|---|---|---|---|
| Very Low | 1-9 | 111 to 257 | 1-250 | Clay/Sandy Clay |
| Low | 9-15 | -12 to 38 | 250-340 | Clayey Sand |
| Moderate | ˃15 | -279 to -89 | ˃ 340 | Sand |
Table 1: Summary of the groundwater potential zones delineated in the study area.
Summary and Conclusion
The residual magnetic intensity map obtained in the study area showed three distinct geomagnetic zones with high intensity ranged of 111 nT and 256 nT which could be bedrock with thin overburden cover (basement high), an intermediate intensity ranges of -12 nT and 38 nT and possibly basement depressions (weathered basement) with low magnetic intensity ranged of between -279 nT and -89 nT. The geoelectric sections delineated four subsurface layers. The resistivities and thicknesses values of the layers were 170 Ωm to 2586 Ωm; 206 Ωm to 417 Ωm; 30 Ωm to 465 Ωm and 376 Ωm to ∞ and 0.3 m to 2.1 m; 3.0 m to 4.5 m and depth to rockhead of 0.3 m and 23.2 m. The isoresistivity map of the weathered layer showed relatively low resistivity values typified by clay/sandy clay most part of the study area. The study area was categorized into very low to moderate groundwater potential with the integration of residual magnetic intensity, isopach and isoresistivity of weathered layer maps of the study area. The study therefore concluded that the groundwater potential of the area was generally low due to clay content of the aquifer. However, patches of moderate groundwater potential characterized some places.
References
- Gholam RL, Mohammad N (2005) Geoelectric investigation for the assessment of groundwater conditions: A case study. Annals of Geophysics 48: 6: 937-944.
- Olorunfemi MO, Ojo JS, Oladapo MI (1998) Geological, hydrogeological and geophysical investigation of exposed 20’ Escravos Lagos Pipeline. Technical Report 15: 22-29.
- Oladapo MI, Mohammed MZ, Adeoye OO, Adetola BA (2004) Geoelectrical investigation of the ondo state housing corporation estate, Ijapo Akure, Southwestern Nigeria. J Min Geol 40: 41-48.
- Ayolabi EA (2005) Geoelectric evaluation of groundwater potential: A case study of Lagbaka Primary School, Akure, SouthWest, Jour Goel Soc India 66: 491-495.
- Oladapo MI, Akintorinwa OJ (2007) Hydrogeophysical study of Ogbere Southwestern Nigeria. Global J. Pure and Applied Sci 13: 55-61.
- Omosuyi GO, Ojo JS, Olorunfemi MO (2008) Geoelectric sounding to delineate shallow aquifers in the coastal plain sands of Okitipupa Area, Southwestern Nigeria. The Pacific Journal of Science and Technology 8: 562-577.
- Atakpo EA, Ayolabi EA (2008) Evaluation of aquifer vulnerability and the protective capacity in some oil producing communities of Western Niger Delta. Environmentalist Springer 29: 310-317.
- Abiola O, Enikanselu PO, Oladapo MI (2009) Groundwater potential and aquifer protective capacity of overburden units in Ado-Ekiti, Southwestern Nigeria. International Journal of Physical Sciences 4: 120-132.
- Omosuyi GO (2010) Geoelectric assessment of groundwater prospect and vulnerability of overburden aquifers at Idanre, Southwestern Nigeria. Ozean Journal of Applied Sciences 3: 19-28.
- Oyedele KF, Ogagarue DO, Esse O (2011) Groundwater potential evaluation using geophysics at Oru Imope, Southwestern Nigeria. European Journal of Scientific Research 63: 515-522.
- Bayowa OG, Olorunfemi MO, Akinluyi FO, Ademilua OL (2014) Integration of hydrogeophysical and remote sensing data in the assessment of groundwater potential of the basement complex terrain of Ekiti State, Southwestern Nigeria. Ife Journal of Science 16: 353-363.
- Fitterman DV, Stewart MT (1986) Transient electromagnetic sounding for groundwater. Geophysics 51: 995-1005.
- Mazac O, Kelly WE, Landa I (1987) Surface geoelectrical methods for groundwater pollution and protection studies. Journal of Hydrology 93: 277-287.
- McNeill JD (1987) Advances in electromagnetic methods for groundwater studies. Proceedings of Exploration. Applications of Geophysics and Geochemistry 4: 678-702.
- Olasehinde PI (1989) Elucidating fracture patterns of the nigerian basement complex using electrical resistivity method. Z. Angew Geowiss Heff 8: 109-120.
- Gowd SS (2004) Electrical resistivity surveys to delineate groundwater potential aquifers in Peddavanka Watershed. J Envir Geol 46: 118-131.
- Rahaman MA (1988) Recent advances in the study of the basement complex of Nigeria. In Precambrian Geology of Nigeria. Geological Survey of Nigeria 8: 11-43.
- Blakely RJ (1995) Potential theory in gravity and magnetic applications. Cambridge University Press, USA. p: 313.
- Jiakang L, Morozov I (2005) Potential field investigation of williston basin basement. Canadian Society of Exploration Geophysicists. National Convention 11: 65-66.
- Bayode S, Ojo JS, Olorunfemi MO (2006) Geoelectric characterization of aquifer types in the basement complex terrain of parts of Osun State, Nigeria. Global Journal of Pure and Applied Sciences 12: Â 377-385.
- Clerk L (1985) Groundwater abstraction from basement complex areas of Africa. J Eng Geol 18: 25-34.
- Olorunfemi MO, Olorunniwo MA (1985) Geoelectric parameters and aquifer characteristics of some parts of Southwestern Nigeria. Geologia Application. Indogeologia 20: 99-109.
- Olorunfemi MO, Olarewaju VO, Alade O (1990) On the electrical anisotropy and groundwater yield in a basement complex area of S.W. Nigeria. Journal of Africa Earth Sciences 12: 467-472.
- Aladejana OO, Anifowose AYB, Fagbohun BJ (2016) Testing the ability of an empirical hydrological model to verify a knowledge-based groundwater potential zone mapping methodology. Model Earth Syst Environ 2: 1-17.
- Akinlalu AA, Adegbuyiro A, Adiat KAN, Akeredolu BE, Lateef WY (2017) Application of multi-criteria decision analysis in prediction of groundwater resources potential: A case of Oke-Ana, Ilesa Area Southwestern Nigeria. NRIAG J Astron Geophys 6: 184-200.
- Dasho OA, Ariyibi EA, Akinluyi FO, Awoyemi MO, Adebayo AS (2017) Application of satellite remote sensing to groundwater potential modelling in Ejigbo area. Model Earth Syst Environ 6: e18315
- Ilugbo SO, Adebiyi AD (2017) Intersection of lineaments for groundwater prospect analysis using satellite remotely sensed and aeromagnetic dataset around Ibodi, Southwestern Nigeria. Int J Phys Sci 12: 329-353.
- Akinluyi, FO, Olorunfemi MO, Bayowa OG (2018) Investigation of the influence of lineaments, lineament intersections and geology on groundwater yield in the Basement Complex Terrain of Ondo State, Southwestern Nigeria. Applied Water Science 8: 38-49.
- Shemang EN (1993) Groundwater potentials of Kubami River Basin, Zaria, Nigeria, from D.C. resistivity study. Water Resources 2: 36-41.
- Bala AE, Ike EC (2001) The aquifer of the crystalline basement rocks in Gusau Area, Northwestern Nigeria. J Min Geol 37: 177-184.
Select your language of interest to view the total content in your interested language
Share This Article
Recommended Journals
Open Access Journals
Article Tools
Article Usage
- Total views: 5075
- [From(publication date): 0-2018 - Dec 23, 2025]
- Breakdown by view type
- HTML page views: 4155
- PDF downloads: 920


