GGE Biplot Analysis of Yield Performance and Stability of Pearl Millet Genotypes (Pennisetum glaucum (L.) R. Br.) Across Different Environments in Ethiopia
Received: 06-Aug-2021 / Accepted Date: 20-Sep-2021 / Published Date: 27-Sep-2021 DOI: 10.4172/2329-8863.1000478
Abstract
The study was conducted in northern and western parts of Ethiopia specifically at Sheraro, Humera and Miesso locations for consecutive years beginning from 2012 to 2014. The main objective of the study was to evaluate and identify better performance and stable pearl millet genotypes across different environments and years. Fifteen pearl millet genotypes were tested at different locations and promising genotypes could be identified. The experiment was conducted using randomized complete block design with three replications. Combined mean analysis was computed after using Anderson-Darling normality test and Levene homogeneity test. Genotype and Genotype by environment interaction (GGE) biplot analysis were computed to evaluate stability and adaptability of the grain yield of pearl millet genotypes. The analysis of ANOVA indicated that the mean grain yield ranged from 1687.28 kg ha-1 for G14 (ICMV 8400 white) to 2304.72 kg ha-1 for G2 (Sub-2). From the total pearl millet genotypes seven of the genotypes showed above the mean average yields. The highest (2542.27 kg ha-1) and the lowest (1593.42 kg ha-1) grain yield were attained at Miesso in 2013 and at Sheraro in 2014 respectively. GGE biplot analysis was also computed to identify the performance and stability of pearl millet genotypes and hence a total of 72.05% variation was showed for the tested pearl millet genotypes at different environments. The study result revealed that the most responsive of corner genotypes were genotype three, genotype four, genotype five, genotype ten and genotype fourteen. At the same time genotype three, genotype six, genotype eight, genotype ten and genotype fourteen with the longest projection from the AEC x-axis were highly unstable. In contrast, genotype four, genotype two, genotype eleven and some other invisible genotypes were highly stable. In terms of stability and performance genotype four (Sub-2) was the highest followed by genotype one (Kolla-1). Regarding the GGE biplot analysis, it was the most powerful method to analyze, visualize and interpret the genotype and environment interaction. It was also a convenient procedure to genotypes stability studies and environments that has to be applied in plant breeding program. At the end, the top performed pearl millet technology should be more popularized and seed disseminated to farmers to grow at wider acreages to ascertain food security and overall livelihood improvement.
Keywords: GGE biplot; Genotype; Grain yield; Stability
Introduction
Yield performance of crops varies due to the genetic makeup of the genotypes, climatic condition and different soil constituents which are the cause for considerable variation in crop circumstances. This is due to low heritability of yield as a typical quantitative trait. Consequently, grain yield could be affected by not only genotype, but also by environment as well by and genotype x environment interactions. Multi Environment Trials (METs) are important for studying yield stability, adaptation and as well for a prediction of yield performance of genotypes across environments [1]. Typically, environment expresses most of the total yield variations, while genotype and Genotype × Environment Interaction (GEI) are usually less effective. A large GEI variation usually hinders the accuracy of yield estimation and reduces the correlation between genotypic and phenotypic values. GEI is a universal phenomenon when different genotypes are tested in a number of environments, and is an important issue for plant breeders and agronomists to predict cultivar behavior in different locations across different years prior to any variety recommendation.
Different models have been used to describe the genotype and environment effect and the most power full method is a GGE biplot model which has been used to analysis several crops. It clearly described that the phenotypic yield variation; an environment main effect describes more observed variation; while a genotypes main effect and GE interaction is usually smaller. At the same time Cooper and Hammer reported that the relevant variance components in genotype evaluation at MET is a Genotype main effect (G), and GE interaction, which are regarded as repeatable sources. Hence, Yan proposed using both G and GE effects instead of only GE interaction for yield stability analysis. It was elaborated that to facilitate use of this model, the biplot approach was used to display the GGE of a MET data set. GGE biplot model help to demonstrate graphically a GE interaction pattern so that it considered as an effective tool to identify a mega-environment, genotype evaluation based on yield and stability [2]. It is also a means to evaluate test environments from a discrimination aspect. All in all, a GGE biplot indicates both genotype and environment based on site regression (SREG) model which have been used to demonstrate a GE interaction pattern.
The study was carried out to interpret Genotype-Environment (G×E) interaction effects on pearl millet grain yield via AMMI analysis, find out stability and adaptation pattern of genotypes using visual assessment technique of GGE biplot, and determine the most suitable genotypes while combining a high level of grain yield with yield stability [3].
Objectives of the study
The main objectives of the study were to determine the magnitude and patterns of G×E interaction effects in pearl millet using GGE biplot methods of analysis, to display graphically the mean performance and stability of 15 pearl millet genotypes.
Materials and Methods
Fifteen improved pearl millet genotypes including one standard check (kolla-1) were used as an experimental material. The study was performed in a completely randomized block design with three replications across four test locations starting from 2012 to 2014 growing period. The tested locations were Sheraro, Miesso, Humera and in each site the experiment was conducted for one, three, and two consecutive years respectively. Sowing and other related agronomic practices were done as per recommendations. Data were collected from each location and treated separately [4]. Combined mean analysis was computed after using Anderson-Darling normality test and Levene homogeneity test.
In GGE biplot analysis the yield of a given crop in an environment is a mixed effect of Genotype main effect (G), Environment main effect (E), and Genotype by Environment interaction (GE). In normal METs, E accounts for 80% of the total yield variation, and G and GE each account for about 10%. For the purpose of genotype evaluation, however, G and GE are relevant to separately identify the effect of the genotype, the environment and its interaction of GE [5]. Furthermore, both G and GE must be considered in genotype evaluation, thus the term GGE. To explore G plus GE variability in yield of pearl millet, the SREG model was used presented by the following equation.
Results and Discussion
Descriptive analysis
Grain yield performance of 15 Pearl millet genotypes grown at different environments are described. The mean grain yield ranged from 1687.28 kg ha-1 for G14 (ICMV 8400 white) to 2304.72 kg ha-1 for G2 (Sub-2). From the total pearl millet genotypes seven of the genotypes showed above the mean average yields [6]. The highest (2542.27 kg ha-1) and the lowest (1593.42 kg ha-1) grain yield were attained at Miesso in 2013 and at Sheraro in 2014 respectively.
Combined analysis
The combined analysis of ANOVA for pearl millet genotypes that were evaluated at different locations has been described. The analysis ANOVA revealed that the mean grain yield showed highly significant variation for the tested locations and the interaction of genotypes by the environment.
GGE biplot analysis
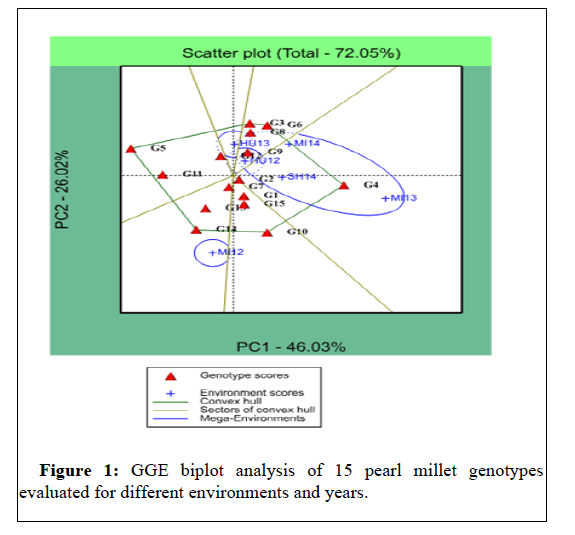
The GGE biplot analysis showed that PCA 1 and PCA 2 described for 46.03% and 26.02% of GGE sum of squares respectively for grain yield of pearl millet genotypes, elucidating a total of 72.05% variation as indicated in Figure 1.
The GGE biplot analysis for pearl millet genotypes grown in different environments are presented in Figure 1. According to the biplot graphical representation genotypes located at the corner were the most responsive and could easily be determined. The most responsive of the corner genotypes were G3, G4, G5, G10 and G14 [7].
The which-won-where biplot showed different winning genotypes in different environments. Pearl millet genotype of G4 won in most of the environments except for Miesso in year 2012. In general, the tested environments were overlapped except for Miesso in year 2012.
Pearl millet genotypes that were located far away from all tested locations, revealing that the yield performance was poorest as compared to others. At the same time, those genotypes which were located within the polygon for instance G1 and G9 were less responsive. In Figures 1-4 genotype of G4 was favorable at Miesso in year 2013 and at Sheraro in year 2014. Similarly, at Humera G4 was the most favorable genotype in year 2012 and 2013. This elucidated that genotype G4 had broader favorable environments as compared to other pearl millet genotypes.
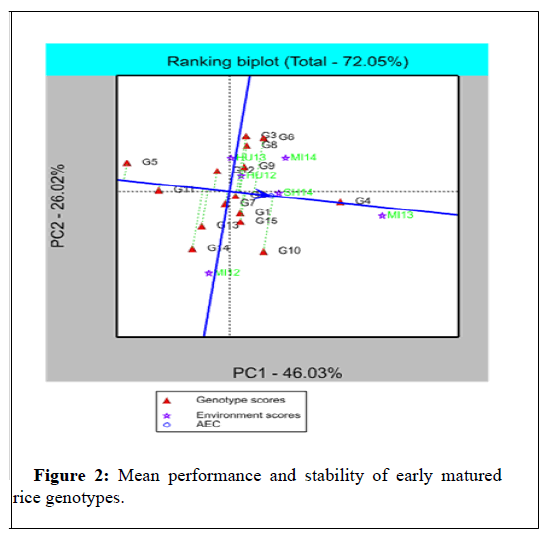
The average performance and stability of pearl millet genotypes were indicated in Figure 2. Genotypes were arranged in ranking along the average environment coordinate or average environment axis (AEC x-axis) with an arrow indicating the highest value based on their mean performance across different environments. As indicated in Figure 2 G4 which was closer to the AEC x-axis arrow had the highest mean grain yield followed by G1; whereas genotypes of G5, G11, G13, G14, and other invisible genotypes which were located further away from the AEC x-axis arrow had the poorest yields [8]. Pearl millet genotypes of G3, G6, G8, G10, and G14 with the longest projection from the AEC x-axis were highly unstable. Similarly, G4, G2 and G11 and some other invisible genotypes were highly stable. Stability of sorghum genotypes were assessed by Adugna. It is clear that a given genotypes which was stable at different environments did not mean that it had better performance and vice versa. However, from breeding point of view stable and better performance genotypes are highly recommended for further production. Based on this, genotype of G4 had better performance and stable as compared to others. So that in terms of stability and better performance G4 is a recommended genotype followed by genotype G2 as indicated in Figure 2.
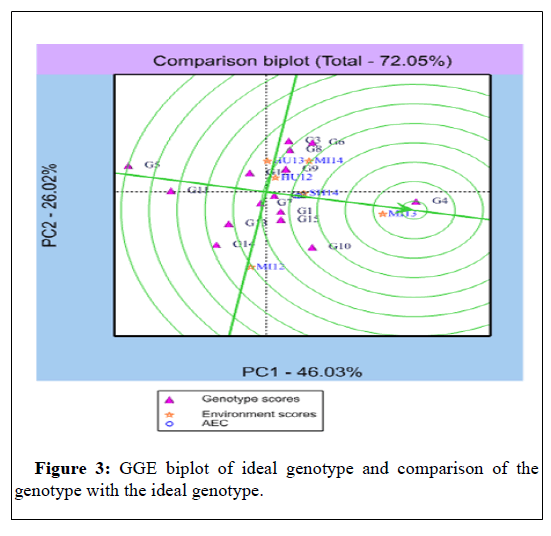
In GGE analysis identification of ideal genotype is one of the basic elements to identify the genotype among the tested genotypes that have been evaluated at different environments. An ideal genotype where the high mean grain yield and most stable genotypes showed based on the center of the concentric circles (Figure 3). This means projection of the ideal genotype on an average tester coordinate (ATC) horizontal axis is equal to the longest vector of all genotypes and its projection on ATC vertical axis is zero that means it is absolutely stable [9]. Hence, G4 is the ideal genotypes followed by G2 because there is smaller distance from the genotypes to the virtual ideal genotype as indicated in Figure 3.
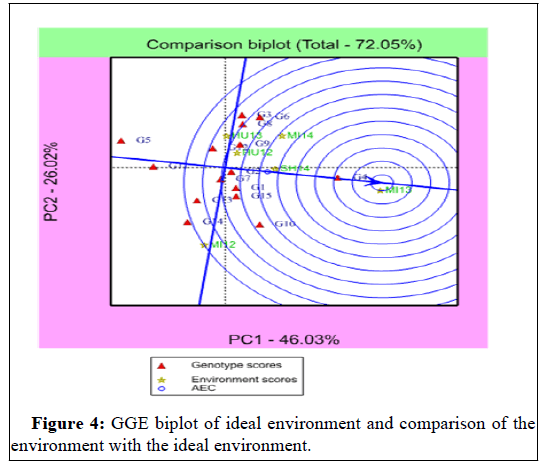
In GGE analysis there is a possibility to identify an ideal environment to genotypes based on the projection of ideal environment on the ATC horizontal axis which is equal to the longest vector of all environments. The closer environments to the virtual ideal environment indicated that the environment is suitable to test the genotypes. Hence, pearl millet genotypes tested at Miesso in year 2013 was more suitable environment followed by Sheraro in year 2014. Pearl millet genotypes tested at Miesso in year 2012 and at Humera in year 2013 were located far from the ideal environment and genotypes tested in these environments showed lowest performance in average grain yield as indicated in Figure 4.
Conclusion
Pearl millet genotypes evaluated at different environments showed variation in terms of the genetic potential of the genotype and continues expression of the desirable traits across the environments. In this study the performance of each pearl millet genotype was the result of the genetic constitution of the genotype, the environment and the interaction of both genotypes and environment as reported by Gauch and Zobel in year 1996. Hence, the study on the performance and stability of genotypes that was conducted at different environments revealed that G4 showed closer stability and better performance among the tested pearl millet genotypes. At the same time among the tested genotypes G4 was an ideal genotype because of smaller distance from the genotypes to the virtual ideal genotype. The ideal environment was also analyzed and the result confirmed that among the tested environments Miesso in year 2013 was a suitable environment followed by Sheraro in year 2014. So that Genotype G4 should be released for pearl millet growing areas and this genotype is believed to increase production and productivity in major pearl millet growing regions in the country. Furthermore, GGE biplot analysis was the most powerful method to analyze, visualize and interpret the genotype and environment interaction. It was also a convenient procedure to genotypes stability studies and environments that have to be applied in plant breeding program. Finally, the top performed pearl millet technology should be more popularized and seed disseminated to farmers to grow at wider acreages to ascertain food security and for the overall livelihood improvement of the crop growers.
References
- Adugna A (2010) Assessment of Yield Stability in Sorghum. Afr Crop Sci J 15: 83-92.
- Alwala S, Kwolek T, McPherson M, Pellow J, Meyer D (2010) A Comprehensive Comparison between Eberhart and Russell Joint Regression and GGE Biplot Analyses to Identify Stable and High Yielding Maize Hybrids. Field Crop Res 119: 225-230.
- Annicchiarico P, Harzic N, Carroni AM (2010) Adaptation, Diversity, and Exploitation of Global White Lupin (Lupinus albus L.) Landrace Genetic Resources. Field Crops Res 119: 114-124.
- Dehghani H, Sabaghnia N, Moghaddam M (2009) Interpreta¬tion of genotype-by-environment interaction for late maize hybrids’ grain yield using a biplot method. Turk J Agric Fores 33: 139-148.
- Gabriel KR (1971) The biplot graphic of matrices with application to principal component analysis. Biometrics 58: 453-467.
- Gauch HG, Zobel RW (1997) Identifying Mega-environments and Targeting Genotypes. Crop Sci 37: 311-326.
- Hassanpanah D (2011) Analysis of G×E Interaction Using the Additive Main Effects and Multiplicative Interaction (AMMI) in Potato Cultivars. Afr J Biotechnol 10: 154-158.
- Ilker E, Tonk FA (2009) Assessment of Genotype× Environment Interactions for Grain Yield in Maize Hybrids Using AMMI and GGE Biplot Analysis. Turk J Field Crops 14: 123-135.
- Yan W, Hunt LA, Sheng Q, Szlavnics Z (2000) Cultivar evalu¬ation and mega-environment investigation based on GGE biplot. Crop Sci 40: 597-605.
Citation: Solomon H, Yohan AG (2021) GGE Biplot Analysis of Yield Performance and Stability of Pearl Millet Genotypes (Pennisetum glaucum (L.) R. Br.) Across Different Environments in Ethiopia. ACST 9: 478. DOI: 10.4172/2329-8863.1000478
Copyright: © 2021 Solomon H, et al. This is an open-access article distributed under the terms of the Creative Commons Attribution License, which permits unrestricted use, distribution, and reproduction in any medium, provided the original author and source are credited.
Select your language of interest to view the total content in your interested language
Share This Article
Recommended Journals
Open Access Journals
Article Tools
Article Usage
- Total views: 2697
- [From(publication date): 0-2021 - Nov 07, 2025]
- Breakdown by view type
- HTML page views: 1874
- PDF downloads: 823


