Impact of Ponds on Local Climate: A Remote Sensing and GIS Contribution Application to the Ponds of Brenne (France)
Received: 22-Oct-2018 / Accepted Date: 25-Dec-2018 / Published Date: 31-Dec-2018 DOI: 10.4172/2471-8556.1000503
Abstract
The influence of climate change on water bodies, particularly large ones, has been the subject of numerous studies that have demonstrated significant modifications or disturbances of the hydrological cycle (lower water volumes, higher temperatures and disruption of thermal stratification, increased direct evaporation), either by interpretation of sedimentary records or by direct measurements. However, at the scale of small limnic entities, these changes are barely noticeable and are only translated by a mere human reflection of increased freshness and densification of fog masses in limnic areas. The results of direct field measurements carried out in the Brenne study sites coupled to indirect methods for surface temperature estimation (remote sensing) converge to indicate either a rise of a several degrees (4-5°C) on and around the water bodies during winter periods or a decrease in summer. The magnitude of these thermal anomalies increases in areas characterized by a high density of ponds, giving these areas a distinct characteristic climatic context. The thermal envelopes change according to the seasons and the types of weather and may at times exceed 100 m to 200 m of extension around the water bodies giving rise to a particular climatic atmosphere. The proximity of the ponds in Brenne and their density give the area a climatic character translated by weather types very different from its surrounding and neighboring regions. Due to their effect the oceanic climate character is locally masked at times and during periods of high thermal contrast.
Keywords: Ponds; Temperatures; Brenne; Climatic change; Ecosystem; Limnology
Introduction
The acuteness and intensity of climate change observed over the last forty years across the world, through direct measurements or by sensitive proxies to this phenomenon (sedimentary archives of the Great Lakes, Polar Ice, Dendrology) [1-3] confirm the disruption of ecosystems (decrease of water volumes, increase of evaporation and evapotranspiration) such as the Great African Lakes, Great Lakes and Lake Baikal. The impacts of climate change possesses on humans are direct (conflicts, health, economy) [4-6].
From a climatic point of view, the presence of these water bodies of regional coverage impacts the climate on the local scale [7,8] thus creating micro-climates manifested by temperature decreases of few degrees (Great Lakes: 4-5°C) and/or by increased direct losses by evaporation (Tchad lakes [9] or direct shrinking (Aral Sea) [10]. Studies on this phenomena have been extensively focused on large water bodies (lakes) especially on the American Great Lakes [2,11,12] the Baikal lake, the Victoria lake and the Tchad lakes that witnesses large significant water losses by evaporation.
Small water bodies, especially ponds, have been subject of relatively few studies measuring the influence and degree of climate change at their scales despite the several observed degradation signs by their managers, namely: declining water volumes and levels in associated rivers, disruption of the hydrological cycle, early drying of riparian strips, etc. Inversely, this rise in temperatures is locally translated by climate changes creating local climatic atmospheres and for certain types of often appreciated weathers (warm-hot) (temperature drop of a few degrees in the immediate vicinity of these ponds).
The French Central region is characterized by a relatively high density of ponds confined to two sites (Brenne and Sologne), In addition to their characteristic extent, these water bodies present also a strong heritage character proper to this region. The density of these ponds (~26,000) and their proximity suggests a possible implication of these limnic entities on local climate dynamics. Historical records have shown that these areas possess possible repercussions on human health either directly positive or negative. Positive effects are translated by rendering these areas climatically fresh sites particularly for touristic activities, whereas negative effects are observed when these transform into potential respiratory pathogens spreading zones. Among the direct and visible climate markers, the number of cloudy and/or foggy days is relatively higher than in its surroundings during certain periods. The analysis of chronic climates and determination of weather types infer weather conditions that suggest an active participation of ponds in this climatic dynamism in their direct surroundings. We can speak in this case of climatic environment [13] because of the much localized and relatively ground level climatic envelopes. When considering the direct and visible climatic markers, the number of cloudy/foggy days is relatively higher than its surroundings during certain periods [14].
The combined use of meteorological data over relatively long periods (MetoFrance) converges with the results obtained on a global scale. In order to complete these first observations and study accurately at the spatial scale the involvement of ponds in local climate dynamics, the use of remote sensing (THRS) [15-18], for surface temperatures estimation at the scale of the region and particularly at the scale of the park was utilized. Used for the first time on this type of natural objects and on regions marked by the abundance of small water bodies but in the density assimilable to a water surface similar as large as the water bodies mentioned previously, the use of Remote Sensing could be a promising tool for qualification of all national and international limnic surfaces related to these limnic entities. Consequently, surface temperatures (LST) are the temperatures that could be measured using earth observation satellite sensors; they only concern the upper part of the earth. Used mainly to measure climatic impacts on glaciers, vegetation [19,20], these meet the need for forecasting or prediction of changes particularly in semi-arid countries whose climate unpredictability often leads to sudden changes particularly in precipitation regimes (thunderstorms, floods). The computation of the LST however is not simple but rather requires many numerical treatments like the Split- Window (SW) and [21] algorithms and the Single Channel (SC) algorithm [19,22].
Geographical and socio-economic context
The region characterized by a Park regrouping around 51 communes and 5 local communities with a surface of 176 000 hectares (1760 km2). This park is dedicated to the management and protection of the natural space that houses two nature reserves (Chérine and Foucault). It includes a total of 4500 ponds and a few hundred inland marshes (Figure 1). Ponds are regrouped in a chain form of which most are private. The main activity related to these water bodies is aquaculture (trout, carp) producing 1350 tons per year from which a large part of which is exported to international markets (Germany). The region is distinguished by its recreational and therefore touristic potential especially during the summer period.

Figure 1: Location of the study area (La Brenne).
The favorable geological characteristics of the region (granite: clay and sandstone with medium permeability) for pond development and water stagnation has amply favored the development of a relatively dense network of small artificial water bodies ultimately giving rise to an area called “The land of ponds” (26000). The presence of Claise and Creuse as major rivers has probably a strong role as a factor of development for these entities due to potential water exchanges that can feed these support aquifers and therefore promote the development of these water bodies. In terms of climate, the region is characterized by a strong oceanic influence marked by average annual rainfall of about X mm and average temperatures of X°C.
Research Methodology
Two stages were devoted for measuring the main climatic parameters in order to characterize the impact of the Brenne water bodies on the local climate. A first phase consisted of direct measurement using adapted instrumentation (four Vantage Pro weather stations installed around the area in order to pin point and precisely identify perceptible changes) coupled to direct measurements on a regular grid of surface temperatures using a material of type Testo 625 with precision ± 0.5°C (Figure 2). Measurements were conducted at a height of 210 cm over the entire northern part of the Brenne Park. This first phase made it possible to note primary observations thus enabling us to carry out thermal zoning at the scale of the ponds zone at first step and to potentially validate the results of calculations extracted from satellite imagery.

Figure 2: Thermal measurement protocol applied to the Foucault space for field measurements.
The second phase was oriented towards the determination of surface temperatures using indirect techniques (remote sensing). A total of four missions were used to calculate surface temperatures. Four Landsat 8 TIRS images from 1987, 2002, 2014 and 2018 were chosen respectively and thermal bands 10 and 11 of each were selected. Treatments were carried out using the Split-Window algorithm, the latter was chosen for estimation of surface temperatures with a 30 m spatial resolution corresponding to that of Landsat 8. The estimation of the LST required the OLI bands (4-5) for the estimation of the Earth's surface emissivity (LSE) by the FCV "Fractional Cover Vegetation". The chosen algorithm combines the brightness temperatures of bands 10 and 11 with the LSE. The Single-Channel algorithm will be applied to the Landsat TM6 band 5 and 7 to estimate the LST per pixel. Our adopted methodological approach is presented in Figure 3. The characteristics of the satellite imageries used for this study are presented in Table 1 whereas the values of thermal constants, coefficients used and emissivity are presented in Tables 2, 3 and 4. The following equations were sequentially applied for the calculation of the main parameters that lead to the estimation of the LST.
| Captures | Number of images | No. of Bands | Used bands | Resolution (m) | Pat/Raw |
|---|---|---|---|---|---|
| TM | 2 | 7 | B3 & B4 & B6 | 30 (B1-B7) 120 (B6) | 202/037 |
| ETM+ | 1 | 8 | B3 & B4 & B6H | 30 (B1-B7) 60 (B6H) | |
| OLI | 1 | 9 | B4 & B5 | 30 Sauf le panchromatique | |
| TIRS | 2 | B10 & B11 | 100 |
Table 1: Meta-data of satellite images.
| Capture and Bands | K1 | K2 |
|---|---|---|
| TM (B6) | 607,76 | 1260,56 |
| ETM+ (B6) | 666,09 | 1282,71 |
| TIRS (B10) | 774,89 | 1321,08 |
| TIRS (B11) | 480,89 | 1201,14 |
Table 2: Value of thermal constants K1 and K2.
| Constant | Value |
|---|---|
| C0 | -0,268 |
| C1 | 1,378 |
| C2 | 0,183 |
| C3 | 54,300 |
| C4 | -2,238 |
| C5 | -129,200 |
| C6 | 16,400 |
Table 3: Value of the co-efficients used in the SW algorithm.
| Emissivity | Band 10 | Band 11 |
|---|---|---|
| ξS | 0,971 | 0,977 |
| ξV | 0,987 | 0,989 |
Table 4: Emissivity value.

Figure 3: Applied methodological approach for the determination of Brenne surface temperatures.
Calculation of the spectral radiance
The spectral radiance estimates for the LANDSAT 5 and LANDSAT 7 satellites was calculated using the following transformation equation:
 (1)
(1)
With: L6: Spectral Radiance in watts/(m2 × srad × μm), Lmax: Maximal Spectral Radiance of the chosen band, Lmin: Minimal Spectral Radiance of the chosen band, CNmax = Qcalmax – Qcalmin = Difference of the max and min value of the digital count, Another transformation equation applied to the image of the TIRS sensor to calculate the TOA spectral (Top of Atmosphere).
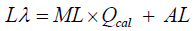 (2)
(2)
With: Lλ: Top of Atmospheric Radiance in watts/ (m2 × srad × μm), ML: Multiplicative renormalization factor of the specified band (Radiance_mult_band_10/11), Qcal: band 10/ 11 image, AL: Additive renormalization factor of the specified band (radiance_add_ band_10/11).
Calculation of brightness temperature (BT)
From the radiance, the brightness temperature (TB) is calculated using the following formula:
TBi = K2 / Ln(1+ (K1/ Lλ )) (3)
With TBi: Brightness temperature (i=11 i=10 i=6), K1 and K2: calibration constant (Table 2), Lλ: Layer of spectral radiance.
Estimation of emissivity
The calculation of the emissivity is based on the following general equation:
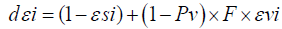
 (4)
(4)
With: LES (εi): Emissivity of the chosen band (i=11, i=10, i=6), εvi and εsi: Emissivities of vegetation and land (Table 4), Pv: Vegetation proportion (Equation 5), Dεi : For a flat surface.
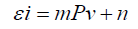
 (5)
(5)
Where: NDVImin and NDVImax are obtained from the statistics of the concerned study area. For dεi which includes the effects linked to the geometric distribution of heterogeneous natural surfaces, a good approximation is provided by Sobrino et al.
 (6)
(6)
By combining equations (1) and (3) the surface emissivity (LES) can be obtained by:
 (7)
(7)
 (8)
(8)
and  (9)
(9)
F is the form factor obtained by assuming an average of the values of different geometric distributions; it is theoretically between 0 and 1. The adopted value is 0.55.
Average and difference between ε10 et ε11 of LANDSAT 8
Average : ε =ε10 +ε11/ 2 (10)
Difference : Δε =10 −ε11 (11)
Surface temperatures of LANDSAT 5 and LANDSAT 7
The LST will be calculated for the LANDSAT 5 TM and LANDSAT 7 ETM + images, using a single band (thermal B6) through the brightness temperature correction equation by introducing the properties of the real objects and emissivity.
LST = TB6 /1+ ( λ ×TB6 / p) ln LSE6 (12)
With: λ: The wavelength of the emitted radiation (11.5 μm), ρ: constant 1,439 × 102, TB: Brightness Temperature
Surface temperature of LANDSAT 8
Finally, for the LANDSAT 8 OLI and TIRS data, the double -Windows algorithm was used (Equation 11) allowing the combination of the TBs obtained for the TIRS sensor bands 10 and 11, and also the emissivity extracted from the red and near infrared bands of the OLI sensor.
 (13)
(13)
With: TB10 et TB11 Brightness temperatures of bands 10 and 11, C0-C9: Split-Window coefficient values (Table 3), ε: Average LES, Δε: Difference de LES, W: Atmospheric content of water vapor (g.cm-2) = 0.013 [Source: Meteorological Observatory of Dept. of Agricultural Meteorological, Ranchi Agricultural College, Birsa Agricultural University, Ranchi].
Results and Discussion
The treatment of the four satellite images and the calculation of surface temperatures made it possible to map temperatures at the Brennoise region scale and to measure the degree of influence of the water bodies on the local climate. The high density of ponds in the area is not without consequence on local temperatures at least around the water bodies. The comparative analysis of the temperatures measured with the help of the MeteoFrance stations and with our own stations only show very small differences which hardly exceed the temperature, which gives the results coming from treatment of the satellite images a high degree of reliability. This treatment has shown an upward trend of this parameter throughout the region with very clear contrasts both in time and space. In fact, relatively mild temperatures in 1987 are rising over the last thirty years, thus marking a gradual but felt warming throughout the region (Figure 4).

Figure 4: Maps of estimated surface temperatures from four satellite images 1987, 2002, 2016 and 2018 dates.
Several observations can be made the four satellite imagery based established thermal maps.
• An increasing warming trend over the last forty years (Figure 5). This trend shows relative stability from 2016 where average temperatures exceed 30°C.

Figure 5: Comparative analysis of surface temperatures since 1987.
• A clear thermal difference between the ponds zone, which is characterized by relatively lower temperatures from the surrounding agricultural areas of higher temperatures (Figures 6 and 7).

Figure 6: Thermal profile (2002) above the Gabrière pond.

Figure 7: Localization of thermal profiles and estimation of the influence envelope of the ponds on the ambient temperature.
• Within the park's territory, spatial (thermal) disparities appear; these evolve with distance from water bodies (Figure 8).

Figure 8: Thermal lines within the park's territory where spatial (thermal) disparities appear and evolve with distance from water bodies.
The spatial variability of temperature at the scale of the area shows well the effect of ponds on the local climate which results in a thermal zoning of small extension particularly around the water bodies whose number exceeds 4000 ponds at scale of the of Brenne park. The thermal envelopes around the ponds tend to evolve gradually first temporally then spatially (Figure 9).

Figure 9: Thermal profiles in line with the Gabrière pond.
Comparative analysis with field measurements
The numerous temperature measurements conducted on field at different times of the year have confirmed the presence of an influential climate zone (freshness) with contours and a variable intensity (Figure 10a). For the Grey-Cold-Windy weather, ponds possess a low influence. The latter can only be noticed at the scale of temperature extremes values that remain very moderate within the ponds. Nevertheless, performed measurements for this weather type make it possible to highlighting the role of ponds, (even minimal) in the local climatic variability.

Figure 10a: Interpolation of temperature measurements and its profiles for the Brenne 10/02/2017 (Type of weather: Gray-Cold-Windy).
The weather type Grey-Fresh with fog, shows sufficiently clear net differences between several zones in the Brenne (Figure 10b). This zoning, in terms of temperature is mainly based on the land occupation pattern (zone of ponds, urbanized zones, forests, etc.). Despite noticing the mentioned differences, the Grey-Fresh with fog weather type doesn’t allow the observation or the conclusion of clear trends. Seldom, we can confirm the presence of a clear homogeneousity and sufficiently apparent clear variabilities within the zone of ponds.

Figure 10b: Interpolation of temperature measurements and profiles for the Brenne 16/02/2017 (Soft-Gray with Fog).
The temperature presents a spatial repartition diagram that perfectly matches the geometry of ponds for the Grey-Fresh weather type. Likewise, the highest values are registered outside the ponds and lowest values are found above the ponds. Recorded average values for this weather type are included between 10 ˚C and 16 ˚C. The spatial limit varies in a very balanced fashion on both sides of the concerned ponds (a balanced volume). A spatial limitation remains difficult to determine even if a very clear halo is formed around the two large ponds of Foucault and Thomas and the middle pond of Pifaudière (Figure 10c).

Figure 10c: Interpolation of temperature measurements and its profiles for eddy ponds for the 21/03/2017 (Rainy Cool Gray).
It can be seen that, for the Clear-Mild weather (sunny with light winds), the differences are moderate between the minimum and maximum values and that the spatial evolution shows two large zones. A zone of low values, that towards the three ponds of Foucault, Thomas and Chat and another that concerns the rest of the measurement area. The drawn profiles of South-North orientation further solidify this finding (Figure 10d).

Figure 10d: Interpolation of temperature measurements and its profiles for eddy ponds for the 24/04/2017 (Nice Mild (sunny light wind).
Thus, according to the type of weather, the seasons and the year, these envelopes witness evolving expansions either by widening or decreasing. The temperature differences between the pond areas and the surrounding lands are relatively consistent neighboring sometimes the 4-5°C. These differences reflect the participation of water bodies in the process temperature reduction either through partial energy consumption to evaporate a quantity of stored water or by heat exchanges with the atmosphere. Depending on the size of the water body, the degree of influence is relatively important giving rise to heat envelopes as shown in the Graph 1.

Graph 1: The degree of influence of heat envelops.
Conclusion
Globally and with respect to the concordance of the results obtained by the two approaches (direct by temperature acquisition through measurements of adopted instrumentations and indirect by remote sensing), the Brenne ponds can function as a continuous set with a unified functionality for several zones. With a number that revolves around 4500 ponds, energy exchanges between water and the atmosphere are significant, especially during the summer period; these in turn are translated in the development of a climatic envelope that can at a minimum partially influence the local climate resulting in a micro climate characteristics to these entities whose feeling on humans is proven. The temperature rises recorded over the last forty years have resulted in a strong anchoring of the heat envelopes, at a larger scale one may even talk about a climatic envelope or even a significant extension of these zones therefore raising ponds to a unique degree of consideration under any climatic approach.
Temperatures show a significant increasing trend from 1987 until 2016 in and following 2016 these tend to stabilize or even regress slightly into 2018. Despite their changing trends temperatures have not altered the thermal envelopes induced by the ponds. The use of remote sensing has made it possible to generalize the observation and measure the extent of these events at the regional level. Thus, the region enjoys a particular climatic character attenuated locally by the high density of ponds which are concentrated in the sector of the park.
Acknowledgments
This study was financed by the central region as part of the Dynétangs project and supported by the Brenne Regional Nature Park.
References
- Simonneau A, Chapron E, Courp T, Tachikawa K, Le Roux G, et al. (2012) Archives lacustres de l’évolution du climat et des activités humaines récentes dans les Pyrénées ariégeoises au cours de l’Holocène (étang majeur, vallée du Haut-Vicdessos, Pyrénées, France). Sud-Ouest Eur 1: 101-116.
- Arzel L, Barnett L, Beaurepaire PY, Beltran A, Capdepuy V, et al. (2010) Anthropocène, environnement, sciences.
- Landais A (2016) Reconstruction du climat et de l’environnement des derniers 800 000 ans à partir des carottes de glace–variabilité orbitale et millénaire. Quaternaire. Revue de l'Association française pour l'étude du Quaternaire 27: 197-212.
- Adano WR, Dietz T, Witsenburg K, Zaal F (2012) Climate change, violent conflict and local institutions in Kenya’s drylands. J Peace Res 49: 65-80.
- Petter GN (2012) Whither the weather? Climate change and conflict J Peace Res 49: 3-9
- Hendrix CS, Salehyan I (2012) Climate change, rainfall, and social conflict in Africa. J Peace Res 49: 35-50
- Orlanski I (1975) A rational sub-division of scales for atmospheric processes. B Am Meteorol Soc 1:527-530.
- Pouyaud B, Colombani P (1989) J. Les variations extrêmes du lac Tchad: L'assèchement est-il possible? Ann Geogr 1: 1-23.
- Gascoin S, Renard P (2005) Modélisation du bilan hydrologique de la partie sud de la Mer d'Aral entre 1993 et 2001/Hydrological balance modelling of the southern Aral Sea between 1993 and 2001. Hydrolog Sci J 50
- Derecki JA (1981) Stability effects on Great Lakes evaporation. J Great Lakes Res 7: 357-362.
- Fry LM, Gronewold AD, Fortin V, Buan S, Clites AH, et al. (2014) The great lakes runoff intercomparison project phase 1: Lake Michigan (GRIP-M). J Hydrol 519: 3448-3465.
- Joly D (2004) Ambiances climatiques instantanées. Application à la micro-climatologie du Spitsberg. Norois Environ, aménagemeny, société 1: 43-57.
- Fazzini M, Giuffrida A, Giallatini F, Bisci C (2007) Climatologie des brouillards épais dans la plaine du Po (Italie septentrionnelle, Climat, Tourisme et Environnement. Actes du XVIIIème Colloque de l’AIC, Carthage pp: 246-351.
- Benmecheta A (2016) Estimation de la température de surface a partir de l'imagerie satellitale; validation sur une zone côtière d’Algérie.
- Sobrino JA, Li ZL, Soria G, Jimenez JC (2002) Land surface temperature and emissivity retrieval from remote sensing data. Rec Res Developmnt in Geophy 4: 21 -44.
- Yu X, Guo X, Wu Z (2014) Land surface temperature retrieval from Landsat 8 TIRS-Comparison between radiative transfer equation-based method, split window algorithm and single channel method. Remote Sens-Basel 6: 9829-6852
- Zhou J, Li J, Zhang L, Hu D, Zhan W (2012) Inter-comparison of methods for estimating land surface temperature from a Landsat-5 TM image in an arid region with low water vapour in the atmosphere. Int J Remote Sens 33: 2582-602.
- Valor E, Caselles V (1996) Mapping land surface emissivity from NDVI: Application to European, African, and South American areas. Remote Sens Environ 57: 167-184.
- Van de Griend AA, Owe M (1993) On the relationship between thermal emissivity and the normalized difference vegetation index for natural surfaces. Int J Remote Sens 14: 1119 -1131.
- Sobrino JA, Li ZL, Soria G, Jimenez JC (2002) Land surface temperature and emissivity retrieval from remote sensing data. Rec Res Development in Geophy 4: 21 -44.
- Jiménezâ€Muñoz JC, Sobrino JA (2006) Error sources on the land surface temperature retrieved from thermal infrared single channel remote sensing data. Int J Remote Sens 27: 999-1014
Citation: Nedjai R, Azaroual A, Chlif K, Bensaid A, Al-Sayah M, et al. (2018) Impact of Ponds on Local Climate: A Remote Sensing and GIS Contribution Application to the Ponds of Brenne (France). J Earth Sci Clim Change 9: 503. DOI: 10.4172/2471-8556.1000503
Copyright: © 2018 Nedjai R, et al. This is an open-access article distributed under the terms of the Creative Commons Attribution License, which permits unrestricted use, distribution, and reproduction in any medium, provided the original author and source are credited.
Select your language of interest to view the total content in your interested language
Share This Article
Recommended Journals
Open Access Journals
Article Tools
Article Usage
- Total views: 4478
- [From(publication date): 0-2018 - Dec 19, 2025]
- Breakdown by view type
- HTML page views: 3556
- PDF downloads: 922