Impact of super-critical CO2 on water/oil interfacial tension: A molecular dynamics case study
Received: 01-Mar-2023 / Manuscript No. ogr-23-88865 / Editor assigned: 04-Mar-2023 / PreQC No. ogr-23-88865(PQ) / Reviewed: 18-Mar-2023 / QC No. ogr-23-88865 / Revised: 25-Mar-2023 / Manuscript No. ogr-23-88865(R) / Published Date: 31-Mar-2023
Abstract
CO2 flooding is largely controlled by adsorption and interfacial properties between the injected CO2, oil and formation water. The interfacial tension has an effect on capillary pressure and relative permeability, and thus affects the flow through capillary tubes of porous medium. For tight formations such as the Bakken, the effects of interfacial tension to fluid flow between the formation water and oil is more considerable due to the presence of very small pores (micropores) and capillarity. Previous studies have shown that a decrease in interfacial tension leads to increase in relative permeability.
The water-oil/scCO2 interfacial behavior has been studied using molecular dynamic simulations. The oil model used is representative of the composition of Bakken oil. The simulations were carried out at reservoir pressure and temperature conditions. The interfacial tension at the liquid–vapor interface of all pure hydrocarbons was calculated and compared with experimental data. The interfacial tension between water-methane/CO2 at different pressure and temperature conditions is also studied.
From our results, the molecular models for pure components can accurately predict the density and surface tension for six hydrocarbon systems (C3 – C8). We observe that increasing concentration of scCO2 could help reduce the oil-water interfacial tension (IFT) that will aid the oil phase to move along the nanopores. In addition, methane (gas) exhibits a different interfacial behavior with water as compared to liquid hydrocarbons.
Introduction
Carbon dioxide flooding is an Enhanced Oil Recovery (EOR) method to increase the amount of oil that can be extracted from oil reservoirs, which along with the process of carbon capture can play an important role to reduce greenhouse gas emission [1]. CO2 flooding is largely controlled by adsorption and interfacial properties among CO2, oil, and formation water [2]. A proper understanding of the interfacial behavior is therefore necessary for improving CO2 EOR method [3]. Extensive experimental studies on the effect of interfacial tension on CO2/brine relative permeability shows that a decrease in interfacial tension leads to increase in relative permeability [4]. Due to the low viscosity of CO2, a significant quantity of injected CO2 is trapped in the reservoir rocks by capillary forces [5]. Krevor et al. (2012) further showed in their experimental work that capillary heterogeneity is an important factor influencing the maximum CO2 saturation and less areal sweep efficiency of reservoir fluids [6].
Experimental work on CO2-oil-brine-rock interactions in a water– wet sandstone reservoir indicated that CO2-rich fluid was the main factor causing dissolution and precipitation of rock minerals; feldspar and calcite [7]. Precipitation of kaolinite clays and other solid phases comprising O, Si, Al, Na, and C was also observed. However, the rate of mineral dissolution and precipitation was greatly reduced in areas where the reservoir was oil-wet (Miao Yu, 2016). A significant drop in permeability due to fines migration during CO2 injection in the Pembina Cardium sandstone reservoir has been earlier reported [8].
The interfacial tension (IFT) has an effect on capillary pressure and relative permeability, and thus affects the flow through capillary tubes of porous medium [9]. Moreover, CO2 and oil become completely miscible when the reservoir or injection pressure is above the minimum miscibility pressure (MMP), leading to the reduction of their IFT to zero [10]. Therefore, the IFT of the system of CO2, water, and oil should be determined between the two phases of water and CO2/oil. Laboratory experiments have shown that IFT decreases as the composition of CO2 increases in the mixture [11, 12]. In addition, the interfacial behavior of water-oil has consistently shown changes due to variations in the solubility of CO2 in oil. However, the effect of CO2 on water-oil interface still poses challenges because the interaction mechanisms at the water – CO2/oil interface cannot be fully understood from experiments. So, this work uses molecular dynamics simulation to fully study the interaction mechanism of super critical carbon dioxide, water and oil interfacial phenomena.
Molecular Dynamic (MD) simulations have been widely used to study the interfacial behavior in binary and ternary systems [13]. MD simulations of water/oil interfacial tension using model asphaltenes showed that IFT could be reduced by the surface concentration of asphaltene molecules [14]. Asphaltene molecules assemble from initial nanoaggregates to formation of thin films at the oil-water interface [15]. Kunieda et al. [2012] investigated the oil–fluid interface and found that the aromatic molecules in light oil accumulate at the interface. This accumulation phenomenon at oil–water interface was ascribed to the weak hydrogen bond interaction between water and aromatic hydrocarbons. Special molecular orientation of hydrocarbon molecules at the miscible hydrocarbon-fluid interface was reported [16]. For the CO2–water, interface system, the molecular dynamics studies show that CO2 molecules exhibit hydrophilicity and interact closely with water molecules at the interface [17]. However, there exist limited studies for the ternary water–CO2–oil system, especially the microscopic behavior of CO2 distributing at water-oil interface. Most of the previous simulations use oil as a single component such as hexane, heptane, and octane, which do not represent the bulk oil composition usually produced from the reservoir.
In this work, the main objective is to study the influence of supercritical CO2 (scCO2) on water–oil interface in a typical mixture of Bakken fluid. In addition, the effect of CO2 on the contact angle of water when wetting a kerogen-like surface will be investigated. The results from this work may help better understand the mechanism of scCO2 impact on water–oil interface, which is of great interest in the design of CO2- EOR in tight shale plays.
Methodology
The composition of Bakken oil sample for our simulation is taken from literature [18].The oil composition proposed by Nojabae et al (2016) was used to construct a model for the oil phase in the molecular dynamics simulations. The alkanes are modeled with linear structure, namely n-alkanes. The number of each component (pure hydrocarbon) and their corresponding composition in the oil phase is shown in Table 1.1, and the phase envelope of the fluid sample is also shown in Figure 1.1. The TRAPPE force field in GROMACS was used to determine the interfacial tension between water and oil. To check if the interfacial tension of the water/oil mixture can be accurately calculated by the chosen force field, the interfacial tension between the liquid and vapor phase for pure hydrocarbons in the oil mixture was calculated. Molecules of each pure component are placed in a simulation box and the system is equilibrated in the NVT ensemble, at a temperature of 293K for 4ns. The initial box size is calculated from PACKMOL’s volume guesser utility. The NVT equilibration run is followed by another 4ns NPT run under a pressure of 1 bar. The Ewald summation (PME) was used for electrostatic interactions, and the cut-off distance was set at 1.2 nm. The Modified Velocity rescale thermostat with a stochastic term (Bussi et al., 2007) and Berendsen barostat where used for temperature and pressure coupling respectively. The leapfrog integration method with a time step of 2 fs was implemented, and all bonds were constrained by the SHAKE algorithm. The electrostatic interactions are calculated using the Particle Mesh Ewald (PME) while the van der Waals interactions are represented by 12-6 Lennard-Jones function.

Figure 1.1: Phase envelope of bakken fluid sample.
| Component | Mole fraction |
|---|---|
| C1 | 0.36736 |
| C2 | 0.14885 |
| C3 | 0.09334 |
| C4 | 0.05751 |
| C5-6 | 0.06406 |
| C7-12 | 0.15845 |
| C13-C80 | 0.0733 |
| Sum | 1 |
Table 1.1: The composition of Bakken oil sample used in the simulations.
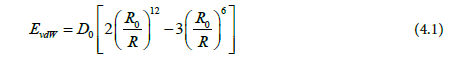
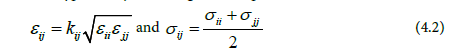
D0 is the depth of potential well, R0 is the Lennard-Jones radius, and R is the distance between two atoms. Modified Lorentz–Berthelot combining rules [19] were used for the well depth D0 and the size parameter σ to describe non-bonded LJ interactions between sites of different type i and j according to the expressions:
After the NPT run, the box was then extended along the direction to add the vapor phase, equilibrated for another 4ns followed by NVT MD simulation for 5 ns.
For the interface model, we first created separate simulation boxes for the oil phase and the water phase with each having a dimension of 5nm by 5nm by 5nm. Energy minimization is carried out in both boxes to reduce the potential energy of the system and to ensure the stability of the system during simulation. For the box containing the oil phase, pressure and temperature are applied using the isobaric-isothermal ensemble (NPT) simulation [20]. The isobaric-isothermal-isointerface area ensemble (NPnAT) simulation is used to create a steady surface area for the water cell into the have the same dimension with the oil phase in the X and Y directions [21]. The SPE/E (single point charge extended) water model was used for water [22]. Lastly, the interface system was made by combining the two cells and performed in NPnAT ensemble simulation. For the NPnAT ensemble, the pressure on only one direction is controlled, and the box length on that direction (i.e. z in this case) is changed. The area, which is tangential to the controlled pressure, is fixed during MD simulation. Temperature was coupled in the system using the velocity rescale thermostat, and pressure using the Parrinello-Rahman barostat. All Equilibration steps, both for NVT, NPT, NPnAT was ran for 8 ns and a production run for 10ns in the NPnAT ensemble using the GROMACS molecular dynamics simulation package. The workflow given in Figure 1.2 shows the steps to create an interfacial system. The results are much more accurate when the interface is set on the plane of fixed areas like in our simulation case.

Figure 1.2: Workflow of modeling oil-water interface.
Figure 1.3 shows our initial oil-water interface and oil- CO2 –water interface respectively. The same procedures were done when placing CO2 molecules into the oil cell and calculating the water-oil+CO2 interface system.
As depicted in Fig 1.3, there is a constant interfacial area between water and oil at all times in the simulation. Addition of supercritical CO2 into the water-oil mixture causes changes in the interfacial region due to its miscibility in the oil and changes in the oil/water IFT. (Figure 1.3b and 1.3c). Since IFT is an equilibrium property the system was equilibrated for 5ns after the addition of scCO2 followed by a 10 ns production run.

Figure 1.3: Initial model for oil-water interface and oil-water- CO2 interface, brown color (oil), blue color (water) and green color (scCO2).
The interfacial tension can be calculated based on our molecular dynamic simulation results (Lopez-Lemus et al., 2008)

where n is the axis normal to the interface, and hence Pnn and Ptt are normal and tangential components respectively of the pressure tensor P. Note that in the simulation the Z-axis is normal to the interface, and therefore the interfacial tension can be calculated by averaging the instantaneous interfacial tension

over the simulation time given [23]. The simulation was run for 10 ns so that the pressure tensors can converge in order to get a correct average of the interfacial tension.

Generally, in MD simulations, the instantaneous pressure, Pi (i=x, y, z), for each direction can be expressed [24]:
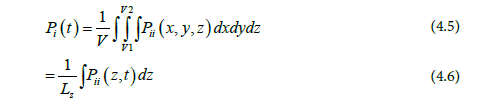
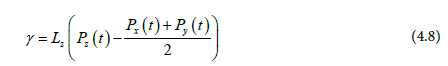
Where Lz is the box length in the Z-direction, which is perpendicular to the interface. Eq 3 can be written as:
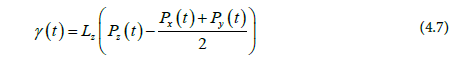
Finding the average interfacial tension over the simulation run gives:
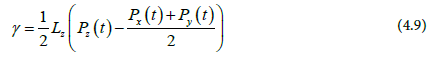
Since our system, have two interfaces, Eq 6. is divided by 2;
To validate our bulk oil model, IFT simulations for pure hydrocarbons and water were also carried out. Methane-water, hexane-water, heptane-water and octane-water IFT measurements at standard conditions were all simulated and as seen in Figure 1.5, they are exceptionally in good agreement with experimental results [25]. These pure hydrocarbons were selected to validate our simulation method because their experimental results are available. Furthermore, the densities of water and hydrocarbons were properly simulated. Figure 1.4 shows the partial densities of heptane and water across the z-direction of the simulation box. The densities of the methyl group (CH2) and ethyl group (CH3) in heptane are also included in Figure 1.4. From Figure 1.4, the density of water is 1000kg/m3 and for heptane 684 kg/m³ which directly agrees with the experimental density of water and heptane at standard conditions. These results show that oilwater interfacial system can be effectively studied through molecular dynamics simulations.

Figure 1.4: Heptane-water interfacial tension; densities from simulation (heptane and water) matches density of water and heptane derived from experiments.

Figure 1.5: Interfacial tension as a function of hydrocarbon number at 76.730F and 14.7 psi for both experimental and molecular simulation.
Results and Discussion
The results in Table 1.2 give the agreement between our results and other experimental studies. Figure 1.6 shows our simulation surface tension and density values for liquid-vapor interface of propane, butane, pentane, hexane, heptane, and octane. Comparing with experimental results from literature, it shows the force field used in this study can correctly calculate interfacial tension between water and oil.

Figure 1.6: Densities of pure hydrocarbon from simulation at 680F and 14.7 psi a) Propane b) Butane c) Pentane d) Hexane e) Heptane f) Octane.
Component |
? (mN/m)- simulation | Error | ? (mN/m) – Experimenta,c |
|---|---|---|---|
| Propane | 9.85 | 0.302 | 10.1 |
| Butane | 13.3 | 0.23 | 12.46 |
| Pentane | 16.02 | 0.1 | 15.82 |
| Hexane | 18.41 | 0.12 | 18.43 |
| Heptane | 20.25 | 0.07 | 20.14 |
| Octane | 21.57 | 0.05 | 21.62 |
a* surface-tension. c* Froba et al, 2003
Table 1.2: Interfacial tension between liquid and vapor phases of pure hydrocarbons at 680F and 14.7 psi.
Figure 1.7 shows how the increase in the concentration of CO2 decreases the oil-water interfacial tension. It is also clear that interfacial tension Table 1.3 generally increases with pressure increase at the reservoir temperature 220 °F. Interfacial tension for oil-water is as high as 44.25 mN/m at 6800 psi, which will then reduce to 40mN/m at pressures around 2000psi. It has also been proven experimentally that interfacial tension of oil-water increases with pressure increase [26]. As reported by Makimura et al. (2013), IFT decreases with increase in temperatures and reservoir pressures for hydrocarbons in the gaseous phase, such as methane and ethane.

Figure 1.7: Interfacial tension as a function of pressure and CO2 concentration. The blue line shows oil-water interfacial tension, which takes a positive linear slope with pressure. The red line shows oil/water and 16.6 mol % of CO2. The green line represents oil-water and 29.6 mol % of CO2; there is significant IFT reduction as pressure decreases.
Component |
Density (kg/m3)- simulation | Error | ? (kg/m3) – Experimentb |
|---|---|---|---|
| Propane | 502.4 | 0.19 | 498 |
| Butane | 579.2 | 0.019 | 579 |
| Pentane | 627 | 0.045 | 626 |
| Hexane | 659 | 0.035 | 659.4 |
| Heptane | 684.1 | 0.048 | 683.7 |
| Octane | 705 | 0.059 | 703 |
b* engineering toolbox/ density/ alkanes
Table 1.3: Interfacial tension between liquid and vapor phases of pure hydrocarbons at 680F and 14.7 psi.
Furthermore, the injection of CO2 into oil reduces the interfacial tension because of the miscibility of CO2 in its supercritical state in both the oil phase and the water phase [27]. An addition of 0.166 mole fraction of CO2 has minimal effect on IFT reduction, but an increase in CO2 concentration to 0.30 mole fraction can significantly reduce the oil-water IFT from 44.5 mN/m to 35mN/m. From Figure 1.3 most of the CO2 molecules move to the oil-water interface. We consider the accumulation of CO2 molecules at the interface as being driven by the IFT differences between water-oil and CO2-water. The interface produces an excess free energy, which is compensated by adsorbing CO2. Once this occurs, the excess free energy per area decreases, reducing the IFT as γ = (dG/dA) T, P
The interfacial region increases as the CO2 mole fraction increases which implies that deeper molecular interactions occur at the coexistent region of water and oil. Looking at the trend of interfacial tension reduction, it is linear due to differences in the molar concentrations of hydrocarbons in the oil. This accumulation phenomenon at the oil-water interface is similar to results showing asphaltene molecules assembling from nano-aggregation to thin-film formation at the oilwater interface [27]; enhanced accumulation of scCO2 at the interface as CO2 mole fraction increases, leading to a reduction in IFT.
Interfacial tension of methane and water was also calculated using molecular dynamics simulation at different pressures and at two temperatures (76 °F and 220°F). Methane–water interfacial behavior is in an inverse relationship to that of oil-water because the solubility of methane in water increases as pressure and temperature increases. As shown in Figure 1.8a, the interfacial tension decreases as the pressure increases at 76 °F. Further decrease in the interfacial tension from 72.4 mN/m to 44.28mN/m is observed as the concentration of CO2 increases to 40mol percent. At a higher temperature, 220°F as depicted in Figure 1.8b, even more reduction in interfacial tension can be observed. For pure methane-water, interfacial tension reduces from 59mN/m to about 47.5 mN/m at 220°F, as compared to a decrease from 72.3 mN/m to 52.4 mN/m at 76 °F. With the increase in the concentration of CO2 to up to 40mol percent, the interfacial tension reduces to 35.85 mN/m.

Figure 1.8a: Methane-water interfacial tension as a function of pressure at T=760F.
References
- Xing W, Y S (2013) Research progress of the interfacial tension in supercritical CO2-water/oil system. Energy Procedia 6928-6935.
- Shah A, R F (2010) A review of novel techniques for heavy oil and bitumen extraction and upgrading. Energy & Environmental Science 700.
- Dai Z, R M R (2013) An integrated framework for optimizing CO2 sequestration and enhanced oil recovery. Environmental Science & Technology Letters 49-54.
- Bennion DB, B S (2005) Relative permeability characteristics for supercritical CO2 displacing water in a variety of potential sequestration zones. SPE Annual technical conference and exhibition. Dallas, TX: SPE.
- Pentland CH, E M R (2011) Measurements of the capillary trapping of supercritical carbon dioxide in berea sandstone. Geophysics Res Lett.
- Krevor SCM, P R (2012) Relative permeability and trapping of CO2 and water in sandstone rocks at resevoir conditions. Water Resource 48:W02532.
- Miao Yu, L L ( 2016) Experimental identification of CO-oil-brine-rock interactions: Implications for CO sequestration after termination of a CO-EOR project. Applied Geochemistry 137-151.
- Sayegh SG, K F (1990) Rock/Fluid Interactions of Carbonated Brines in a Sandstone Reservoir: Pembina Cardium, Alberta, Canada. SPE Formation Evaluation.
- Zhao L, L S (2015) Molecular dynamics characterizations of the supercritical CO2 -mediated hexane-brine interface. Industrial & Engineering Chemistry Research 2489-2496.
- Nagarajan N, R L (1986) Equilibrium phase compositions, phase densities and interfacial tensions for carbon dioxide + hydrocarbon systems. Journal of Chemical and Engineering Data 168-171.
- Yang D, P T (2005) Interfacial tensions of the crude oil + reservoir brine+CO2 systems at pressure upto 31 MPa and temperatures of 270C and 580C. Chemical and Engineering Data 1242-1249.
- Daoyong Yang, P T (2005) Interfacial Tensions of the Crude Oil + Reservoir Brine + CO2 Systems at Pressures up to 31 MPa and Temperatures of 27 0C and 580C. Journal of Chemical Engineering Data 1242-1249.
- Yannick Agbor, U A (2020) Structural Elucidation of Aqueous Methane Solutions Based on Pair. Journal of Chemical Science and Chemical Engineering.
- Cuiying J, M R (2016) Reduction of Water/Oil Interfacial Tension by Model Asphaltenes: The Governing Role of Surface Concentration. Journal of Physical Chemistry B 5646-5654.
- Mikami Y, L Y (2013) Molecular dynamics simulations of asphaltenes at the oil-water interface: from nanoaggregation to thin-film formation. Energy & Fuels 1838-1845.
- Carpenter IL, W H (1989). A Molecular dynamics study of the hexane/water interface. The Jouranl of Physical Chemistry, 531-536.
- L S de Lara, M F (2012) Molecular Dynamics study of fluid/oil interfaces for improved oil recovery processes, the Journal of Physical Chemistry B 11. The Journal of Physical Chemistry B 14667-14676.
- Nojabaei B (2012). Effect of Capillary Pressure on Fluid Density and Phase Behavior in Tight Pore Rocks and Shales. SPE Annual Technical Conference and Exhibition. 159258). San Antonio: Texas.
- Smith FT (1972) Atomic distortion and the combining rule for repulsive potentials. Phys 5: 1708-1713
- Dill K A, Bromberg S, Stigter D (2003) Molecular Driving Forces. New York: Garland Science.
- Zhang, S F (1995) Computer-simulation of liquid/liquid interfaces .1. theory and application to octane/water. Journal of Chemical Physics 103:10252-10266.
- Berendsen HJC, Grigera JR, Straatsma TP (1987) The missing term in effective pair potentials. J Phys Chem 91: 6269-6271.
- Lopez-Lemus J, G A (2008) E?ect of ?exibility on surface tension and coexisting densities of water. Journal of Chemical Physics 0021-9606.
- Berkowitz, S S (2001) Computer simulation study of the interface width of the liquid/liquid interface. Physical Review Letters 0031-9007.
- Lunkenheimer, A G (1997) Interfacial tension of the water/nalkane interface. Langmuir 0743-7463.
- Makimura D, M K (2013) Application of Molecular Simulations to CO2-Enhanced OIl Recovery. Phase Equilibria and Interfacial Phenomena SPE Journal.
- Mikami Y, Y F, Matsuoka T E S (2013) Molecular Dynamics simulations of asphaltenes at the oil-water interface: from nanoaggregation to thin-film formation. Energy and Fuels 1838-1845.
Indexed at, Google Scholar, Crossref
Indexed at, Google Scholar, Crossref
Indexed at, Google Scholar, Crossref
Indexed at, Google Scholar, Crossref
Indexed at, Google Scholar, Crossref
Indexed at, Google Scholar, Crossref
Indexed at, Google Scholar, Crossref
Indexed at, Google Scholar, Crossref
Indexed at, Google Scholar, Crossref
Indexed at, Google Scholar, Crossref
Indexed at, Google Scholar, Crossref
Indexed at, Google Scholar, Crossref
Indexed at, Google Scholar, Crossref
Indexed at, Google Scholar, Crossref
Indexed at, Google Scholar, Crossref
Indexed at, Google Scholar, Crossref
Indexed at, Google Scholar, Crossref
Indexed at, Google Scholar, Crossref
Indexed at, Google Scholar, Crossref
Indexed at, Google Scholar, Crossref
Citation: Agbor Y, Yolo B (2023) Impact of super-critical CO2 on water/oil interfacial tension: A molecular dynamics case study. Oil Gas Res 9: 294.
Copyright: © 2023 Agbor Y. This is an open-access article distributed under the terms of the Creative Commons Attribution License, which permits unrestricted use, distribution, and reproduction in any medium, provided the original author and source are credited.
Select your language of interest to view the total content in your interested language
Share This Article
Recommended Journals
Open Access Journals
Article Usage
- Total views: 4766
- [From(publication date): 0-2023 - Dec 21, 2025]
- Breakdown by view type
- HTML page views: 4337
- PDF downloads: 429