Impacts of Climate Variability and Households Adaptation Strategies in Lare District of Gambella Region, South Western Ethiopia
Received: 29-May-2018 / Accepted Date: 10-Jul-2018 / Published Date: 14-Jul-2018 DOI: 10.4172/2157-7617.1000480
Keywords: Climate change; Adaptations; Vulnerability to climate; Gambella; Lare District; Southwestern Ethiopia
Introduction
Background and Justification
Rising fossil fuel burning and land use changes have emitted, and are continuing to emit, increasing quantities of greenhouse gases into the Earth’s atmosphere. This increase in heat has led to the greenhouse effect, resulting in climate change and variability. The main characteristics of climate change are increases in average global temperature (global warming); changes in cloud cover and precipitation particularly over land; melting of ice caps and glaciers and reduced snow cover; and increases in ocean temperatures and ocean acidity due to seawater absorbing heat and carbon dioxide from the atmosphere. Evidence increasingly suggests that high climate variability has significant impacts on rural households particularly in sub-Saharan Africa. The impacts of climate change phenomena are progressively emerging as an unprecedented global challenge to development in general and poverty reduction in particular especially among millions of rural people living in marginal regions with minimal livelihood options. Numerous studies have shown that as variability in climatic elements increases, the vulnerability of rural livelihoods and the ability of smallholder households to deal with its shocks and stresses increases. This is particularly so among rural households who often suffer immense social and economic effects due to effects of climatic condition. Indeed, in the past two decades, the effects of climate variability on crops and livestock are increasingly blamed for deteriorating livelihoods among most rural areas [1].
The impacts of climate variability on agricultural sector negatively affect both crops and livestock production systems. Given the overdependence on rain-fed agriculture by the majority of people living in rural areas, climate change and variability has been limiting agriculture production and thus resulting in food insecurity and low-income generation [2,3] underlines that increased temperature and more critical drought conditions would likely erode the natural capital (resource) base of sustainable pastoralism which will be manifested though scarcity of pasture and water resources. This resource scarcity, it is argued, in addition to massive pastoral poverty, is considered to trigger severe resource competition and violent conflicts among pastoralist communities. According to Birch [4] and Wassie [5], traditional pastoralism typically represents a resilient and unique system of adaptations in a dynamic process of unpredictable climatic variability and continuous human interactions with the natural environment in dryland ecosystems.
Adaptation measures were paramount to inform future actions to ameliorate impacts of climate change and variability; this seems to have elicited little interest from researchers going by the number of available literatures on climate change awareness [6,7]. In addition, the link between climate variability and household livelihood responses are largely unexamined yet improving resilience of communities and households to effects of climate change impacts requires understanding of local practices [8]. There is also increasing recognition that the traditional global study on climate change has fail to address the local impacts and local abilities to adapt to climate change effects with assertion that while climate change is a global phenomenon, adaptation is site-specific issues that require site specific knowledge and experiences. Furthermore, it was recognized that it’s not easy to predict household climate variability impacts and adaptation strategies at international level due to minimal standard definitions, absence or difficulty to get benchmark data. Therefore, a strong imperative to understand the actual dynamics of climate change and variability impact and adaptations at the lowest levels of the society, such as households, communities and districts were suggested.
Climatic variability is already affecting many natural systems around the world. Increases in temperature, change in precipitation patterns, widespread melting of snow and ice, and rising global average sea level are a common phenomenon. Some climate change is now inevitable and there is increasing evidence that it is already happening. With early, sustained and concerted global action to reduce greenhouse gas (GHG) emissions can limit the changes both to climate, and to the natural systems that maintain climate. Failure to significantly reduce emissions may fundamentally alter the Earth’s climate system and commit future generations to more dangerous changes and variability [6].
In the last three decades, the study area faced with frequent climatic variability and agro-ecological change. The average annual temperature of study district was relatively low than the current annual temperature. These trends increase in alarming rate from time to time synergic with the current climatic change. These changes brought about low production and productivity in economy and social aspect of community. These urge that there will be a need for further investigations to harmonize live with the climate change impact by assessing different environment friendly adaptation strategies [6]. So far there was limited study particularly undertaken on the same problem and in the same area.
The people leaving in the study area are mostly agro-pastoralist and they are the one who are mostly susceptible to the impacts of climate variability. This research has tried to identify current impacts, vulnerability condition and adaptation strategies of households in study area. It has tried to fill the existing knowledge gap and has come up with adaptation strategies communities in the study area are using, in order to adjust themselves to the impacts of climate variability. To this end, the main purpose of this study was to assess the impacts of climate variability and household adaptation strategy in study area. The problem has attracted the interest of the researcher because of high variability of the system that has been affecting the community leaving there. That was why the researchers were highly initiated in this problem. Thus, the main objective of this study is to assess impacts of climate variability and household’s adaptation strategies in Lare district. Specifically intend to investigate the impacts of climate variability in study area, assess vulnerability status of households to the impacts of climate variability and identify adaptation strategies of households to impacts of climate variability.
Research Methodology and Design
The study area
Gambella is one of the nine regional states that constitute the Federal Democratic Republic of Ethiopia. It is located in the western tip of the country and has common borders with Sudan in the West, South and North, the Regional state of the SNNP in the south and East, with The Regional state of Oromia in the North and East. Gambella is lying between the Baro and Akobo rivers. It has an area of 25,802.01 square km. In 2007, the Regional state has a total population of 306,916. Its capital city is Gambella Town (CSA, 2009). Lare is one of the districts in the Gambella Region of Ethiopia and it is part of the Nuer Zone. It is bordered on the south and east by the Anuak Zone, on the west by the Baro River which separates it from Jikawo, and on the north by the Jikawo River which separates it from South Sudan. Towns in Lare include Kowerneng. The terrain in Lare consists of marshes and grasslands; elevations range from 300 to 400 meters above sea level. A notable landmark is Gambela National Park, which occupies part of the area south of the Baro.
The climate of the Region is formed under the influence of the tropical monsoon from the Indian Ocean, which are characterized with high rainfall in the wet period from May to October and has little rainfall during the dry period from November to April. The mean annual temperature of the Region varies from 17.3 to 28.3 degree Celsius and annual monthly temperature varies throughout the year from 27 to 33 degrees Celsius. The annual rainfall of the Region in the lower altitudes varies from 900-1,500 mm. At higher altitudes it ranges from 1,900-2,100 mm. The annual evapo-transpiration in the Gambella reaches about 1,612 mm and the maximum value occurs in March and is about 212 mm. The region endowed with a vast marginal land which is suitable for agriculture and other economic activities. The existing land cover (vegetation) types of the region are identified as cultivated land, forest land, wood land, bush land, shrub land, grass land, bamboo, wet (marsh land), etc. [6].
Research design and methods
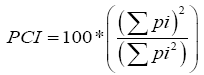
For this study mixed concurrent triangulation research design were applied to assess impacts of climate variability and households’ adaptation strategies. Three kebeles (Teluth, Nibnib and kengnipout) were selected purposely for the study. The data for the study were generated from both primary and secondary sources. To analyze data descriptive statistics, general linear model univariate analysis and multiple regression model were used. The climatic data obtained from National Meteorological Agency were analyzed carefully (i.e., Analysis of trends, patterns and distribution of rainfall and temperature). Precipitation Concentration Index (PCI) and Rainfall coefficient (pluviometric coefficient) was used to estimate the monthly heterogeneity of rainfall.
Results and Discussion
The impacts of climate variability
Evidences of gradual rise in air temperature and consequent global warming: Variability in both time and space is an inherent feature of climate, as the atmosphere is always in state of turmoil and instability leading to variations in weather and climatic conditions. According to IPCC, global averaged land and ocean temperature trend show a warming of 0.85 (0.65 to 1.06) Cover the period 1880 to 2012. Temperatures in 2015 were about 1°C above the preindustrial era, according to a consolidated analysis from the World Meteorological Organization (WMO). In the study area, almost all respondents have responded that increase of temperature (97%), warming of water (92%), seasonal flooding (90%), spreading of tropical diseases (e.g. malaria) (96%), change in precipitation patterns (89%) and shifting of seasonal weather phenomena (88%) were the main evidence of impacts of climate variability.
A closer look at the above evidences, can confirm that there is high variability in elements of climate. The result of discussion with group of elders, women and herds men at Nibnib, Teluth and kengnypout areas of Lare districts has confirmed this Figure 1. Here the main focus of discussion is whether the area is affected by the climate variability impacts and the evidence they observed. Many of them has witnessed that, there is impacts of climate variability and the evidence for this are extreme temperature, livestock death, seasonal flooding as a result of filling of Baro river and high intensity rainfall, outbreak of malaria and other tropical diseases. Similar studies by Mary [2] also showed that local people perceived changes in rainfall and temperature. At the global level, some attempts have been made to overcome the impacts of climate change and variability.
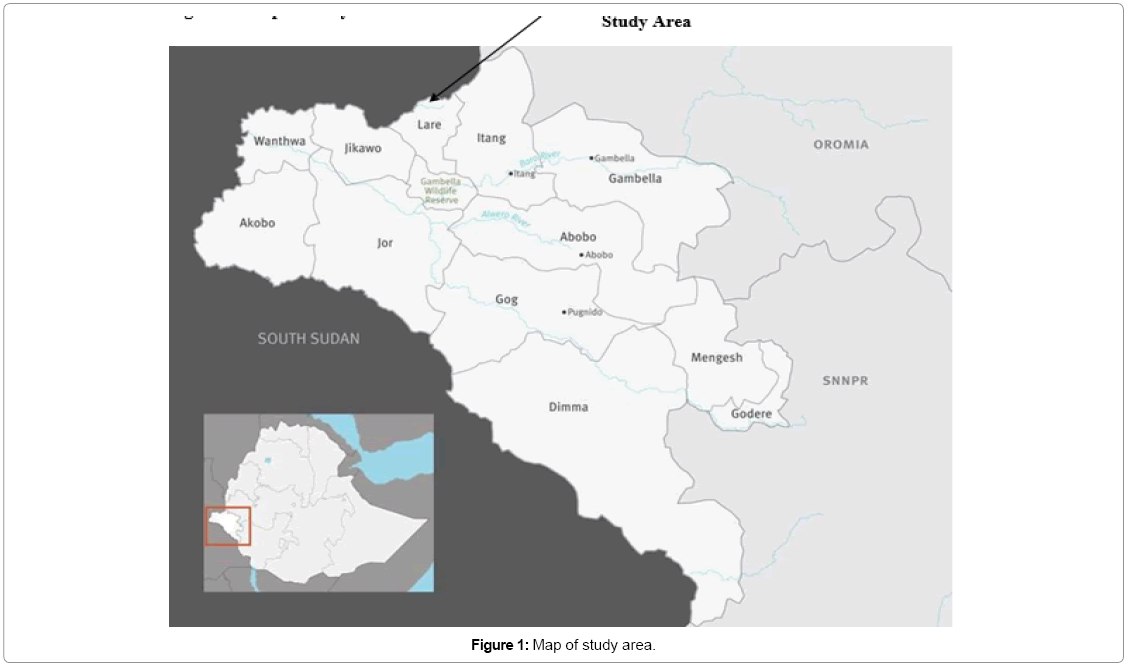
Figure 1: Map of study area.
The Paris Agreement for instance, adopted in December 2015 by the 21st Conference of the Parties (COP 21) of the United Nations Framework Convention on Climate Change (UNFCCC), aims to maintain the increase in global temperatures well below 2 degrees Celsius above pre-industrial levels. In addition, they make efforts to limit it to 1.5 degrees taking into account the best available science, equity, sustainable development, the need to ensure food security and the availability of means of implementation, by ensuring deep reductions in global greenhouse gas [net] emissions. Furthermore, outcome of COP 22 in Marrakech the parties adopted 35 decisions, mostly related to the implementation of the Paris Agreement. The decisions set 2018 as the deadline for developing a rulebook for the implementation of the Agreement, based on transparency and accountability. Herein under, general linear model shows how evidence of climate variability are affected by different variables explanatory variables Table 1.
| Source | Type III Sum of Squares | df | Mean Square | F | Sig. |
|---|---|---|---|---|---|
| Corrected Model | 3.030a | 72 | 0.042 | 5.382 | 0 |
| Intercept | 26.369 | 1 | 26.369 | 3372.151 | 0 |
| DecRF | 0.038 | 4 | 0.009 | 1.201 | 0.314 |
| DecSmosture | 0.064 | 4 | 0.016 | 2.036 | .094*** |
| Ecodamag | 0.199 | 4 | 0.05 | 6.36 | .000* |
| DecAdoAP | 0.033 | 4 | 0.008 | 1.049 | 0.385 |
| DecBioP | 0.092 | 4 | 0.023 | 2.954 | .023** |
| IncSurTemp | 0.024 | 4 | 0.006 | 0.762 | 0.552 |
| IncAtpre | 0.065 | 4 | 0.016 | 2.093 | 0.086 |
| DecLivPro | 0.143 | 4 | 0.036 | 4.559 | .002* |
| IncriskLivmort | 0.061 | 4 | 0.015 | 1.944 | 0.108 |
| IncFdroght | 0.024 | 4 | 0.006 | 0.756 | 0.556 |
| FudinseLiv | 0.024 | 4 | 0.006 | 0.766 | 0.55 |
| DecCropYild | 0.044 | 4 | 0.011 | 1.402 | 0.238 |
| ClmaHelth | 0.049 | 4 | 0.012 | 1.552 | 0.192 |
| IncForcSale | 0.127 | 4 | 0.032 | 4.068 | .004* |
| Outmigra | 0.15 | 4 | 0.038 | 4.807 | .001* |
| DeponfudRem | 0.01 | 4 | 0.003 | 0.323 | 0.862 |
| usustExpNRM | 0.067 | 4 | 0.017 | 2.127 | .082*** |
| PorNutrition | 0.041 | 4 | 0.01 | 1.295 | 0.276 |
| Error | 0.884 | 113 | 0.008 | ||
| Total | 198 | 186 | |||
| a. R Squared = | 0.774 (Adjusted | R Squared = .6 | 30 |
Table 1: General linear model univariate analysis: Tests of between-subjects effects.
The result of general linear model univariate analysis shows the seven variables are significantly influence climate variability in study area. In this model 77.4% of variance in evidence of climate variability is explained by explanatory variables. With dependent variable of evidences of climate variability, ecosystem damage (0.000), decline in livestock productivity (0.002), increased likelihood of forced sale of productive assets and indebtedness (0.004), and out migration of able bodied adults in search of off-farm employment (0.001) were pretty much significantly influences climate variability at 1% and decline in biological productivity (0.023) is related with the impacts of climate variability at 5% significant level. Whereas, unsustainable exploitation of natural resources and decreasing of soil moisture contents are significant at 10% significant level.
Temperature variability: Temperature of the study area is highly variable as the area fall under arid, Semi-arid and humid conditions [6]. The Figure 1 above, depicts average max temperature data for over 30 years from 1982-2011. The recorded average maximum temperature in study area ranges from 32.6°C to 35.5°C. Lowest maximum average temperature has occurred in 1999 which is 32.6°C and while highest maximum average temperature has occurred during 1982 and 2007 which is both 35.5°C. Therefore, the difference between average maximum and average minimum temperature is 2.9°C. From 2009 to 2011 the average maximum temperature of study area has reached 35.01°C, 35.1°C and 35.4°C respectively. The lowest maximum temperature from 1982- 2011 is 28.12°C and has occurred in August 2007 and the highest maximum temperature from 1982-2011 is 41.3°C and has occurred March 1999. When we compare the other three stations with Laree, Gambelia has the highest maximum temperature of 41.18°C in February 2011, I tang has the highest maximum temperature of 40.38°C in April 2010 and Jikawo has the highest maximum temperature of 40.79°C in April 2010. Averagely Lare has the highest maximum temperature of all and 1999 is the hottest year all in study area.
The above Figure 2 depicts the average minimum monthly temperature of study area. According to the Figure 1, average lowest minimum monthly temperature from January to December which occurred from 1982 to 2011 is 19.26°C while highest minimum monthly temperature is 21.9°C. Average mean annual monthly minimum temperature is 20.3°C. On the basis of this Figure 1 the highest minimum monthly temperature has occurred in April (21.9°C) and the lowest minimum monthly temperature has occurred in December (19.269°C). In addition, Figure 3 below shows sample spectral distribution function and sample spectral density function of average maximum temperature at Lare district.
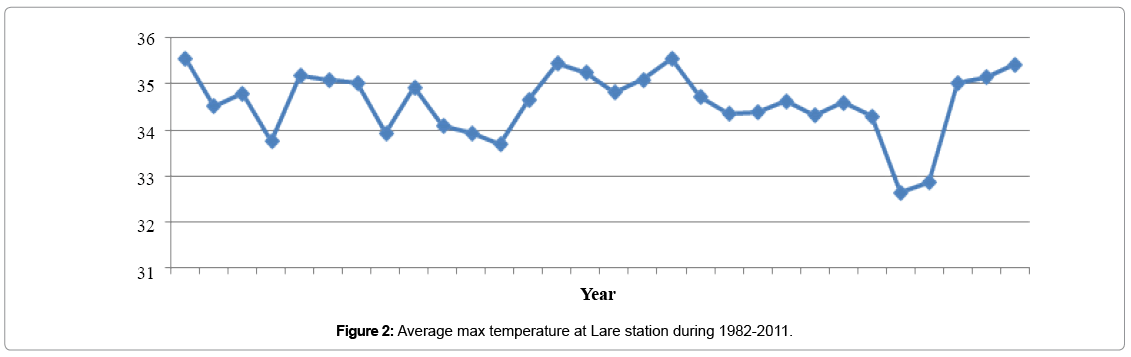
Figure 2: Average max temperature at Lare station during 1982-2011.
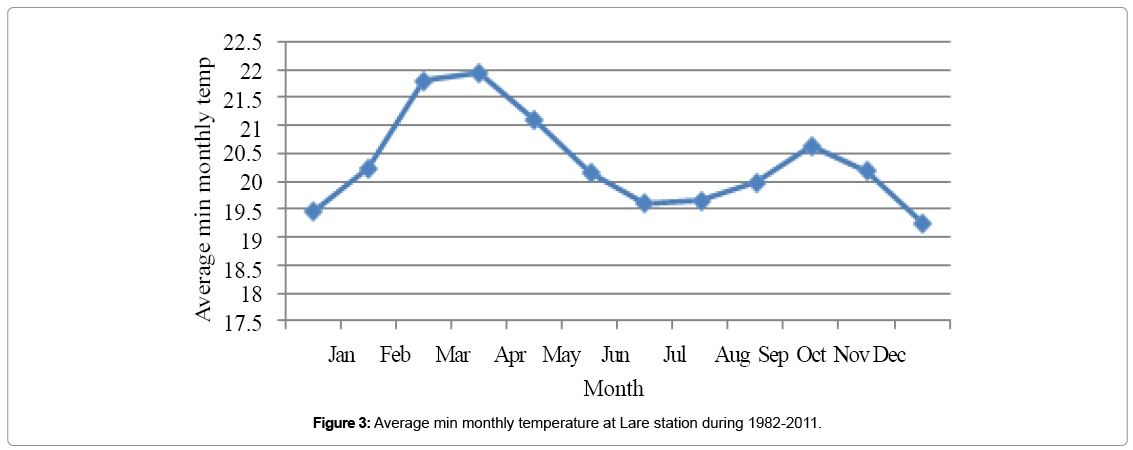
Figure 3: Average min monthly temperature at Lare station during 1982-2011.
A time series is a sequence of data points measured at successive time intervals. It can be measured by periodogram. The periodogram gives information about the relative strengths of the various frequencies for explaining the variation in the time series. As it can be seen from above periodogram, in spectral distribution function, the sense that the value at time ‘t’ is not correlated with a value at any other time. Hence, the spectrum is flat. The spectral density is a frequency domain representation of a time series that is directly related to the auto covariance time domain representation. In the following paragraph, we have compared average minimum monthly temperatures between four stations of Gambella region.
The Figure 4 below compare the lare average minimum monthly temperature of 1982 to 2011 with average minimum monthly temp at Jikawo, Itang and Gambella station. These stations are selected because of their proximity to the study area. For instance, at Jikawo station the lowest minimum monthly temperature from 1982 to 2011 is 19.26°C which has occurred in months of December, while highest minimum monthly temperature is 21.5°C and this has occurred in month of April. Additionally, at Gambella station the lowest minimum monthly temperature is 18.76°C which has occurred in months of August and highest minimum monthly temperature is 21.3°C and has occurred in March. Finally, when we see temperature of Itang station the lowest minimum monthly temperature is 18.36°C which has occurred in January and highest minimum monthly temperature is 21.13°C and has occurred in April. Therefore, on the basis of these Figure 5 Lare has highest lowest minimum temperature which is 19.269°C.
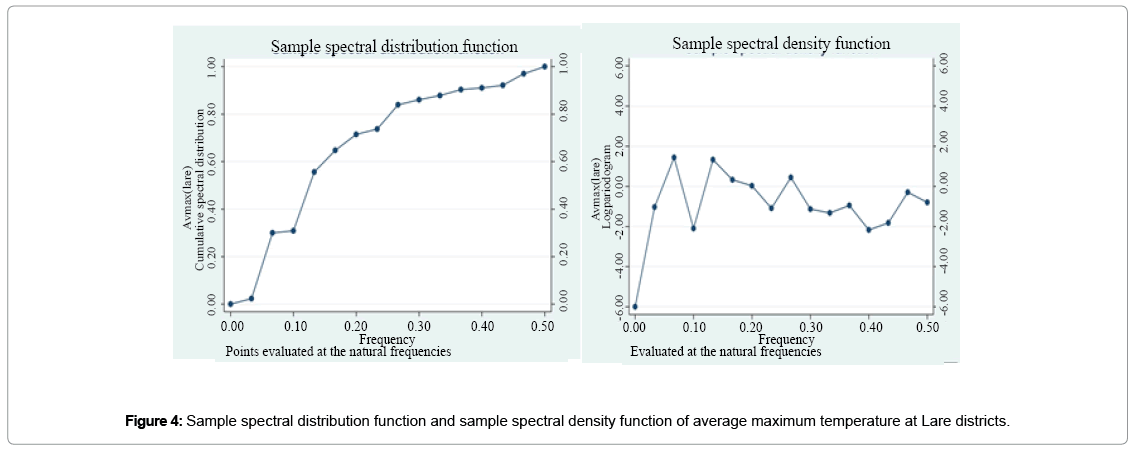
Figure 4: Sample spectral distribution function and sample spectral density function of average maximum temperature at Lare districts.
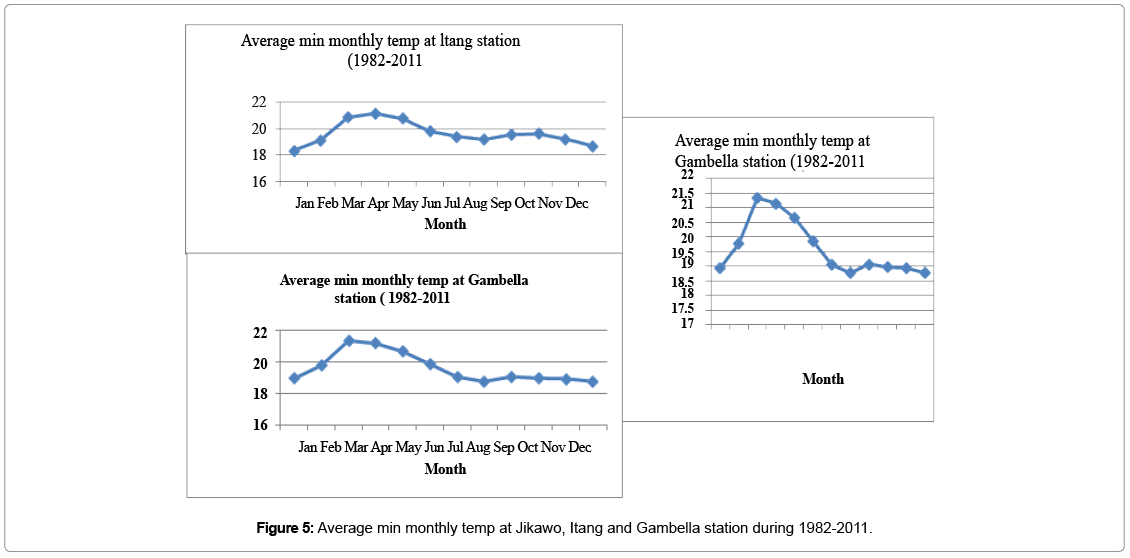
Figure 5: Average min monthly temp at Jikawo, Itang and Gambella station during 1982-2011.
Rainfall variability: The Figure 6 below reveals the mean average monthly rainfall of four station of Gambella region. The data shows mean average monthly rainfall for over 32 years from 1983 to 2014. According this data, the smallest mean average monthly rainfall at the study area is 59 mm. This amount has occurred in 2002. This indicates that year 2002 has got minimum amount of rainfall that affected productivity. In correspondence, largest mean average monthly rainfall is 146.25 mm and has occurred in 2008. Again, when we compare the rainfall of the other three surrounding stations, Gambella has smallest and largest mean average monthly rainfall of 87.75 mm and 149.4 mm respectively, Itang has smallest and largest mean average monthly rainfall of 70.58 mm and 145.5 mm respectively and Jikawo has smallest and largest mean average monthly rainfall of 70.66 mm and 141.83 mm respectively.
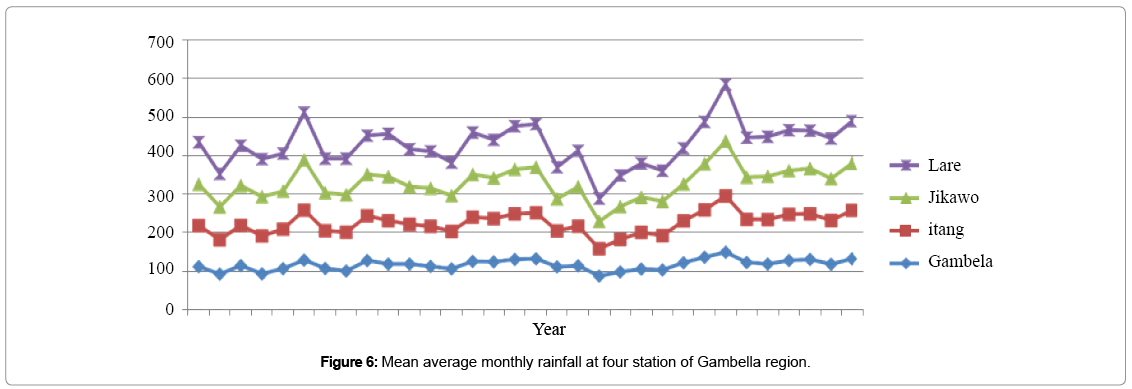
Figure 6: Mean average monthly rainfall at four station of Gambella region.
Therefore, largest highest mean average monthly rainfall is highest in Gambella followed by Laree, while Laree has lowest smallest mean average monthly rainfall of all. Below is mean average monthly rainfall of Lare station Figure 7. Mean belg, kiremt, Bega and annual RF at four stations are presented in Figure 8 below.
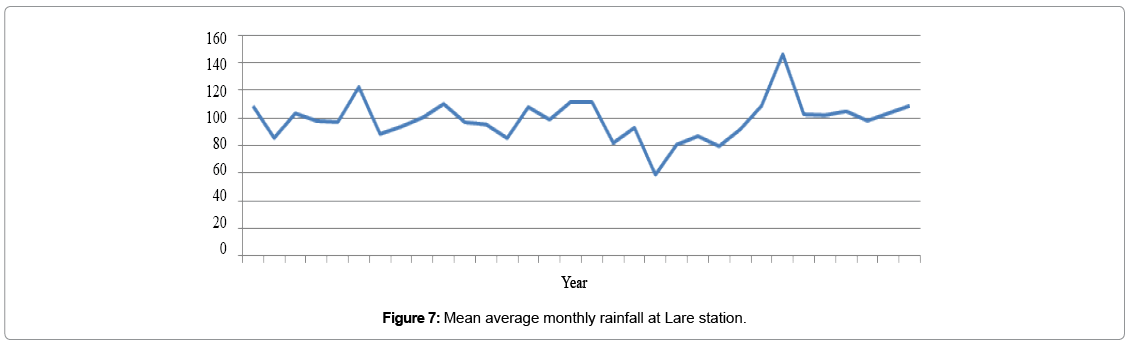
Figure 7: Mean average monthly rainfall at Lare station.
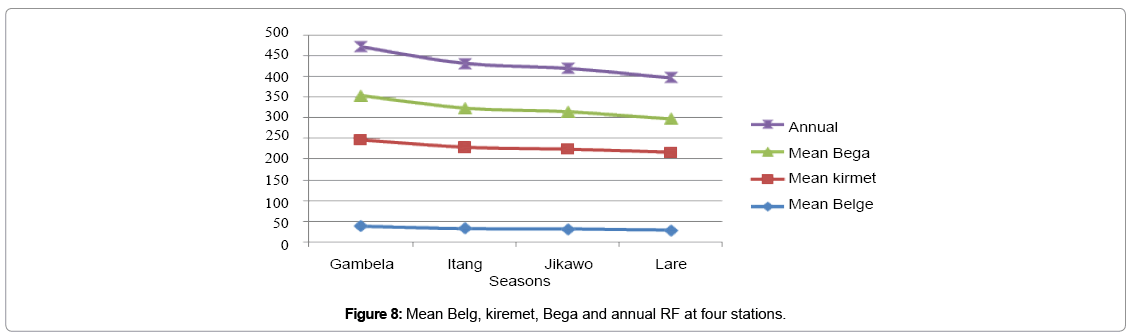
Figure 8: Mean Belg, kiremet, Bega and annual RF at four stations.
The above Figure 8 depicts mean Belg, mean Bega, mean kiremet and annual rainfall of the four stations of Gambella region. Belg includes February, March, April and May. Kiremet includes June, July, August and September, while Bega includes October, November, December and January. Mean Belg rainfall at Lare station is 26.125 mm, while mean kiremet and mean Bega rainfall are 187.58 mm and 80.25 mm respectively. In addition, mean annual rainfall is 98.98 mm. When we compare mean annual rainfall of the other three stations with Lare station, Gambella has mean annual rainfall of 117.76 mm while Itang and Jikawo has 107.8 mm and 107.7 mm respectively. From the four stations, Lare has lowest mean annual rainfall. Herein under, mean monthly rainfall of four stations are presented.
The above Figure 9 depicts mean monthly rainfall at the four stations of Gambella region. Is study area (Lare) the minimum mean monthly rainfall recorded is 5.53 mm which has occurred in February and maximum mean monthly rainfall is 211.6 mm and has occurred in July. On the other hand, Gambella has minimum mean monthly rainfall of 8.13 mm which has occurred in February and maximum mean monthly rainfall is 218.17 mm and has occurred in August. Likewise, Itang has minimum and maximum mean monthly rainfall of 6.06 mm in February and 214.2 mm in July respectively. Whereas, Jikawo has minimum and maximum mean monthly rainfall of 6.06 mm in February and 212.76 mm in August respectively. Compared to the others Lare has lowest maximum and minimum mean temperature. This condition exacerbates the variability of rainfall in study. Analysis of discussions with FGD also confirms that there is the highest variability in elements of weather and climate like rainfall and temperature. Figure 10 depicts mean monthly rainfall of Lare station, while Table 2, shows PCI and pluviometric coefficient for Lare Woreda from to see the distributions and irregularity of rainfall in study area.
| months | Long-term mean monthly rainfall in mm (Pi) |
Pi2 | Rainfall coefficient (pluviometric coefficient) |
|---|---|---|---|
| January | 0 | 0 | 0 |
| February | 0 | 0 | 0 |
| March | 2 | 4 | 0.02 |
| April | 18 | 324 | 0.18 |
| May | 56 | 3136 | 0.56 |
| June | 104 | 10816 | 1.04 |
| July | 108 | 11664 | 1.08 |
| August | 139 | 19321 | 1.39 |
| September | 15 | 225 | 0.15 |
| October | 40 | 1600 | 0.40 |
| November | 7 | 49 | 0.07 |
| December | 0 | 0 | 0 |
 |
|||
 |
|||
| = 47139 | |||
 |
|||
 |
|||
 |
|||
 |
|||
| PCI = 19.71 | |||
| PCI = 100*0.1971 |
Table 2: Computation of PCI and pluviometric coefficient for Lare district from during 1983-2014.
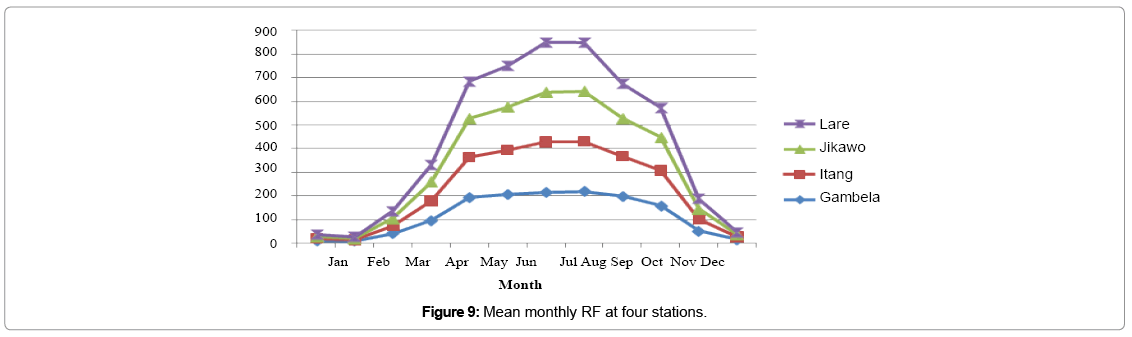
Figure 9: Mean monthly RF at four stations.
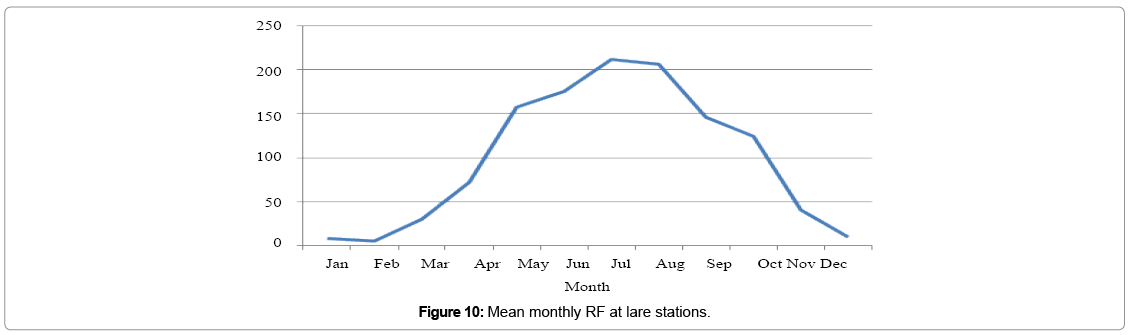
Figure 10: Mean monthly RF at lare stations.
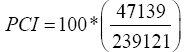
The above table depicts the computation of PCI and pluviometric coefficient for Lare Woreda from (1983- 2014). As it has been shown above the precipitation concentration index (PCI) of Lare Woreda from 1983- 2914 is 19.71. According to Oliver [9] (i) PCI < 10 indicates uniform precipitation distribution (low precipitation concentration), (ii) PCI >11 and <15 indicates moderate precipitation concentration; (iii) PCI >16 and < 20 indicates irregular distribution, and (iv) PCI > 20 indicates a strong irregularity (i.e., high precipitation concentration). Therefore, on the basis of this, Lare Woreda has irregular precipitation distribution. This result is somehow found in similar range with the study by Birhanu [10] in Misrak Badawacho Woreda, SNNPR, which have PCI of 17.296.
Furthermore, according to Monkhouse and Wilkinson 1971, Birhanu [10] using pluviometric coefficient signifies values between 0.6 and 1 show low concentration, values 1 to 2 indicate medium concentration while values 2 to 3 show high concentration and the value greater than 3 represents very high concentration of attribute. Pluviometric coefficient calculates any month at a given weather station the ratio of the monthly normal precipitation to one-twelfth of the annual normal precipitation. Thus, on the basis of this January, February, March, April, May, September, October, November and December has very low concentration of rainfall. On the other hand, June, July and August has medium concentration of rainfall. Therefore, we can understand from this computation of PCI and pluviometric coefficient that, there is high rainfall variability [11-13].
Impacts and extent of climate variability
The researchers have tried to ask the respondents about the evidences and impacts of climate variability in study area. According to the study by Halkano and James [1] among the Gadamoji Agro-Pastoralists of Marsabit County, Kenya, knowledge of people’s perceptions is paramount to inform future actions to ameliorate impacts of climate changes. In the study area 97.8% of the community perceived that there is evidence for the impacts of climate variability. In support with this figure discussion with elders, women and local leaders of the three kebeles has confirmed that, there is usually flooding, high temperature, incidence of tropical disease like malaria. So, these are the globally agreed evidence and impacts of climate variability. In support to this 99.5% of them again confirmed that high variability in the system is affecting them. Halkano and James [1] showed that local people are aware of rainfall and temperature variability and its impacts on their livelihood [14-18].
Extent of impact of climate variability: Study area experience high impacts of climate variability and change. On the basis of this study, 22% of respondents confirmed that there is a very high decrease in precipitation pattern, 44.1% and 2.7% of them confirmed that there is high and very low decrease in rainfall respectively. Again 8.1% of respondent’s states there is a very high increase in surface temperature, while 34.9% of them stated it as high, 41.9% of them confirmed that, increase in surface temperature is medium and only 5.4% of them responded there is very low increase in surface temperature of study area. Therefore, decrease in precipitation (rainfall) (22%) have very high extents of impacts followed by dependency on food relief and remittances (14.5%) and decreased crop yields and shorten the growing season (14%). In correspondence with this, decrease in precipitation (rainfall) (44.1%), decrease in soil moisture content (38.7%), ecosystem damage (35.5%) and increasing of surface temperature (34.9%) have the highest impacts in study area. Analysis of discussion with community at large supports this idea. Perceptions of respondents on the other impacts of climate variability can be seen from Table 3 below.
| Impacts of climate variability | Extent of impact of CV (No =186) Percentage (%) |
||||
|---|---|---|---|---|---|
| Very high |
High | Medium | Low | Very low |
|
| Decrease in precipitation (rainfall) | 22.0 | 44.1 | 24.7 | 6.5 | 2.7 |
| Decrease in soil moisture content | 12.9 | 38.7 | 37.1 | 8.6 | 2.7 |
| Ecosystem damage | 7.5 | 35.5 | 34.9 | 16.7 | 5.4 |
| Decrease adaptation of animal, plants, insects and humans |
7.5 | 31.2 | 42.5 | 15.6 | 3.2 |
| Decrease biological productivity and plant cover | 4.3 | 28.5 | 45.2 | 17.2 | 4.8 |
| Increasing of surface temperature | 8.1 | 34.9 | 41.9 | 9.7 | 5.4 |
| Increase in atmospheric pressure | 8.6 | 26.3 | 41.4 | 15.1 | 8.6 |
| Decrease in livestock productivity | 10.8 | 25.8 | 39.2 | 18.3 | 5.9 |
| Increased risk of livestock mortality | 11.3 | 29.6 | 31.7 | 16.7 | 10.8 |
| Increased frequency of drought | 12.4 | 24.2 | 37.6 | 17.7 | 8.1 |
| Food insecurity and loss of livelihoods | 8.1 | 31.7 | 35.5 | 18.8 | 18.8 |
| Depressed crop yields and shorten the growing season |
14.0 | 23.7 | 33.9 | 22.6 | 5.9 |
| Climate related health effect | 12.4 | 23.1 | 43.0 | 15.1 | 6.5 |
| Increased likelihood of forced sale of productive assets and indebtedness |
9.7 | 23.7 | 37.6 | 19.9 | 9.1 |
| Out-migration of able bodied adults in search of off- farm employment |
11.3 | 24.2 | 38.2 | 17.2 | 9.1 |
| Dependency on food relief and remittances | 14.5 | 26.9 | 34.4 | 14.5 | 9.7 |
| Unsustainable exploitation of natural resources | 8.6 | 25.3 | 39.2 | 19.4 | 7.5 |
| Poor nutrition, low income and poverty | 11.3 | 21.5 | 31.7 | 24.7 | 10.8 |
Table 3: Perceptions of respondents on the extent of impacts of climate variability.
Vulnerability to the impacts of climate variability
Almost all of the respondents (95%) have responded study area is vulnerable to the impacts of climate variability. Vulnerability can vary by place and people [19-23]. According to people who live on arid or semiarid lands, in low-lying coastal areas, in water limited or flood-prone areas, or on small islands are particularly vulnerable to climate change and variability. Discussion with key informants and FGD confirmed that, study area is found in lowland and flood prone area and rainfall variability and temperature is very extreme. These factors make the area most vulnerable to the impacts of climate variability. Vulnerability to the impacts of climate variability can be seen as biophysical and social vulnerability. Herein under Table 4 depicts the results of multiple regression on vulnerability.
| Indicators | Biophysical vulnerability (No =186) Percentage (%) | ||||
|---|---|---|---|---|---|
| Very high | High | Medium | Low | Very low | |
| Soil erosion | 20.4 | 38.7 | 18.8 | 21.5 | .5 |
| Decline in water quality | 16.7 | 37.6 | 27.4 | 17.2 | 1.1 |
| Flooding | 10.8 | 40.5 | 29.8 | 16.7 | 2.2 |
| Salinization | 7.0 | 24.7 | 45.2 | 15.1 | 8.1 |
| Biodiversity loss | 8.1 | 15.6 | 48.4 | 20.4 | 7.5 |
| Rangeland degradation | 6.5 | 23.7 | 45.7 | 18.8 | 5.4 |
| Erratic rainfall | 9.1 | 21.0 | 44.1 | 20.4 | 5.4 |
| Prolonged drought | 4.8 | 25.8 | 41.4 | 20.4 | 7.5 |
| Deforestation | 7.0 | 21.0 | 39.8 | 20.4 | 11.8 |
| Desertification | 7.0 | 24.7 | 32.8 | 17.2 | 18.3 |
Table 4: The degree of biophysical vulnerability to the impacts of climate variability.
In the above model p-value is 0.0000. This indicates the reliability of independent variables to predict dependent variable. As it can be seen from the model there is statistically significant relationship between dependent and explanatory variables. In this model 73% of variance in vulnerability is explained by explanatory variables. At the 95% of significance five variables significantly explains the vulnerability in climate system. These are flooding (0.000), erratic rainfall (0.043), low calorie intake (0.000), high mobility (0.054) and dependency on climate sensitive sector (0.012). Flooding and low-calorie intake provides very significant evidence against vulnerability of community to the impacts of climate variability. Particularity those people who live nearby Barro river are highly vulnerable because of flooding. Flooding may occur whenever there is rainfall of high intensity. In addition, community perceived there is low calorie intake because of lack of adequate food which leads may households to relief aid. This statistical significance is supported by view of discussion with community. Vulnerability of the community to impacts of climate variability is also highly determined by dependency on climate sensitive sector. For instance, community in study area are partly agro-pastoralist and livestock sector are highly vulnerable to the impacts of climate variability. In correspondence, vulnerability of study area is determined by occurrence of erratic and unreliable rainfall. It is a result of this unreliability that leads to flooding of coastal areas of Barro river and other areas as high intensity rainfall occurs. Finally, there is high mobility of pastoralist sector. Particularly mobile pastoralist community are high vulnerable to the impacts of climate variability.
Biophysical vulnerability: The respondents were asked the degree of biophysical vulnerability to the impacts of climate variability in the study area. As it can be seen from Table 5 below, perception of community on the degree of biophysical vulnerability shows that, there is high flooding (40.5%), soil erosion (38.7%), decline in water quality (37.6%), and prolonged drought (25.8%). The discussion with community members agreed the same issues. Therefore, one can understand there is very high vulnerability of natural resource of the area. Particularly soil and water resources are impaired as a result of climate variability in the area.
| Indicators | Social vulnerability (No =186) Percentage (%) |
||||
|---|---|---|---|---|---|
| Very high | High | Medium | low | Very low | |
| High health problem | 18.3 | 51.6 | 17.2 | 10.2 | 2.2 |
| Incidence of malaria | 16.1 | 48.9 | 30.6 | 3.2 | 1.1 |
| Respiratory disease | 12.4 | 36.0 | 41.9 | 6.5 | 3.2 |
| Low calorie intake | 17.2 | 29.6 | 37.6 | 12.4 | 3.2 |
| Resilience to severe storm | 7.5 | 23.7 | 52.2 | 10.8 | 5.4 |
| Resilience to flooding hazard | 10.8 | 26.9 | 43.5 | 15.1 | 3.8 |
| Decline of indigenous institution | 14.5 | 25.3 | 38.7 | 13.4 | 8.1 |
| Resource conflict | 7.0 | 33.3 | 38.7 | 12.4 | 8.6 |
| High mobility | 10.2 | 28.5 | 39.8 | 11.8 | 9.7 |
| Dependency on climate sensitive sector | 8.1 | 22.6 | 37.1 | 18.3 | 14.0 |
Table 5: The degree of social vulnerability to the impacts of climate variability.
Social vulnerability: It is clear that climate has affected, affecting and will affects many parts of the world. If society are persistently disturbing the climatic system and elements, climate will continue to influence different sectors negatively. Vulnerability to the impacts of climate variability varies by region, people and place of living. In line with this, social vulnerability includes health, resilience of community to different climatic hazards and etc. In study area community has confirmed that there is a high health problem (51.6%) which includes high incidence of malaria (48.9%) and respiratory disease (36%). Furthermore, the area is again vulnerable to the low-calorie intake (29.6%), high mobility (28.5%) and resilience to flooding hazards (26.9%) [24].
Adaptation practices of households to climate variability
According to IPCC in 2007, adaptive capacity is “the ability of a system to adjust to climate change (including climate variability and extremes) to moderate potential damages, to take advantage of opportunities, or to cope with the consequences.” In the study area 29.6% of the respondents confirmed they have very high adaptive capacity. This means that this portion of the community have high ability to cope with the impacts of climate variability. 38.2% of respondents again witnessed that, they have high adaptive capacity, and are able to react or cope swiftly and easily to the effects of climate variability and are again less vulnerable and more resilient. Whereas again 24.7% and 7.5% of respondent’s wittiness they have medium and low adaptive capacity respectively. Especially those communities found in flood prone areas nearby Barro River and poor households are highly vulnerable to the impacts of climate variability and less able to cope with adverse impacts.
A can be seen from Table 6, below the study found the adaptation mechanisms for which respondents have very great extent of adaptation are Low return activity participation (Fuel wood selling) (15.1%), Plant Early Maturing and Drought Tolerant Seeds (14.5%) and Diversify Herd Composition (14%). This means only few of them participated in these adaptation mechanisms. This due to lack of awareness and majority of those who sale fuel woods are highlanders and practice of planting early maturing species are also not well known in the area as many of them are pastoralist and agro-pastoralist. To deal with the adverse shock of climate variability 50.5% of respondents plant early maturing and drought tolerant seeds, followed by those who depend on low return activity participation (Casual labor) (33.3%) and sale milk or crop produces (32.8%). The extent of adaptation to most respondents is medium. For instance, a good proportion of households (48.9%) have an adoption of drought-tolerant livestock species example goats. Majority of them (48.4%) adjust Planting time. This is because during the onset of rainfall there is high flooding as the result of high intensity rainfall, planting is undertaken some weeks later after seasonal flooding. To refrain from engulfment of Baro River which cause seasonal flooding, community relay growing season so that, they can cultivate after flooding. Moreover, parts of the households practice soil conservation measures (46.8%) and engage in non-farm activities (45.2%). Soil conservation measures are as the part of government plan for integrated watershed management. 40.9% of households’ relay on food aid, remittances and other external supports. This is particularly very common is the study area during the time of natural and other calamities.
| Adaptation strategies | Extent of adaptation by households (N=186) Percentages (%) |
||||
|---|---|---|---|---|---|
| Very great extent |
Great extent |
Moderate extent |
Low extent |
No adaptation |
|
| Plant Early Maturing and Drought Tolerant Seeds | 14.5 | 50.5 | 26.9 | 3.8 | 4.3 |
| Change Crop Type | 13.4 | 32.8 | 43.5 | 5.4 | 4.8 |
| Adjust Planting Time | 4.3 | 26.9 | 48.4 | 16.1 | 4.3 |
| Reduce Farm Size | 4.3 | 29.6 | 45.2 | 16.1 | 4.8 |
| Practice Soil Conservation Measures | 7.5 | 19.9 | 46.8 | 23.1 | 2.7 |
| Diversify Crops Type Planted | 9.1 | 18.8 | 46.8 | 21.5 | 3.8 |
| Diversify Herd Composition | 14.0 | 18.8 | 43.5 | 18.3 | 5.4 |
| Herd Splitting and Migration | 7.0 | 22.6 | 41.4 | 21.5 | 7.5 |
| Increased mobility (distance & frequency) | 8.1 | 25.8 | 36.0 | 22.6 | 7.5 |
| Increased adoption of drought-tolerant livestock species | 3.8 | 25.8 | 48.9 | 13.4 | 8.1 |
| Slaughter Young and Old Animals | 8.6 | 21.0 | 35.5 | 27.4 | 7.5 |
| Reduce Herd Number (Destocking) | 11.3 | 23.1 | 35.5 | 21.0 | 9.1 |
| Supplement Livestock Feeds | 8.6 | 21.5 | 41.4 | 16.7 | 11.8 |
| Fodder Preservation e.g. enclosure | 11.3 | 18.3 | 36.0 | 24.2 | 9.7 |
| Sale Livestock | 8.6 | 25.8 | 30.6 | 26.9 | 7.5 |
| Conversion of livestock capital into physical capital | 6.5 | 19.4 | 35.5 | 30.1 | 8.6 |
| Banking livestock assets (bank saving) | 5.9 | 20.4 | 32.8 | 21.5 | 19.4 |
| Petty trade/business | 5.4 | 21.0 | 28.5 | 17.7 | 27.4 |
| Low return activity participation (Charcoal making) | 13.4 | 29.6 | 42.5 | 10.2 | 4.3 |
| Low return activity participation (Fuel wood selling) | 15.1 | 25.3 | 37.6 | 17.2 | 4.8 |
| Low return activity participation (Casual labor) | 7.5 | 33.3 | 32.8 | 21.0 | 5.4 |
| Partial shift to other livelihoods | 7.5 | 22.6 | 43.0 | 19.9 | 7.0 |
| Engage in Non-Farm Activities | 8.1 | 16.7 | 45.2 | 15.6 | 14.5 |
| Reliance on Food Aid, remittances and other Support | 4.8 | 19.9 | 40.9 | 23.7 | 10.8 |
| Roof Rain Water Harvesting | 9.1 | 17.7 | 45.2 | 20.4 | 7.5 |
| Credit from Better-offs and local Institutions | 9.1 | 21.0 | 36.0 | 23.7 | 10.2 |
| Household labour Migration | 8.6 | 22.0 | 39.2 | 18.8 | 11.3 |
| Adopt Pre-Impact Saving | 8.6 | 26.3 | 37.1 | 18.3 | 9.7 |
| Sale Milk or Crop Produces | 7.5 | 32.8 | 38.7 | 14.0 | 7.0 |
| Practice Kitchen Gardening | 8.1 | 20.4 | 31.7 | 19.9 | 19.9 |
Table 6: Adaptation practices of households to impacts of climate variability.
Similar study by Dual in 2013 showed, that Karey pastoralist uses diversification of herds and incomes to adapt to the impacts of climate variability. Dual added for instance, community shifts to drought tolerant livestock species like goat and camels in Karey pastoralist and this was the case for the study are except for camel [25-35].
Conclusion
The result of the study has showed that almost all respondents perceive that there are high variability of climate and this variability in climate have been imposing and would continue to impose negative impacts on the community. The result of general linear model univariate analysis has showed ecosystem damage, decline in biological productivity, decline in livestock productivity, increased likelihood of forced sale of productive assets and indebtedness and out migration able bodied adults in search of off-farm employment are pretty much significant impacts of climate variability in study area.
Furthermore, given PCI of 19.17 Laree have an irregular and uneven rainfall distribution which leads to low concentration of rainfall in some months and medium concentration of rainfall in others. Study area is highly vulnerable to the impacts of climate variability as area is found in lowland and flood prone area and rainfall variability temperature extremes are very high. To react or cope swiftly and easily to the effects of climate variability richest portion of community have high adaptive capacity while those living nearby Barro river and poor household have low adaptive capacity and are highly vulnerable to the impacts of climate variability. The extent of adaptation to most respondents is medium. For instance, a good proportion of households have an adoption of drought-tolerant livestock species example goats, adjusting of planting time, practicing soil conservation measures, engaging in non-farm activities and relaying on food aid, remittances and other external supports are adaptation strategies of households in Laree Woreda.
Recommendations
There are high impacts of climate variability and high biophysical and social vulnerability to impacts of climate variability in study area. Therefore, the following recommendations are made for the future interventions by the researchers.
• Community should gain awareness on climate change and variability so that they can clearly understand its impacts. In correspondence, communities should be sensitized to understand their levels of vulnerability and design sustainable adaptation action plans.
• Climate change and variability issues should be mainstreamed at all levels through working with policy makers, development agencies, research institutions, regional government and the media.
• There should be focused initiative, institutionalized and collaborative framework (e.g. public-private partnership) to strengthen adaptive capacity of households.
• Increase access to climate information, financial services, levels of literacy and improve social infrastructures to build local adaptive capacities in the study area should be improved.
• Regional government and NGOs in the area should make community get access to the experiences of other area which are vulnerable to the impacts of climate variability so that they can learn how to cope more and increase their adaptive capacity
• Adaptation strategies like diversifying of herd composition, reducing of herd number (destocking), fodder preservation (e.g. enclosure), partial shift to other livelihoods, credit from betteroffs and local institutions, adoption of drought-tolerant livestock species example goats, adjusting of planting time, practicing of soil conservation measures and engaging in non-farm activities should be strengthened.
Acknowledgements
First and more most, let immeasurable thanks go to Almighty God for his invaluable gifts, endowed in us skills and ability to handle things, keep us stay in peace and health. Next, we are very much grateful to Gambelia University (GMU) for funding the research. In addition, we have enormously benefited from deep knowledge of Nuer community and our key informants. All of them shared us their knowledge and experiences with patience without the feeling of tiredness. Meticulous discussion with elders and village heads of the Nuer community is really unforgettable. Finally, we would like to extend our appreciation to all of our friends and staffs for their support.
References
- Halkano JB, James KA (2014) Climate variability and response strategies among the Gadamoji agro-pastoralists of Marsabit County. International Journal of Humanities and Social Science 4: 11
- Mary L, Majule AE (2009) Impacts of climate change, variability and adaptation strategies on agriculture in semi-arid areas of Tanzania: Â The case of Manyoni District in Singida Region,Tanzania. Uni of Dar Salaam 3: Â 8.
- Brooks N (2006) Climate change, drought and pastoralism in the Sahel. Discussion notes for the World Initiative on Sustainable Pastoralism.
- Birch I and Grahn R (2007) Pastoralism-managing multiple stressors and the threat of climate variability and change. Occasional Paper 2007/45. Human Development Report Office.
- Wassie B and Fekadu B (2014) The impact of climate change on pastoral production systems: Â A study of climate variability and household adaptation strategies in southern Ethiopian rangelands. UNU- WIDER 13: Â 54
- Hailemariam B, Mulugeta T, Ali J, Galuak K, Riek W, et al. (2011) Action plan of adaptation to climatic change. Gambella p. 30
- Smit B, Burton B, Klein RJT, Wandel J (2000) An anatomy of adaptation to climate change and variability. Climatic Change 45: Â 223-251.
- Oxfam (2008) Survival of the fittest: Â Pastoralism and climate change in East Africa. Oxfam Briefing 116.
- Manickam V, Shanti S, Iyyanki VMK (2013) Analysis of precipitation concentration index and rainfall prediction in various agro-climatic zones of Andhra Pradesh. International Research Journal of Environment Sciences 2: Â 5.
- Birhanu K (2016) Impact of climate variability on food security at rural household level: Â The case of Misrak Badawacho Woreda. SNNPR 7: Â 6
- Batterbury SPJ (2001) Landscapes of diversity: Â A local political ecology of livelihood diversification in southwestern Niger. Ecumene 8: Â 437-464.
- Butt T, McCarl B, Angerer J, Dyke P, Stuth J (2003) Food security implication of climate change in developing countries: Â Findings from a case study in Mali. Department of Agricultural Economics, Texas A&M University.
- Central Statistical Agency (2012) Population projection based on 2007 population and housing census result.
- Creswell JW (2009) Research design: Â Qualitative, quantitative and mixed methods approaches. Sage: Â London, UK.
- Dula W (2013) Adaptation of pastoralists to climate variability: Â The case of the Karrayu pastoralists community in the Upper Awash Valley of Ethiopia. University of Oslo: Â Oslo
- Human Rights Watch (2012) "Waiting here for death": Â Forced displacement and 'villagization' in Ethiopia's Gambella Region. USA
- Intergovernmental Panel on Climate Change (IPCC) (2000) Presentation of Robert Watson, Chair, Intergovernmental Panel on Climate Change, at the Sixth Conference of the Parties to the United Nations Framework Convention on Climate Change, The Hague, 13 November 2000.
- Intergovernmental Panel on Climate Change (IPCC) (2001) Climate Change 2001: Â Impacts, Adaptation Vulnerability. Contribution of Working Group II to the Third Assessment Report of the Intergovernmental Panel on Climate Change. Geneva: Â UNEP/WMO.
- IPCC TAR (2001a) Climate Change 2001: Â Impacts, Adaptation and Vulnerability. IPCC Third Assessment Report, Cambridge University Press.
- IPCC TAR (2001b) Climate Change 2001: Â The scientific basis. IPCC. IPCC Third Assessment Report, Cambridge University Press
- Macchi M (2011) Framework for community-based climate vulnerability and capacity assessment in mountain areas. Kathmandu: Â ICIMOD
- Mendelsohn R, Dinar A, Dalfelt A (2000) Climate change impacts on African agriculture, mimeo, Yale University.
- Mortimore MJ, Adams WM (2001) Farmer adaptation change and ‘crisis’ in the Sahel. Global Environmental Change 11: 49-57
- Nassef M, Anderson S, Hesse C (2009) ‘Pastoralism and Climate Change:  Enabling Adaptive Capacity’, HPG Report, Overseas Development Institute 5: 11-19.
- National Meteorological Agency (2007) Climate Change National Adaptation Programme of Action (NAPA) of Ethiopia. Addis Ababa: Â Ethiopia
- Nori M and Davies J (2007) Change of wind or wind of change? Report on the Conference on Climate Change, Adaptation and Pastoralism, organized by the World Initiative for Sustainable Pastoralism.
- Organisation for Economic Co-operation and Development (2006) Adaptation to climate change: Â Key Terms. Paris: Â France
- Senait R (2010) The rain doesn't come on time anymore: Â Poverty, vulnerability, and climate variability in Ethiopia. Eclipse: Â Addis Ababa.
- UNEP & ICRAF (2006) Climate Change and variability in the Sahel region: Â Impacts and adaptation strategies in the agricultural sector. Nairobi, Kenya.
- United Nations Development Program (2009) Climate change in the African drylands: Â options and opportunities for adaptation and mitigation. One UN Plaza.
- United Nations Framework Convention on Climate Change (2007) Climate Change: Â Impacts, Vulnerabilities and Adaptation in Developing Countries.
- United Nations Framework Convention on Climate Change (2000) Note by the President of COP-6, The Hague.
- Watson RT, Zinyoera MC, Moss RH (1996) Climate Change 1995: Â Impacts, adaptations and mitigation of climate change: Â Scientific-Technical Analysis. Contribution of Working Group II to the Second Assessment Report of the Intergovernmental Panel on Climate Change. Cambridge: Â Cambridge University Press.
- Watson RT, Zinyoera MC, Moss RH (1998) The regional impacts of climate change: Â An assessment of vulnerability. A Special Report of IPCC Working Group II. Cambridge: Â Cambridge University Press.
- Yamane T (1967) Statistics: Â An introductory analysis. (2nd edn), Harper and Row, New York, USA.
Citation: Dika G (2018) Impacts of Climate Variability and Households Adaptation Strategies in Lare District of Gambella Region, South Western Ethiopia. J Earth Sci Clim Change 9:480. DOI: 10.4172/2157-7617.1000480
Copyright: © 2018 Dika G. This is an open-access article distributed under the terms of the Creative Commons Attribution License, which permits unrestricted use, distribution, and reproduction in any medium, provided the original author and source are credited.
Select your language of interest to view the total content in your interested language
Share This Article
Recommended Journals
Open Access Journals
Article Tools
Article Usage
- Total views: 6228
- [From(publication date): 0-2018 - Jun 10, 2025]
- Breakdown by view type
- HTML page views: 5141
- PDF downloads: 1087