Investigation of Various Scenarios of Gas Injection for Enhanced Gas Condensate Recovery: A Case Study
Received: 18-Jun-2022 / Manuscript No. OGR-22-66932 / Editor assigned: 21-Jun-2022 / PreQC No. OGR-22-66932(PQ) / Reviewed: 05-Jul-2022 / QC No. OGR-22-66932 / Revised: 08-Jul-2022 / Manuscript No. OGR-22-66932(R) / Accepted Date: 14-Jul-2022 / Published Date: 15-Jul-2022 DOI: 10.4172/2472-0518.1000249
Abstract
In this paper, the Eclipse 300 commercial simulator was used to perform compositional modeling of gas injection process for enhanced condensate recovery of a real gas condensate well in south of Iran here referred to as SA4.Some experimental data were used to tune the Peng-Robinson equation of state for this case. Different scenarios of gas injection before the dew point pressure, at current reservoir pressure and at abandonment reservoir pressure had been considered with different gas compositions using one and three injection wells. Methane, carbon dioxide,nitrogen and two other gases with specified compositions were considered as potential gases for injection. According to the obtained results, nitrogen leads to highest pressure maintenance in the reservoir but methane results in highest condensate recovery among the selected injection gases. At low injection rates, condensate recovery percent is strongly affected by gas injection rate but this dependency shifts to zero at high injection rates. Condensate recovery is higher in all cases of injection at current reservoir pressure than injection at abandonment pressure. Using a constant injection rate, increasing the production well bottom hole pressure results in increasing the condensate recovery percent and time of gas breakthrough. In high injection rates, using three injection wells is much more efficient than using one.
Keywords: Gas injection; Gas condensate reservoir; Gas Condensate Recovery; Methane; Nitrogen; Carbon dioxide
Keywords
Gas injection; Gas condensate reservoir; Gas Condensate Recovery; Methane; Nitrogen; Carbon dioxide
Introduction
The main characteristic of gas condensate reservoirs is that the reservoir temperature lies between the critical point and the cricondentherm resulting in condensate dropout during the production process. This isothermal condensation as the pressure drops below the dew point pressure of the original fluid is known as retrograde condensation. This phenomenon of condensation is not desired to occur in the reservoir, since it will leave a certain quantity of oil in the reservoir, which is impractical or uneconomic to recover [1]. The recovery of condensate, which contains most of the heavier, valuable components, is at most 30% to 40% of condensate initially in place [2].
Methane injection is the recovery process of choice for gascondensate reservoirs. For economic reasons, however, this process can often not be implemented [3]. Alternative injection gases may be nitrogen and carbon dioxide.
The Sarkhoon gas field, discovered in 1972 by drilling exploration well SA1, is located 20 km away from Bandar-Abbas in south of Iran. A total of 13 wells have been drilled in Sarkhoon structure. Well SA4, which is the main topic of discussion in this study, was drilled in 1976 and started production from the upper layer of Jahrum gas-condensate reservoir in Sarkhoon gas field.
Table 1
| Reservoir Pressure (psia) | 4448.7 |
| Reservoir Temperature (°F) | 228 |
| Dew Point Pressure (psia) | 4773 (at 228 °F) |
| Perforation Depth (ft) | 9630-9810 |
| Static Well Head Pressure (psia) | 3799.7 |
| Following Well Head Pressure (psia) | 3624.7 |
| Total Compressibility (1/psia) | 1.17E-04 |
| Reservoir Lithology | Limestone |
| Thickness of Layer (ft) | 614 |
| Porosity | 0.0444 |
| Absolute Permeability (md) | 1.3 |
| Irreducible Water Saturation | 0.25 |
| Well Drainage Radius (ft) | 4500 |
| Well Bore Radius (ft) | 0.5 |
| Skin | 0 |
Table 1:SA4 well properties and sampling information.
shows the properties and sampling information of upper layer of Jahrum reservoir (well SA4). Initial composition of the gas condensate well under consideration is shown in Table 2.
Component |
Initial composition |
|---|---|
| Nitrogen | 5.56 |
| Carbon Dioxide | 0.6 |
| Methane | 85.19 |
| Ethane | 3.57 |
| Propane | 1.54 |
| I-Butane | 0.37 |
| N-Butane | 0.57 |
| I-Pentane | 0.27 |
| N-Pentane | 0.23 |
| C6+ | 2.1 |
| Total | 100 |
Table 2: SA4 well initial composition (mole percent).
In this paper, methane, carbon dioxide, nitrogen and two other gases with specified compositions were all considered as potential gases to inject for enhanced condensate recovery of Sarkhoon gas condensate reservoir.
Tuning the Equation of State
Because of the dynamic nature of a flowing reservoir, gas condensate reservoir modeling requires stepwise computational procedure using a cubic equation of state (EOS) [4].
Equations of state (EOS) often fail to predict accurately the phase behavior of a reservoir hydrocarbon fluid. The predictions can be improved by tuning the EOS to some measured data of the fluid. The PR-EOS was used in this work [5, 6].
The modified (Quadrature) Whitson splitting method was used for C6+ fractionating and two pseudo-components were provided.
Several methods are available to calculate the critical properties and acentric factor of petroleum fractions. In order to select appropriate correlations, a comparison was made between 4 sets of most widely used correlations for generating critical properties by Kesler and Lee, Cavett, Riazi and Daubert & Pedersen (Pedersen et al.) [7-10] and four sets of correlations for acentric factors by Lee and Kesler, Edmister, Thomassen (Pedersen et al.) & Pedersen (Pedersen et al.) [10-13] by simulating the PVT experiments done on the SA.4 reservoir fluid [14]. According to the results, the total minimum average absolute deviation percent for generating the critical properties and the acentric factors of pseudo-components is due to Lee-Kesler_Lee-Kesler method. For this reason, the Lee-Kesler_Lee-Kesler method was used in this paper, although similar arguments could be adopted with Riazi-Daubert_ Thomassen method [15].
The critical temperatures, critical pressures, acentric factors and the coefficients of the PR-EOS of the pseudo components were the selected properties as the regression variables.
The saturation pressures obtained from the dew point test, the gas oil ratio (GOR) value at separator conditions, the relative volumes obtained from the constant composition expansion (CCE) test, the liquid saturations, the vapor Z-factors and the recovered moles obtained from the constant volume depletion (CVD) test were used for regression. The results are summarized in Tables 3 to 8. In each case,
Experiment |
Temperature (°F) | Observed dew point pressure (psia) | Predicted Values by Tuned EOS | % Absolute Relative Error |
|---|---|---|---|---|
| Dew Point | 220 | 4963 | 4982.8 | 0.398 |
| Dew Point | 230 | 4773 | 4739.2 | 0.7081 |
| AAD%a | 0.55% | |||
| a
|
||||
Table 3: The experimental and predicted values by tuned EOS of dew point test.
Experiment |
Pressure (psia) | Temperature (°F) | Observed GOR (MSCF/BBL) | Predicted Values by Tuned EOS | % Absolute Relative Error |
|---|---|---|---|---|---|
| Separator | 994.7 | 98 | 41.55 | 41.158 | 0.9434 |
Table 4: The experimental and predicted values by tuned EOS of GOR at separator conditions.
| Experiment | Pressure (psia) | Observed Liquid Saturation Percent | Predicted Values by Tuned EOS | % Absolute Relative Error |
|---|---|---|---|---|
| CVD | 4213 | 0.28 | 0.23418 | 16.364 |
| CVD | 3213 | 0.47 | 0.51166 | 8.8638 |
| CVD | 2213 | 0.57 | 0.64412 | 13.004 |
| CVD | 1213 | 0.7 | 0.6806 | 2.7714 |
| CVD | 513 | 0.77 | 0.657 | 14.675 |
| AAD%a | 11.13% | |||
a 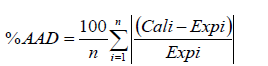 |
||||
Table 5: The experimental and predicted values by tuned EOS of liquid saturation obtained from CVD test.
Experiment |
Pressure (psia) | Observed Vapor Z-factor | Predicted Values by Tuned EOS | % Absolute Relative Error |
|---|---|---|---|---|
| CVD | 4213 | 0.974 | 0.99088 | 1.733 |
| CVD | 3213 | 0.9425 | 0.94411 | 0.1708 |
| CVD | 2213 | 0.9294 | 0.92072 | 0.9339 |
| CVD | 1213 | 0.9419 | 0.93178 | 1.0744 |
| CVD | 513 | 0.9688 | 0.96383 | 0.513 |
| AAD%a | 0.89% | |||
| a
|
||||
Table 6: The experimental and predicted values by tuned EOS of vapor Z-factor obtained from CVD test.
Experiment |
Pressure (psia) | Observed Recovered Moles | Predicted Values by Tuned EOS | % Absolute Relative Error |
|---|---|---|---|---|
| CVD | 4213 | 0.0882 | 0.090904 | 3.0657 |
| CVD | 3213 | 0.2718 | 0.27296 | 0.4268 |
| CVD | 2213 | 0.4866 | 0.48611 | 0.1007 |
| CVD | 1213 | 0.7192 | 0.72059 | 0.1933 |
| CVD | 513 | 0.8874 | 0.8845 | 0.3268 |
| AAD%a | 0.82% | |||
| a
|
||||
Table 7: The experimental and predicted values by tuned EOS of recovered moles obtained from CVD test.
Experiment |
Pressure (psia) | Observed Relative Volume (V/Vd) | Predicted Values by Tuned EOS | % Absolute Relative Error |
|---|---|---|---|---|
| CCE | 6013 | 0.8626 | 0.86069 | 0.2214 |
| CCE | 5513 | 0.909 | 0.90904 | 0.0044 |
| CCE | 5013 | 0.968 | 0.96852 | 0.0537 |
| CCE | 4773 | 1 | 1.0022 | 0.22 |
| CCE | 4613 | 1.0252 | 1.0274 | 0.21 |
| CCE | 4413 | 1.0594 | 1.0617 | 0.217 |
| CCE | 4213 | 1.098 | 1.0999 | 0.173 |
| CCE | 4013 | 1.1408 | 1.1424 | 0.1402 |
| CCE | 3813 | 1.1924 | 1.1901 | 0.193 |
| CCE | 3513 | 1.28 | 1.2735 | 0.5078 |
| CCE | 3213 | 1.395 | 1.3748 | 1.448 |
| CCE | 2913 | 1.5283 | 1.5002 | 1.8386 |
| CCE | 2513 | 1.7644 | 1.7206 | 2.482 |
| CCE | 2113 | 2.1071 | 2.0353 | 3.4075 |
| CCE | 1613 | 2.7808 | 2.6713 | 3.9377 |
| CCE | 1163 | 3.8857 | 3.7456 | 3.6051 |
| AAD%a | 1.17% | |||
| a
|
||||
Table 8: The experimental and predicted values by tuned EOS of relative volumes obtained from CCE test.
the absolute relative error value was calculated as follows:
% Absolute Relative Error = |(Calculated - Experiment)| /Experiment (1)
The total normalized Root-Mean-Square (RMS) value in this study was reported to be 0.0474 [16].
Gas Injection Process Modeling
In this survey, the commercial compositional software Eclipse 300 was used to investigate the effect of gas injection for enhanced condensate recovery of SA4 well in south of Iran. The reservoir was modeled using three dimensional cartesian system with 35 grid blocks in X and Y directions and 10 in Z direction. Since the near well bore region is of great interest in gas-condensate reservoirs, a distribution of grid cell size was chosen resulting in smaller grids near the well bore. The effect of non-darcy flow near the well bore was considered in flow equations.
The adaptive implicit method (AIM) was chosen in this study. The AIM method is a compromise between the fully implicit and implicit pressure explicit saturation (IMPES) procedures in which, cells with a high throughput ratio are chosen to be implicit for stability and to obtain large time steps, while the majority of cells can still be treated as IMPES where the solution may be changing little.
Figure 1 shows the reservoir model grids using one production well and one injection well. The locations of injection and production wells were chosen according to Craft and Hawkins [17].

Figure 1: The reservoir model grid in case of injection with one injection well.
Results and Discussion
Effect of Injection Gas Composition on Condensate Recovery and Field Pressure Drop
In this section, gas injection was performed before the reservoir pressure reaches the dew point pressure using one injection well. Five different gases were selected as potential gases for injection in this case. Injection gases composition are tabulated in Table 9. Each gas was injected in three different flow rates of 7.5 MMSCFD, 15 MMSCFD and 30 MMSCFD.
Composition |
Gas 1 | Gas 2 | Methane | Nitrogen | Carbon Dioxide |
|---|---|---|---|---|---|
| N2 | 5.65 | 0.77 | 0 | 1 | 0 |
| CO2 | 0.66 | 1.75 | 0 | 0 | 1 |
| C1 | 86.45 | 42.79 | 1 | 0 | 0 |
| C2 | 3.58 | 10.49 | 0 | 0 | 0 |
| C3 | 1.5 | 11.45 | 0 | 0 | 0 |
| IC4 | 0.34 | 4.27 | 0 | 0 | 0 |
| nC4 | 0.52 | 7.43 | 0 | 0 | 0 |
| IC5 | 0.22 | 3.86 | 0 | 0 | 0 |
| nC5 | 0.18 | 3.26 | 0 | 0 | 0 |
| C6+ | 0.9 | 13.93 | 0 | 0 | 0 |
Table 9: Injection Gas Composition.
Figure 2 shows the predicted values of the field pressure variation verses time with and without gas injection. In case of gas injection, the injection flow rates were selected to be 7.5 MMSCFD. As could be predicted, independent of the type of the injection gas, when the gas injection is performed, the predicted field pressure drop is less than the predicted value without gas injection. Nitrogen injection leads to a higher pressure maintenance in the reservoir in comparison to the other gases. However, addition of some nitrogen to a gas condensate causes a strong increase of the dew point pressure of the mixture [18]. This dew point eventually becomes much higher than the reservoir pressure. Depending on the level of mixing and dispersion, liquid dropout occurs, thus reducing the efficiency of the process [3].

Figure 2: Variation of field pressure drop with time with and without gas injection (Flow rate= 7.5 MMSCFD).
As can be seen, pure methane injection is superior in well pressure maintenance in comparison to Gas1 and Gas2 which demonstrate the fact that increasing methane composition in injection gas leads to higher reservoir pressure maintenance and vice versa.
Figure 3 shows the effect of nitrogen injection rate on field pressure drop. As shown, the higher injection rate results in higher pressure maintenance in the reservoir causing to have lower condensate dropout.

Figure 3: Variation of field pressure drop with time for different nitrogen injection flow rates.
Figure 4 shows the amount of field condensate in place versus time for injection flow rate of 30 MMSCFD for different injection gases. According to this figure, independent of the type of injection gas, the amount of field condensate in place is reduced by gas injection in comparison with the case of no injection. The results show that methane injection leads to a lower value of condensate formation among the selected injection gases. In other words, methane injection results in the highest condensate recovery.

Figure 4: Variation of the amount of in place gas condensate with time for different injection gases (Flow rate = 30 MMSCFD).
According to this figure, nitrogen is the second favourable gas for injection.
As shown, decreasing heavy components while increasing methane percent in injection gas leads to more condensate recovery.
As can be seen, with the passage of time, gas2 behavior becomes different from other gases. In fact, the slope of the curve is sharper in this case in comparison to other cases which means higher acceleration in condensate formation that is highly unfavorable.
The same trends were observed with injection flow rates of 7.5 MMSCFD and 15 MMSCFD.
As it was mentioned previously, methane injection results in highest condensate recovery percent so, at the following sections, methane was selected as the preferred injection gas for investigation of different phenomena of injection on SA4 well.
Gas Injection at Current Reservoir Pressure
In this section, injection process starts at current reservoir pressure, 3200 psi. In all cases, constant bottom hole pressure and constant injection rate were selected as production and injection well constrains, respectively. Figure 5 shows the effects of gas injection rate on time of breakthrough and condensate recovery percent. As can be seen, increasing the injection rate results in increasing the condensate recovery percent and decreasing the time of breakthrough. The slope of the condensate recovery curve is high at low injection rates and decrease gradually such that after a specified injection rate, the condensate recovery becomes approximately independent of injection rate.

Figure 5: Variation of breakthrough time and condensate recovery percent with methane injection rate (One injection well at current reservoir pressure).
Similar results were obtained by using different injection gases. The only point was that decreasing methane percent in injection gas composition results in higher required injection rate. In other words, condensate recovery starts at lower injection rates using pure methane in comparison to Gas1 or Gas2. For instance, at the specified conditions mentioned in this section, condensate recovery starts at injection rate of 25 MMSCFD for methane and 30 MMSCFD for Gas1.
Gas Injection at Abandonment Reservoir Pressure
In this section, the gas injection process is performed at abandonment reservoir pressure. The production well constrain was set to a constant BHP and three different bottom hole pressures of 1000 psia (abandonment pressure), 2000 psia and 3000 psia had been considered. In each case, different injection rates were selected.
The results of methane injection are summarized in Tables 10 and 11. When the production well bottom hole pressure is set equal to 2000 psia, the production well shuts for the injection rates higher than 30 MMSCFD so the considered production rates are below 30 MMSCFD.
Methane Injection Rate (MMSCFD) |
Time of Breakthrough after Injection | Condensate Recovery % |
|---|---|---|
| 25 | 2190 days | 1.79% |
| 30 | 1993 days | 3.46% |
| 40 | 1898 days | 6.96% |
| 80 | 1095 days | 13.26% |
| 100 | 880 days | 14.52% |
Table 10: The results of methane injection at abandonment pressure using one injection well while production with constant bottom hole pressure of 1000 psia.
Methane Injection Rate (MMSCFD) |
Time of Breakthrough after Injection | Condensate Recovery % |
|---|---|---|
| 20 | 3230 days | 6.66% |
| 25 | 2795 days | 8.66% |
| 30 | 2394 days | 10.04% |
Table 11: The results of methane injection at abandonment pressure using one injection well while production with constant bottom hole pressure of 2000 psia.
According to the results, for a constant injection rate, increasing the production bottom hole pressure from 1000 psia to 2000 psia, results in increasing the time of breakthrough and condensate recovery percent.
If production constrain is set to constant bottom hole pressure of 3000 psia, production well shuts independent of injection gas type and injection gas rate.
As mentioned in previous section, similar results were obtained using different injection gases. The only point was that in the same conditions, decreasing methane percent in injection gas composition results in later gas breakthrough and higher required injection rate.
Effect of Injection Well Number on Gas Condensate Recovery
In this section, a comparison is made between two injection processes using 1 and 3 injection wells. Figure 6 shows the reservoir model grids using one production well and three injection wells.

Figure 6: The reservoir model grid in case of injection with three injection wells.
Similar to the one injection case, the locations of injection and production wells were chosen according to Craft and Hawkins [17].
The production and injection wells data are given in Table 12 for both cases. Note that the grid is symmetrical in both injection models.
| Production well data | |
|---|---|
| Location | I=J=18 |
| Minimum bottom hole pressure (psi) | 1000 |
| Injection well data (one injection well) | |
| Location | I=J=1 |
| Maximum bottom hole pressure (psi) | 14700 |
| Injection well data ( three injection wells) | |
| Well 1 location | I=18, J=1 |
| Well 2 location | I=4, J=32 |
| Well 3 location | I=32, J=32 |
| Maximum bottom hole pressure (psi) | 14700 |
Table 12: Production and Injection well data.
In order to make an accurate comparison, injection process starts at current reservoir pressure, 3200 psi, for both cases. Constant bottom hole pressure and constant injection rate were selected as production and injection well constrains, respectively. Methane was selected as the injection gas.
The results are summarized in Table 13. As can be seen, injection with three injection wells is more efficient than that with one injection well for the same injection rate. The dependency of condensate recovery percent to injection well numbers significantly increases by increasing the injection rate such that at high injection rates, the condensate recovery becomes approximately twice when the injection well numbers increase from one to three.
In each case, the condensate recovery percent is calculated using Eq. (2) as follows:
| Time of Breakthrough after Injection | Condensate Recovery% | |||
|---|---|---|---|---|
| Total Injection Rate (MMSCFD) | one Injection Well | three Injection Wells | one Injection Well | three Injection Wells |
| 30 | 2643 days | 3541 days | 8.37% | 13.72% |
| 45 | 2285 days | 2540 days | 22.07% | 28.97% |
| 60 | 1905 days | 2449 days | 32.04% | 48.70% |
| 120 | 1040 days | 1865 days | 46.93% | 91.95% |
Table 13: Comparison between different cases of methane injection using one and three injection wells.
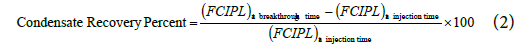
Where, FCIPL represents the amount of field condensate in place.
As can be seen, not only the condensate recovery percent increased by increasing well numbers, but also the breakthrough time increased in this case which is also favorable.
So, independent of the injection gas type and injection conditions increasing the injection well numbers results in higher condensate recovery and later gas breakthrough, this difference is significantly higher at higher injection rates.
It can be concluded that for high injection rates using three injection wells is highly preferred to using one injection well.
Conclusions
In this work, the compositional modeling of gas injection process was performed for enhanced condensate recovery of SA4 gas condensate well in south of Iran. Various scenarios of gas injection before dew point pressure, at current reservoir pressure and at abandonment pressure had been considered using different production and injection well constrains and different gas compositions. Based on the obtained results, the following conclusions can be made:
1. Between the five injection gases of methane, carbon dioxide, nitrogen, Gas 1 and Gas 2, methane injection results in the highest condensate recovery and Gas 2 injection leads to the lowest condensate recovery.
2. Nitrogen injection leads to the highest pressure maintenance in the reservoir among the selected injection gases.
3. At low injection rates, condensate recovery is strongly affected by gas injection rate and increasing the rate results in a sharp increase in condensate recovery and also results in earlier gas breakthrough.
4. Depending on the injection gas types and injection conditions, after a specified injection rate, the condensate recovery becomes approximately constant and independent of gas rate of injection.
5. Condensate recovery is higher in case of injection at current reservoir pressure in comparison to injection at abandonment pressure.
6. Using a constant injection rate, increasing the production well bottom hole pressure results in increasing the condensate recovery percent and time of gas breakthrough.
7. For the same injection rates, gas breakthrough time increases significantly by increasing the injection well numbers.
8. Injection with three injection wells is more efficient than injection with one injection well for the same injection rates.
9. The dependency of condensate recovery percent on injection well numbers significantly increases by increasing injection rate.
References
- Siregar S, Hagoort J, Ronde H (1992) Nitrogen injection vs. gas cycling in rich retrograde condensate-gas reservoirs. Int Meeting Pet Eng- SPE 22360, China.
- Bourbiaux BJ (1994) Parametric study of gas-condensate reservoir behaviour during depletion: a guide for development planning. Eur Pet Conference- SPE 28848, London, UK.
- Sanger P, Hagoort J (1998) Recovery of gas condensate by nitrogen injection compared with methane injection. SPE Journal.
- Shariati A, Alavi FS, Najmabadi FD, Derakhshan T (2008) Prediction of the compositional change in gas condensate reservoirs upon gas injection. Conference: 23rd European symposium on applied thermodynamics, Cannes, France.
- Peng DY, Robinson DB (1976) A new two constant equation of state. Ind Chem Eng Fundam 15: 59-64.
- Robinson DB, Peng DY (1978) The characterization of the heptanes and heavier fractions for the GPA Peng-Robinson programs. GPA Research Report, Tulsa, USA.
- Kesler MG, Lee BI (1976) Improved predictions of enthalpy of fractions. Hydro Proc 55: 153-158.
- Cavett RH (1962) Physical data for distillation calculations- vapor-liquid calculations. Proc 27th API Meeting, 351-366, San Francisco, USA.
- Riazi MR, Daubert TE (1980) Simplify property predictions. Hydro Proc 59: 115-116.
- Pedersen KS, Thomassen P, Fredenslund A (1989) A characterization of gas condensate mixtures. Adv Thermodynamics, USA.
- Lee BI, Kesler MG (1980) Improved vapour pressure prediction. Hydro Proc 163-167.
- Edmister WC (1958) Applied hydrocarbon thermodynamics. Part 4: Compressibility Factors and Equation of State, Pet Refiner 173-179.
- Pedersen KS, Fredenslund A, Thomassen P (1989) Properties of Oils and Natural Gases. Gulf Publishing Company, Houston, USA.
- Alavi FS, Mowla D, Esmaeilzadeh F (2010) Production performance analysis of Sarkhoon gas condensate reservoir. J Pet Sci Eng 75: 44-53.
- Alavi FS (2014) Production performance modeling of sarkhoon gas condensate reservoir; productivity analysis of a real gas condensate reservoir considering various processes of enhanced condensate recovery. LAP LAMBERT Academic Publishing, USA.
- Alavi FS, Mowla D, Esmaeilzadeh F (2009) Simulation of a gas condensate reservoir in a real field in Iran. Conference: 24th European Symposium on Applied Thermodynamics, Santiago de Compostela, Spain.
- Craft BC, Hawkins MF (1991) Applied Petroleum Reservoir Engineering. 2nd edn, Prentice Hall PTR Englewood Cliffs, USA.
- Moses PL, Wilson K (1981) Phase equilibrium considerations in using nitrogen for improved recovery from retrograde condensate reservoirs. J Pet Technol 256.
Indexed at, Google Scholar, Crossref
Indexed at, Google Scholar, Crossref
Indexed at, Google Scholar, Crossref
Indexed at, Google Scholar, Crossref
Indexed at, Google Scholar, Crossref
Citation: Alavi FS, Mowla D, Esmaeilzadeh F (2022) Investigation of Various Scenarios of Gas Injection for Enhanced Gas-Condensate Recovery: A Case Study. Oil Gas Res 8: 249. DOI: 10.4172/2472-0518.1000249
Copyright: © 2022 Alavi FS, et al. This is an open-access article distributed under the terms of the Creative Commons Attribution License, which permits unrestricted use, distribution, and reproduction in any medium, provided the original author and source are credited.
Select your language of interest to view the total content in your interested language
Share This Article
Recommended Journals
Open Access Journals
Article Tools
Article Usage
- Total views: 2783
- [From(publication date): 0-2022 - Dec 17, 2025]
- Breakdown by view type
- HTML page views: 2307
- PDF downloads: 476