Investigation of Wind Power Potential over Some Selected Coastal Cities in Nigeria
Received: 10-May-2017 / Accepted Date: 22-May-2017 / Published Date: 29-May-2017 DOI: 10.4172/2576-1463.1000156
Abstract
Energy supply in Nigeria is a major problem for both large and small-scale purposes. The potential of wind power for generation and sustainable electricity supply is yet to be adequately harnessed. Therefore, this study empirically investigated wind characteristics and potentials over four meteorological stations (Calabar, Uyo, Warri, and Ikeja) within the coastal region of Nigeria using 4-year (2008–2011) wind speed data obtained from the archive of Nigerian Meteorological Agency (NiMET). The wind characteristics were evaluated using descriptive analysis. The Weibull and Rayleigh probability density function and cumulative distribution function were fitted with the actual observed wind frequencies at 10 m, and accuracy assessment of the goodness of fit was carried out using some selected error metrics. The Weibull shape factor (k) and scale parameter (c) were calculated and used to estimate Weibull wind speeds and wind power density at 10 m and hub height 70 m using power law. Results revealed that, the maximum mean monthly wind speeds of 3.88 m/s in December, 4.73 m/s in January, 3.98 m/s in April, and 8.37 m/s in August, were observed over Calabar, Uyo, Warri, and Ikeja respectively. The performance evaluation of the distribution fit revealed that RMSE (ranging from 0.01 to 0.06) and χ2 (ranging from 0.001 to 0.23) are very low for Weibull and high RMSE (0.03-0.33) and χ2(0.003-13.91) for Rayleigh, while r (>0.9) and COE (>0.8) were both high over all the stations and for the periods of study. The study concludes that Weibull model could be adopted as the best over Rayleigh for representing wind speed distributions over the coastal region and also Ikeja area can be considered as very suitable for wind turbine applications thus, the wind power potential in this area should be adequately harnessed in order to increase the power supply and reduce carbon dioxide emissions.
Keywords: Wind; Weibull; Rayleigh; Power
22719Introduction
Energy plays an important role in all aspect of human endeavour and is required for both urban and rural needs to cater for the basic necessities of life. Wind energy is currently the most economic renewal energy apart from hydropower, its usage versatility and ability to use it as a decentralized energy form make its applications possible in rural areas where it is technically and economically feasible in the country. The major challenge to using wind as a source of electricity generation is that, wind is intermittent and it does not always blow when electricity is needed. However, wind power is one of the most promising and cost effective renewable energy sources [1]. Wind energy has been established as the world fastest growing energy source today. It grows at an average of 30% annually over the past five years and the market could reach 60,000 MW worldwide in the next five years [2]. A total of 6500 MW of wind energy generating capacity was added to grid worldwide in 2001 bringing a total wind power capacity in the world to 24000 MW. This is enough to meet the energy needs of more than 10 million households. Europe installed 4500 MW during 2001, India passed 1500 MW of the total installed wind power capacity in 2001 [2]. Prior to the planned executions of multiple gigantic power sector capital project in Nigeria, the nation’s power generation hit 4,000 MW at the beginning of 2011 according to the data released by the Power Holding Company of Nigeria (PHCN) in the first quarter of the year, power generation increased from 3,800 MW to 4,000 MW. The improvement according to the data was achieved because of increased water level of hydroelectric power stations located at Kainji, Jebba and Shiroro [3]. Despite this improvement, wind energy is still at an infant stage because; it is almost an untapped renewable energy source. The participation of government, private and individual to harness the utilization of this clean and inexhaustible energy source is very important for national development. Presently, the existing power plants in Nigeria are; Sayya Gidan–Gada, Sokoto with a capacity of 5 kW/h, Dan–Jawa, Sokoto with a capacity of 0.75 kW/h and Energy research, Benin with a capacity of 1 kW/h, based on this capacity, the contribution is quite negligible to the total energy consumption in Nigeria [4]. In addition, a unit wind turbine has been estimated to produce at least 191.11 kW of electricity per hour, in the coastal stations of Lagos and Calabar, with average wind speed of about 9.0 m/s at 70 m, which translate to 478 kW of electricity at 100% efficiency, if power is cube of wind speed [5]. Assume wind turbine is operating at 40% efficiency; a wind farm of 5,000 units will generate about 995 MW. Having at least five wind farms will increase the supply by at least 4,775 MW, which is more than what all-existing sources in Nigeria are generating [3].
Nigeria is subject to the seasonal rain, bearing South-westerly, which blows strongly from April to October and to the dry and dusty North East trade wind, which blows strongly from November to March every year. Most areas sometime experience some period of doldrums in between these periods. In Nigeria, wind energy reserves at 10 m height shows that, some sites have wind regime between 1.0- 5.1 ms-1 [1]. It is therefore necessary to evaluate the wind regimes in the country, assess the potential of wind and install wind energy conversion systems for the generation of electricity. The technologies for harnessing wind energy have over the years, been tried in many regions of the world including Nigeria. One of these technologies is the estimation of wind energy using different empirical models amongst which include the Weibull and Rayleigh models [1,5-10] Gamma and Lognormal [11-15], Diabatic method [5], Power and Logarithmic laws [16], Polynomial power curve model [17], and others. For example, Ouarda et al. [18] established that, among the one-component parametric distributions, the Kappa and Generalized Gamma distributions provided generally the best fit to the wind speed data at all heights and for all stations in United Arab Emirates (UAE). The study suggested that, for stations presenting a bimodal wind speed regime, mixture models or nonparametric models are necessary to model adequately wind energy. The 2-parameter Weibull distribution and the Rayleigh distribution are the Probability Density Functions (pdfs) that are the most commonly used in wind speed data analysis especially for studies related to wind energy estimation [19-23]. Although, Akpinar and Akpinar [24] reported that Weibull distribution provides better power density estimation than the Rayleigh distribution over Agin- Elazig in Turkey. Safari and Gasore also applied Weibull and Rayleigh pdfs to analyze wind speed characteristics and wind power potential at a height of 10 m and extrapolated for hub-heights over Rwanda using log law. The study found that Weibull pdf proved to be the best fit for the empirical distribution [25]. This was also confirmed by the study of Ahmed et al. [7] in which the Weibull model returned a lower percentage error than the Rayleigh model in the Northern and Southern regions of Nigeria. In assessing the suitability of an area in Nigeria to generating sufficient wind energy for electricity generation, Uquetan et al. [26] noted that Calabar wind can only be used for small stand-alone wind power systems, such as battery charging and for powering street light and water pumps. Similarly, Ohunakin et al. [27] found the mean wind speed of 3.17 m/s over Uyo in the coastal area of Nigeria, with a maximum value of 3.67 m/s in April while the corresponding mean wind power density is approximately 19.91 W/m2 for the whole year, thereby making the selected site to fall under class 1 of the international system of wind classification. Wind energy, which remains hitherto untapped, appears promising in solving the problem of electricity shortage. Apparently, wind energy potential is exploitable in Nigeria, especially along the coastal towns where stronger wind speeds are sufficiently available throughout the year [5]. Therefore, this study focused on the quantitative investigation of wind power potential over some selected wind sites in the coastal region of Nigeria using 2-parameter Weibull distribution and Rayleigh distribution, which will enhance economic growth through the improvement in the power supply in the region.
Methodology
Study area
This study looks at the coastal region of Nigeria due to its close proximity with the Atlantic Ocean that brings about the distribution of wind fields in the region. The coastal areas are found along the Guinea coast of Nigeria between latitude 4°N-8°N [28,29]. Many cities are located within this region but this study focuses on some selected cities including Ikeja, Warri, Calabar, and Uyo (Figure 1). The stations lie on a relatively flat plain with roughly 30-40 m above sea level. They are climatologically located in a tropical humid area having bi-modal rainfall characteristics with mean annual rainfall of between 1500-2500 mm, and temperature between 26-29°C [30]. The wind climatology over the region is defined by the South-westerlies from the Atlantic Ocean, which blows strongly from April to October and dry and dusty North East trade wind, which blows from November to March every year.

Figure 1: Map of Nigeria showing the locations of the study area.
Materials
This study is based on wind speed data source measured at 10 m height above ground level for four different locations (Ikeja, Warri, Uyo, and Calabar) in the coastal region of Nigeria (Figure 1). These locations were selected for the analysis based on their different geographical features. Four years (between 2008 and 2011) daily wind speed data were obtained from the archives of the Nigeria Meteorological Agency (NiMET) Oshodi, Lagos. The wind speeds measured at the reference height of 10 m were used to estimate the wind speed (u) at the hub heights (z) 70 m.
Research methods
The characteristics of the wind fields were evaluated in this study using descriptive analysis, including the mean, standard deviation, coefficient of variation, coefficient of skewness, and coefficient of kurtosis. Detailed descriptions of the aforementioned variables have been comprehensively discussed in Ahmed et al. [3] and Ouarda et al. [18].
Model descriptions: Several mathematical models such as normal and lognormal have been used for wind data analysis. Prior studies have also shown that models such as the Weibull and Rayleigh distribution models can equally be used [31]. According to Justus et al. [32]; Akdag and Dinler [33]; Akdag et al. [34], the twoparameter Weibull probability distribution function is the most appropriate, accepted and recommended distribution function for wind speed data analysis.
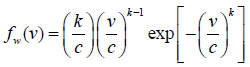
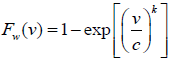
This is because it gives a better fit for measured monthly probability density distributions than other statistical functions [31,34]. In addition, the Weibull parameters at known height can be used to estimate wind parameters at another height [32]. Therefore, the twoparameter Weibull probability density function was used in this study. In Weibull distribution, the variation in wind velocity is characterized by two parameter functions: The probability density function and the cumulative distribution. The probability density function f(V) indicates the probability of the wind at a given velocity V, while the corresponding cumulative distribution function F(V) of the velocity V gives the probability that the wind velocity is equal to or lower than V, or within a given wind speed range. The Weibull probability density function and corresponding cumulative probability function are given [35,36] as:
 (1)
(1)
 (2)
(2)
Where, fw=Weibull probability density function; FW=Weibull cumulative distribution function; k=Shape factor; c=Scale factor and; v=Wind speed.
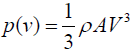
Moreover, the power density evaluation is a fundamental importance in the assessment of wind energy in a given area. The wind power density depends on the air density, the cube of the wind speed and the wind speed distribution. Therefore, this parameter is generally considered a better indicator of wind resource than the wind speed. It can be estimated by using the equation [3];
 (3)
(3)
Where p =Power in watts (W); A =Area perpendicular to wind speed vector in (m3);
V =Wind speed in (m/s); ρ =Average density of air in (kg/m3).
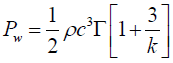
The corresponding wind power estimated by Weibull procedure could be given as [3]:
 (4)
(4)
Where PW =Weibull power;
c =Scale factor; k =Shape factor; Γ=Gamma function.
It should be noted that Rayleigh distribution is also widely used for wind speed analysis. It is actually a special case of the Weibull distribution, where the shape parameter is equal to 2 and the scale parameter is 2/1 times of the scale parameter of the Weibull distribution [36-38]. Probability density and cumulative function of Rayleigh distribution are calculated as [3]:
 (5)
(5)
 (6)
(6)
Where fR=Rayleigh probability density function;
FR=Rayleigh cumulative distribution function.
The corresponding wind power density estimated by Rayleigh model [3]:
 (7)
(7)
Where PR=Rayleigh power; v3m=Cube of mean wind speed.
The wind speed measured at the reference height of 10 m will be used to estimate the wind speed at hub height 70 m using power law [30] given as:
 (8)
(8)
Where vi is the wind speed (m/s) at hub height i; v10 is the wind speed (m/s) at reference height 10 m; zi and z10 are the hub and reference heights i and 10 m respectively; α is the exponent which is a function of the surface roughness, and it is assumed to be 0.143 (1/7) in most cases [28]. However, the surface roughness coefficient can also be determined from the following expression [39-41]:
 (9)
(9)
Alternatively, the Weibull probability density function can be used to obtain the extrapolated values of wind speed at different heights. This approach is used in this study. The Weibull parameters at measurement height are related to the parameters at the wind turbine height by the following expressions [31,25]:
 (10)
(10)
 (11)
(11)
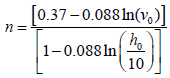
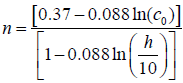
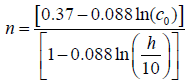
Where co and ko are the scale factor and shape parameter respectively, the measurement height is ho and h is the hub height. The exponent n is defined as:
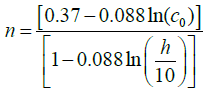 (12)
(12)
According to Table 1, the stations can be classified based on their wind power. With respect to the height of turbine hub, each class consists of a range of mean wind power or equivalent mean wind speed. Areas designated as class1 are generally not suitable for wind turbine applications while class 2 areas are marginal. Areas which can be classified as class 3 or greater are suitable for most wind turbine applications [39].
| Wind Power Class | 10 m | Hub-heights | ||
|---|---|---|---|---|
| Wind Power density (W/m2) | Speed (m/s) | Wind Power density (W/m2) | Speed (m/s) | |
| 1 | 0-100 | 0-4.4 | 0-200 | 0-5.6 |
| 2 | 100-150 | 4.4-5.1 | 200-300 | 5.6-6.4 |
| 3 | 150-200 | 5.1-5.6 | 300-400 | 6.4-7.0 |
| 4 | 200-250 | 5.6-6.0 | 400-500 | 7.0-7.5 |
| 5 | 250-300 | 6.0-6.4 | 500-600 | 7.5-8.0 |
| 6 | 300-400 | 6.4-7.0 | 600-800 | 8.0-8.8 |
| 7 | 400-1000 | 7.0-9.4 | 800-2000 | 8.8-11.9 |
| 8 | >1000 | >9.4 | >2000 | >11.9 |
Table 1: Classes of wind power density at 10 m and hub heights.
Assessment of goodness-of-fit: To evaluate the goodness-of-fit of the pdfs to the wind speed data, the correlation coefficient (r), Chi- Square (χ2), Coefficient of efficiency (COE), and Root Mean Squared Error (RMSE) were used [27,40]. Hence, the best distribution function can be selected according to the highest values of r and COE, and lowest values of RMSE and χ2.
Results and Discussion
Description of wind speed characteristics
The wind speed data have been analysed by looking at the frequency, annual cycle and variations over the various stations under study. The maximum mean monthly wind energy potential of wind speed 3.88 m/s was observed in the December over Calabar, while that of Uyo with maximum monthly mean wind speed of 4.73 m/s occurred in January (Figure 2a and 2b). This implies that, the maximum mean monthly wind energy potential could be obtained during the stable atmospheric condition in Calabar and Uyo with other things being equal [5]. However, Warri and Ikeja exhibited maximum monthly mean wind energy potential of wind speeds 3.98 m/s and 8.37 m/s in April and August respectively (Figure 2c and 2d). This shows the strength of South-westerly winds in explaining the wind distribution over these stations. Comparatively, Ikeja had the highest monthly mean wind energy potential, followed by Uyo station [5]. Calabar station had the lowest monthly mean wind energy potential which coincided with Oluleye and Ogungbenro [5]. The daily mean occurrence of wind speed over Calabar and Warri indicates that, low wind speeds ranging from 0-4 m/s are most frequent through the year, with the higher percentage frequency of occurrence of (>70%) at both stations (Figure 3a and 3c). However, high wind speeds (>4 m/s) were most frequent throughout the year with higher percentage frequency of occurrence of (>65%) over Uyo and Ikeja (Figure 3b and 3d). Table 2 presents the descriptive statistical summary of wind speed at each station including the maximum, mean, and standard deviation, coefficient of variation, coefficient of skewness, and coefficient of kurtosis. It was observed that, the maximum and mean wind speed ranged between 6.5-16 m/s, and 3-5.5 m/s over the coastal stations with height of 10 m. The standard deviation for the stations was moderately low between 0.9-2 m/s, and the coefficient of variation was moderately low ranging from 0.2 to 0.4. The coefficient of variation describes the amount of variability relative to the mean.
| Station | Height (m) | Max (m/s) | Mean (m/s) | SD (m/s) | Cv | CS | Ck |
|---|---|---|---|---|---|---|---|
| Calabar | 10 | 6.75 | 3.2 | 1.29 | 0.4 | 0.11 | -0.32 |
| Uyo | 10 | 7.75 | 4.28 | 0.96 | 0.23 | 0.11 | 0.02 |
| Warri | 10 | 7.25 | 3.32 | 1.19 | 0.36 | 0.4 | 0.21 |
| Ikeja | 10 | 16 | 5.37 | 2.37 | 0.45 | 0.58 | 0.55 |
Table 2: Descriptive statistics of daily wind speed. Max: Maximum; SD: Mean, Standard Deviation; Cv: Coefficient of Variation; Cs: Coefficient of Skewness; Ck: Coefficient of Kurtosis.

Figure 2: Monthly mean wind speed distribution over Calabar, Uyo, Warri, and Ikeja.

Figure 3: Daily mean wind speed occurrences over Calabar, Uyo, Warri, and Ikeja averaged from 2008 to 2011.
The coefficients of skewness are all positive in all the stations ranging from 0.1 to 0.5 which imply that, all the wind speed distributions are right skewed that is, the mass of the distribution was concentrated more on the low wind speeds [18]. The coefficient of kurtosis was also generally low, ranging from a negative value of -0.3 to 0.5 over the stations. This showed that, the daily wind speeds close to the mean and extreme wind speeds (very far from the mean) were relatively less frequent. On the other hand, the wind speed values found in between were more frequent. Comparatively, the highest maximum (16 m/s) and mean (5.37 m/s) wind speeds were observed over Ikeja station. The strong winds observed over this station might be attributed to the weather system like the surface trough, squalling or the local passage of gust front associated with thunderstorm in this station [18]. The highest coefficient of variation (0.45) also occurred in Ikeja station, which showed that the wind speeds at the station had much more variability relative to the mean. However, the lowest maximum (6.75 m/s) and mean (3.2 m/s) wind speeds were observed over Calabar station which might be associated with the standard cut in winds speed as suggested by Uquetan et al. [26]. While, Uyo station had least variability relative to the mean with the lowest coefficient of variation of 0.23. The lowest coefficient of kurtosis (-0.32) was found in Calabar station.
Wind speed frequency distributions over the coastal area
The daily probability density function and cumulative frequency distributions of wind speed for the four locations under study, obtained using the Weibull and Rayleigh distribution functions are shown in Figures 4 and 5. The probability density function is used to illustrate the fraction of time for which a given wind speed possibly prevails at a location. As expected in daily distribution (Figure 4), the peak of the Weibull density function frequencies of all the sites drifted towards the higher values of mean wind speed than the Rayleigh density function frequencies. It should be remarked that the peak of the probability density function curve indicates the most frequent velocity. It can be observed from Figure 4 that the most frequent wind speed expected in Calabar, Uyo, Warri and Ikeja are about 3.0, 4.5, 3.5 and 5.0 m/s respectively for Weibull, and 2.5, 3.0, 2.5 and 4.0 m/s respectively using Rayleigh. It can be further observed that Ikeja has the highest spread toward high wind speed among the locations and for both models. The results indicate that the Weibull approximation fitted more than Rayleigh, to the actual probability density distribution for daily wind speeds over all the stations.

Figure 4: Daily mean wind speed probability density distribution for the observed, Weibull, and Rayleigh over Calabar, Uyo, Warri, and Ikeja averaged from 2008 to 2011.

Figure 5: Same as Figure 4 for cumulative frequency distribution.
The cumulative probability distributions show similar drift of daily wind speed at all the study locations (Figure 5). The cumulative distribution function can be used for estimating the time for which wind speed is within a certain bin [6]. For wind speeds greater than 2.5 m/s cut-in wind speed, Calabar, Uyo, Warri and Ikeja have frequencies of about 66%, 95.3%, 74% and 88.5%, respectively. The cut-in wind speed is the minimum wind velocity below which no useful power output can be produced from wind turbine, typically within the standard of 2-3 m/s. According to Ojosu and Salawu [9], if a wind turbine system with a design cut-in wind speed of 2.2 m/s is used in these sites for wind energy resource for electricity generation; all the sites will have frequencies of more than 92%.
Accuracy assessment of the fitted distributions
Temporal analyses of the Weibull and Rayleigh models evaluation using Taylor diagram [41] is presented in Figure 6. The diagram provides a way of showing how three complementary model performance statistics vary simultaneously. These statistics are the correlation coefficient r, the standard deviation and the root-meansquare error.

Figure 6: Comparative analysis of the observed, Weibull, and Rayleigh mean daily wind speeds over Calabar, Uyo, Warri, and Ikeja.
The comparison of the variability of daily wind speed distribution of all the stations as represented by the standard deviation of the observed and modelled values revealed that, the observed variability is about 1.29, 0.96, 1.19 and 2.37(m/s) for Calabar, Uyo, Warri and Ikeja respectively and marked as ‘observed’ on the diagrams (Figure 6). Furthermore, the Weibull model variability over Calabar, Uyo, Warri and Lagos range from 1.30, 0.97, 1.21, and 2.39 (m/s), while that of Rayleigh model give 1.37, 0.96, 1.22, and 2.43 (m/s). It can be seen that the Rayleigh model has more magnitude of variability than the observed (because it extends beyond the black dashed line) significantly over Calabar station (Figure 6), whereas the others have less variability than the observed. Weibull model is close to the black dashed line and therefore have the closest variability when compared with the observations over all the stations. This further confirms the analyses of Weibull and Rayleigh approximations performed earlier over all the stations. Although, the Weibull and Rayleigh models have strong correlation coefficient values r>0.9 and coefficient of efficiency COE>0.8 when compared with the observed over all the stations, the Weibull model was still found as the best performing model with the values of r and COE approximately equal to 1.0 (Table 3). It was also revealed that the RMSE and χ2 are very low from 0.03 to 0.05, and 0.08 to 0.23 for Weibull and high (0.11-0.32) and (1.12-14.55) for Rayleigh over all the stations (Table 3). The Rayleigh was again found to be the less performed model due to its high RMSE and χ2, and farther to the actual observed values (Figure 6). Comparatively, the daily wind speed distribution showed that the Weibull model performed more over Calabar and Warri than other stations in this study due to the highest r and COE values, and lowest RMSE and χ2 values observed over these stations.
| Metric | Model | Performance Outputs | |||
|---|---|---|---|---|---|
| Calabar | Ikeja | Uyo | Warri | ||
| RMSE | Rayleigh | 0.22 | 0.32 | 0.11 | 0.15 |
| Weibull | 0.03 | 0.05 | 0.05 | 0.03 | |
| χ2 | Rayleigh | 13.91 | 14.55 | 1.12 | 3.92 |
| Weibull | 0.08 | 0.14 | 0.23 | 0.08 | |
| COE | Rayleigh | 0.86 | 0.89 | 0.91 | 0.91 |
| Weibull | 0.97 | 0.97 | 0.93 | 0.97 | |
| r | Rayleigh | 0.99 | 0.99 | 0.99 | 0.99 |
| Weibull | 0.99 | 0.99 | 0.99 | 0.99 | |
Table 3: Performance evaluation of Rayleigh and Weibull models for daily winds.
Estimation of wind power density over the coastal areas
Generally, Weibull model has been established as the best over Rayleigh for representing wind speed distributions over all the stations in this study thus, the model was adopted in estimating the wind speeds and power densities at 10 m and hub height of 70 m [6,26,27]. The annual cycle of mean power density for selected sites at height of 10 m is presented in Figure 7. As expected, the monthly mean power density over the stations follows the same trend as the mean wind speed. That is, the periods of highest wind power density correspond with the periods of highest wind speed and vice versa. As it has been shown, the Weibull distribution functions describe the observed values of wind speed reasonably well, so it can be easily guessed that the estimated annual cycle of wind power from the observed and Weibull model are similar. For this reason and for brevity, the values of theoretical wind power density which was estimated based on the actual wind speed distribution at height of 10 m were discussed.

Figure 7: Comparison of observed and estimated mean wind speeds and power density at 10 m over Calabar, Uyo, Warri, and Ikeja stations.
As it can be seen in Figure 7a, the annual average value of wind power density based on arithmetic mean wind speeds was found to be 21.4 Wm-2 where the highest and the lowest wind power density were found in the months of December and August with values of 35.8 and 7.4 Wm-2 over Calabar station. Similar variations in the mean power density were found at hub-height 70 m with the maximum wind power density of 82.4 Wm-2 occurring in December, maximum at 46.08 Wm-2 for the whole year (Figure 8a). In the case of Uyo site, the wind power density at 10 m was estimated as 48.9 Wm-2 (Figure 7b), and maximum (110.9 Wm-2) at 70 m turbine hub (Figure 8b). The highest and the lowest monthly wind power density over this station was observed in the months of January and July with values of 64.9 and 33.4 Wm-2. The annual wind power density over Warri was estimated as 23.6 Wm-2 (Figure 7c), and maximum (51.71 Wm-2) at 70 m turbine hub (Figure 8c). The highest and the lowest monthly wind power density over this station was observed in the months of April and December with values of 38.7 and 7.5 Wm-2. The annual average value of wind power density for Ikeja was found to be 115.2 Wm-2 where the highest and the lowest were in the months of August and November with values of 359.3 and 19.6 Wm-2 (Figure 7d). Similar variations in the mean power density were found at hub-height 70 m with the maximum wind power density of 827.9 Wm-2 at 70 m occurring in August, maximum at 265.47 Wm-2 for the whole year (Figure 8d). Unlike Calabar and Uyo, Warri and Ikeja stations revealed that more wind power density was estimated in the wet months than the dry which is attributed to changing temperature stratification and vertical exchange in momentum that are more prominent during the wet seasons in this locations, thus causing an increased wind speed and consequently an increase in wind power density as a result of thermal convection [27]. Therefore, the stations have more potential of wind energy generation in the wet than the dry seasons.

Figure 8: Same as Figure 7 for hub height 70 m.
Comparatively, Ikeja station was found as having the highest potential wind power density [7] while the lowest wind power density was observed over Calabar and Warri (Figure 9). The results obtained over Calabar, Uyo, and Warri stations show that the annual wind power density at both 10 m and hub height 70 m fell in wind power class 1 and class 2 (in the case of Uyo) (Table 1) which implies that, these areas are generally not suitable and marginal for wind turbine applications. Thus, the wind power density obtained over these stations can only be used for small stand-alone wind power systems, such as battery charging and for powering street light and water pumps [26,27]. However, the wind power density obtained in Ikeja was found in class 3 and above for the months of March, April, July and August, while other months fell in class 1 and 2. Generally, this area can be postulated as being suitable for most wind turbine applications especially in the observed wet months [10]. Finally, the results of wind power calculations made it evident that Ikeja area showed a good potential for installation of a wind turbine than other stations considered in this study.

Figure 9: Comparison of mean power density at 10 m over Calabar, Uyo, Warri, and Ikeja stations.
The relationship between the monthly mean power density and the monthly mean wind speeds for the locations are presented in Figure 10. Both power curve fit and linear curve fit methods were used to find the correlation between the mean power density and mean wind speed. It can be observed that both methods indicated a strong correlation (R2>0.91) between the two variables. However, irrespective of the locations, power curve fit method provides higher R2 value than the linear curve fit method and hence, it may be considered to be a better correlation method for wind data analysis. In addition, the exponent of the power curve fit varied from 2.99 (Calabar and Uyo, Figure 10a and 10b) to 3.0 (Warri and Ikeja, Figure 10c and 10d). Furthermore, the observed strong linear correlation between these variables is due to the Weibull probability density function f(V) which is involved in the expression of (V3). Figures 10 and 11 shows that there is an excellent power fit correlation between the mean power density and wind speed for the sites reported in this study. The exponent of the power curve fit equation is approximately 3 as reported by Ohunakin et al. [27].

Figure 10: Relationship between mean wind speeds and power density at 10 m over Calabar, Uyo stations.

Figure 11: Same as Figure 10 over Warri, and Ikeja stations.
Conclusion
The wind power potential of four locations in the coastal region of Nigeria has been analyzed based on the wind data from 2008 to 2011 using two-parameter Weibull, and Rayleigh distributions. The study concludes that the coastal region of Nigeria especially Ikeja area, is well endowed with abundant wind energy resources which can be used to generate electricity. Therefore, It is recommended that, Ikeja area that fell above class 3 of the international system of wind classification can be considered as very suitable for wind turbine applications thus, the wind power potential in this area should be adequately harnessed in order to increase the power supply and reduce carbon dioxide emissions which contribute to global warming, and lower long-term overdependence on fossil fuels in the coastal region and Nigeria at large; other stations used in this study fell under class 1 and 2 thus, they may only be adequate for non-connected electrical and mechanical applications like battery charging and water pumping. Further studies should seek to expand the scope of this study by including more distribution functions such as, the gamma distribution, the lognormal distribution, the inverse Guassian distribution, the kappa, the parametric distribution, etc., which will aid in finding an appropriate statistical model to describe the frequency distributions of certain given wind regimes.
Acknowledgement
The authors thank the Nigeria Meteorological Agency (NiMET) for providing the wind speed data used in this work.
References
- Aliyu AB, Ahmed A, Jidda II (2007) Statistical analysis of wind energy potential based on weibull and rayleigh model in North Central Nigeria. Conference on Applications and Design in Mechanical Engineering.
- Akpan U (2011) Power generation peaks at 3,877.4 MW. National Mirror, Nigeria pp: 35-36.
- Saddik AI, Alhassan B (2012) Wind power: an untapped renewable energy resource in Nigeria. Int J Sci Eng Res 3: 2229 - 5518.
- Oluleye A, Ogungbenro SB (2011) Estimating the wind energy potential over the coastal stations of Nigeria using power law and diabatic methods. Afr J Environ Sci Technol 5: 985-992.
- Oyedepo SO, Adaramola MS, Paul SS (2012) Analysis of wind speed data and wind energy potential in three selected locations in south-east Nigeria. Int J Energy Environl Eng 3: 7.
- Ahmed A, Bello AA, Habou D (2013) An evaluation of wind energy potential in the northern and southern regions of Nigeria on the basis of Weibull and Rayleigh models. Am J Energy Eng 1: 37-42.
- Abur BT, Duvuna GA, Akanji SA (2014) Statistical analysis of wind energy potential based on weibull and Rayleigh model in Northeast Nigeria. Int J Adv Eng Res Stud pp: 172-177.
- Ojosu JO, Salawu RI (1989) A statistical analysis of wind energy potential for power generation in Nigeria. J Solar Energy 8: 273-288.
- Ajayi OO, Fagbenle RO, Katende J, Omotosho OA, Aasa SA (2012) Analytical predictive model for wind energy potential estimation: a model for pre-assessment study. J Appl Sci 12: 450-458.
- Ozerdem B, Turkeli M (2003) An investigation of wind characteristics on the campus of Izmir Institute of Technology, Turkey. Renew Energy 28: 1013-1027.
- Akpinar S, Akpinar EK (2007) Wind energy analysis based on maximum entropy principle (MEP)-type distribution function. Energy Conversion Manag 48: 1140-1149.
- Ngala GM, Alkali B, Aji MA (2007) Viability of wind energy as a power generation source in Maiduguri, Borno state, Nigeria. Renew Energy 32: 2242-2246.
- Carta JA, Ramirez P, Velazquez S (2009) A review of wind speed probability distributions used in wind energy analysis: Case studies in the Canary Islands. Renew Sustain Energy Rev 13: 933-955.
- Yong HOU, Yidong PENG, Johnson AL, Jing SHI (2012) Empirical analysis of wind power potential at multiple heights for North Dakota wind observation sites. Energy Sci Technol 4: 1-9.
- Kubik ML, Coker PJ, Hunt C (2011) Using meteorological wind data to estimate turbine generation output: a sensitivity analysis. World Renew Energy Cong.
- Saxena BK, Rao KVS (2015) Comparison of Weibull parameters computation methods and analytical estimation of wind turbine capacity factor using polynomial power curve model: case study of a wind farm. Renewables: Wind, Water, and Solar 2: 3.
- Ouarda TBMJ, Charron C, Shin JY, Marpu PR, Al-Mandoos AH, et al. (2015) Probability distributions of wind speed in the UAE. Energy Conversion Manag 93: 414-434.
- Mirhosseini M, Sharifi F, Sedaghat A (2011) Assessing the wind energy potential locations in province of Semnan in Iran. Renew Sustain Energy Rev 15: 449-459.
- Ayodele TR, Jimoh AA, Munda JL, Agee JT (2012) Wind distribution and capacity factor estimation for wind turbines in the coastal region of South Africa. Energy Conversion Manag 64: 614-625.
- Irwanto M, Gomesh N, Mamat MR, Yusoff YM (2014) Assessment of wind power generation potential in Perlis, Malaysia. Renew Sustain Energy Rev 38: 296-308.
- Ordóñez G, Osma G, Vergara P, Rey J (2014) Wind and solar energy potential assessment for development of renewables energies applications in Bucaramanga, Colombia. In: IOP conference series: materials science and engineering.
- Petkovic D, Shamshirband S, Anuar NB, Saboohi H, Wahab AWA, et al. (2014) An appraisal of wind speed distribution prediction by soft computing methodologies: a comparative study. Energy Conversion Manag 84: 133-139.
- Akpinar EK, Akpinar S (2004) Statistical analysis of wind energy potential on the basis of the Weibull and Rayleigh distributions for Agin-Elazig, Turkey. Proceedings of the Institution of Mechanical Engineers, Part A: Journal of Power and Energy 218: 557-565.
- Safari B, Gasore J (2010) A statistical investigation of wind characteristics and wind energy potential based on the Weibull and Rayleigh models in Rwanda. Renew Energy 35: 2874-2880.
- Uquetan UI, Egor AO, Osang JE, Emeruwa C (2015) Empirical study of wind energy potential in Calabar, Cross River State, Nigeria. Int J Sci Tech Res 4: 10.
- Ohunakin OS, Adaramola MS, Oyewola OM (2011) Wind energy evaluation for electricity generation using WECS in seven selected locations in Nigeria. Appl Energy 88: 3197-3206.
- Omotosho JB, Abiodun BJ (2007) A numerical study of moisture build-up and rainfall over West Africa. Meteorol Appl 14: 209-225.
- Abiodun BJ, Adeyewa ZD, Oguntunde PG, Salami AT, Ajayi VO (2012) Modeling the impacts of reforestation on future climate in West Africa. Theor Appl Climatol 110: 77-96.
- Nnaji AO (2009) Climatology and meteorology: A packet note. Bill Fred Publishers, Owerri, Nigeria.
- Akpinar EK, Akpinar S (2005) A statistical analysis of wind speed data used in installation of wind energy conversion systems. Energy Conversion Manag 46: 515-532.
- Justus CG, Hargraves WR, Mikhail A, Graber D (1978) Methods for estimating wind speed frequency distributions. J Appl Meteorol 17: 350-353.
- Akdag SA, Dinler A (2009) A new method to estimate Weibull parameters for wind energy applications. Energy Conversion Manag 50: 1761-1766.
- Akdag SA, Bagiorgas HS, Mihalakakou G (2010) Use of two-component Weibull mixtures in the analysis of wind speed in the Eastern Mediterranean. Appl Energy 87: 2566-2573.
- Mathew S, Pandey KP (2002) Analysis of wind regimes for energy estimation. Renew Energy 25: 381-399.
- Tar K (2008) Some statistical characteristics of monthly average wind speed at various heights. Renew Sustain Energy Rev 12: 1712-1724.
- Stansell P (2004) Distributions of freak wave heights measured in the North Sea. Appl Ocean Res 26: 35-48.
- Zhou XP, Wang FH, Qian QH, Zhang BH (2008) Zonal fracturing mechanism in deep crack-weakened rock masses. Theor Appl Fract Mech 50: 57-65.
- Elliott DL, Holladay CG, Barchet WR, Foote HP, Sandusky WF (1987) Wind energy resource atlas of the United States.
- Ajayi OO, Fagbenle OR, Katende J (2011) Wind profile characteristics and econometrics analysis of wind power generation of a site in Sokoto State, Nigeria. Energy Sci Technol 1: 54-66.
- Taylor KE (2001) Summarizing multiple aspects of model performance in a single diagram. J Geophys Res Atmos 106: 7183-7192.
Citation: Udo NA, Oluleye A, Ishola KA (2017) Investigation of Wind Power Potential over Some Selected Coastal Cities in Nigeria. Innov Ener Res 6: 156. DOI: 10.4172/2576-1463.1000156
Copyright: © 2017 Udo NA, et al. This is an open-access article distributed under the terms of the Creative Commons Attribution License, which permits unrestricted use, distribution, and reproduction in any medium, provided the original author and source are credited.
Select your language of interest to view the total content in your interested language
Share This Article
Recommended Journals
Open Access Journals
Article Tools
Article Usage
- Total views: 8053
- [From(publication date): 0-2017 - Sep 03, 2025]
- Breakdown by view type
- HTML page views: 6769
- PDF downloads: 1284