Joint Modeling on the Determinants of Birth Weight and Gestational Age among Pregnant Women in Ethiopia
DOI: 10.4172/2376-127X.1000485
Abstract
Background: Birth weight and gestational age are important determinants of an infant’s survival and future development. The main objective of this research was to identify the determinants of birth weight and gestational age simultaneously based on Ethiopia's demographic health survey in 2016 which implemented in statistical package R.
Methods: Cross-sectional study design was used from Ethiopia's demographic health survey in 2016. The bivariate linear regression model was used to identify factors of birth weight and gestational age simultaneously which had small standard errors as compared to a separate model.
Results: Bi-variate models of birth weight and gestational age determined the effect of predictors. Therefore, the model shows that the number of tetanus injections before pregnancy, educational level of husband, desire for more children, drink alcohol, and region are statistically significant at 5% level of significance for gestational age in Ethiopia. Similarly, the size of a child, preferred waiting time for birth, the number of tetanus injections before pregnancy was statistically associated with birth weight at 5% level of significance.
Conclusion: From our finding, we concluded that the number of tetanus injections before pregnancy, educational level of husband, desire for more children, drink alcohol, size of child, preferred waiting time for birth and region were significant predictors of birth weight and gestational age simultaneously at 5% level of significance. Hence, special care should be given to the pregnant during antenatal care for minimizing the risk of low birth weight and small gestational age.
Keywords: Birth weight; Gestational age; Bi-variate Model; Ethiopia and demographic health survey
Abbreviations
HIV: Human Immunodeficiency Virus; DHS: Demographic and Health Survey; SNNPR: Southern Nations Nationality and Peoples Region; EDHS: Ethiopia Demographic and Health Survey.
Background
Birth weight and gestational age are the most important and reliable indicator for neonatal and infant survival, physical growth and mental development. Birth weight and gestational age are also important determinant of an infant’s survival and future development. The risk of death and illness of new born and adulthood increase when the birth weight of child is low while and growth potential decreased. Globally, low birth weight contributes 40 to 60 percent of newborn mortality. But, low birth weight can be caused by preterm birth or by intrauterine growth restriction [1]. Birth weight is the first weight of newborn obtained after birth, preferably measured within the 1st hour of life before significant postnatal weight loss has occurred [1,2].
Worldwide, out of 139 million live births, about 20 million of them are low birth weight and nearly 95.6 percent of them are in developing countries. The risk of death increase on the new born early in life, and exposes to multiple health and development challenges due to low birth weight [3].
The burden of immediate health problems on the low birth weight of newborns has been relatively widely documented in many low-income countries with national demographic surveys [4,5]. The estimated of all babies who born low birth weight found in Sub-Saharan Africa each year is 13% [6].
The proportion of low birth weight in health facilities has been least documented in south Ethiopia [6]. Birth occurring before 37 completed weeks of gestation comprises nearly 15 million babies each year with a survival chance varying dramatically around the world [4,2]. South Asia and Sub-Saharan Africa account for almost two-thirds of the world’s preterm babies and over three-quarters of the world’s newborn deaths are due to preterm birth complications [7].
Gestational weight gain is higher than ever before with approximately 40 percent of pregnant women gaining more weight than it recommended [8]. The main objective of this study was to identify the factors that affect birth weight and gestational age simultaneously based on Ethiopia's demographic health survey 2016 data.
Study Design and Methods
A cross-sectional study conducted to assess factors that affect birth weight and gestational age among mothers enrolled in Ethiopia demographic and health survey 2016 among pregnant women.
Study area and population
This study was carried out in Ethiopia based on demographic and health survey 2016. The study included pregnant women who participated in the demographic and health survey of the country.
Data collection procedures
This research utilized Ethiopia demographic and health survey in 2016 which is the fourth comprehensive and nationally representative population and health survey.
It is an important feature of the data set that avails in-depth information on demographic and health aspects of households. The data was collected by the central statistical agency at the request of the ministry of health. Data collection took place from January 18, 2016, to June 27, 2016 [3].
Inclusion and exclusion criteria of the study
Mothers who are pregnant and remember her child birth weight and gestational age which record from January 18, 2016, to June 27, 2016, were included in the study.
Variables included in the study
Response variables: The response variables for the study are birth weight and gestational age.
Explanatory variables: The predictor variables of birth weight and gestational age simultaneously were included the size of child at birth, number of tetanus injections before birth, number of tetanus injections before pregnancy, age, HIV status of the mother, timing for first antenatal care, total children ever born, antenatal care at the private and governmental clinic, toilet facility, preferred waiting time, desire for more children, live birth between birth, mother drink alcohol, source of water supply, wealth index, place of residence and region. The description of those variables is shown in Table 1 below.
| Variables | Factor Categories |
|---|---|
| Sex of the child | 0=male ,1=female |
| Source of Water Supply | 0=unimproved ,1= improved |
| Number of antenatal visits | Count |
| HIV status of mother | 0=no ,1=yes |
| Region | 1=Tigray,2=Afar ,3=Amhara ,4= Oromo |
| 5=Somali,6=Benishangul,7=SNNPR,8=Gambela | |
| 9=Harari,10=Addis Adaba,11=Dire Dawa | |
| Tetanus injection before birth | 0=no,1=1-3 times,2=4-6 times |
| 3>7times,4=did not known | |
| Tetanus injection before pregnancy | 0=no,1=1-3times,2=4-6times |
| 3>7times,4=did not known | |
| Live birth between births | 0=no,1=yes |
| Desire for more children | 1=Wants within 2 years,2=Wants after 2+ years |
| 3=Wants, unsure timing,4=Undecided | |
| 5=Wants no more,6=respondent or partner | |
| 7=Declared infecund,8=never had sex | |
| Wealth index | 1=Poorest,2=Poorer,3=Middle,4=Richer |
| 5=Richest | |
| Total children ever born | count |
| Size of Child at Birth | 1= Very large,2= Larger than average |
| 3=Average,4=Smaller than average | |
| 5=very small,8= not known | |
| Smokes Cigarettes | 0=no,1=yes |
| Mother drink alcohol | 0=no,1=yes |
| Place of residence | 1=urban ,2=rural |
| Distance to health facility | 0=no,1=yes |
| Age groups | 1=15-19,2=20-24,3=25-29,4> 30years |
| Preferred waiting time for birth | 0<12 months,1=1year,2=2year,3=3 year,4= 4 year |
| ,5=5year, 6=6year,7=7year,8=8year | |
| Timing of 1stantenatal check (months) | continuous |
| Antenatal care: government hospital | 0=no,1=yes |
| Antenatal care: private hospital | 0=no,1=yes |
| 0=no,1=Less than once a week, 2=At least once a | |
| Frequency of reading newspaper or magazine | week,3=always |
| Frequency of listening radio | 0=no,1=Less than once a week |
| 2=At least once a week,3=always | |
| Frequency of watching television | 0=no,1=Less than once a week |
| 2=At least once a week,3=always | |
| Age at first sex | continues |
Table 1: Description of variables in the study.
Statistical Analysis
Bi-variate multiple linear regression models
Under this study, we used bi-variate multiple linear regression models. The model is multiple since we have p>1 predictors with a linear function of parameters ( ) and the model is bi-variate because we have two response variables.
The regression model with response variables (U1 and U2) as a function of predictor variables (x1, …, xp) were assumed to follow its regression model, so that
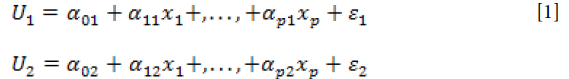
The error term ε= "ε1", "ε2" has E(e)=0 and var(e)=e matrix. Thus, the error terms associated with different responses on the same trial are correlated.
The bi-variate multiple regression model has unknown parameters. The parameter's value is obtained from parameter estimation. According to [8] least-squares estimation are the mostly used estimation methods which was used to minimize the sums of squares elements on the diagonal of the residual sum of squares and cross products matrix which has the smallest possible trace. The individual coefficients and standard errors produced by bi-variate linear regression are identical to the model produced by regress each response against the set of independent variables separately. The difference lies in that the bivariate linear regression as a joint estimator additional helps to estimates the between equation covariance.
There are various selection methods for linear regression modeling to specify how independent variables are entered into the analysis. A variety of regression models from the same set of variables were constructed. David J and Lilja backward elimination process were preferred because it is usually straightforward to determine which factor we should drop at each step of the process [9]. Therefore, under this study we used backward elimination. This study also used different model diagnostic frameworks for identifying, analyzing and interpreting data in a given context to identify the determinants of the response variable.
A first step of the regression diagnostic is to inspect the significance of the regression beta coefficients as well as the coefficients of determination (R2) that tells us how well the linear regression model fit to the data. For this study, we used plots of residuals vs fitted, Normal Q-Q and scale location (spread-location).
The goodness of fitted model that typically summarize the discrepancy between observed values and the values expected under this study was assessed by using residuals, outlier detection, a global measure of variance explained, and coefficient of determination.
Result And Discussion
A total of 1996 pregnant were included in the study
The result in Table 2, shows that the average duration of pregnancy for non-educated, primary, secondary and higher educated were 35.98, 35.90, 35.78 and 35.71 weeks respectively. Also, the standard deviation of the duration of pregnancy for no educated, primary, secondary and higher educated were 0.58, 0.97, 1.18, 1.38, shows that the individual mother had on average were a little over 0.58 weeks away from mean. Moreover, the standard error of duration of pregnancy for no educated, primary, secondary and higher educated were 0.03, 0.04, 0.06 and 0.08 respectively and concluded that sample mean is a more accurate reflection of the actual population mean.
| Gestational Age | Birth Weight | ||||
|---|---|---|---|---|---|
| Variables | levels | Mean (SE) | SD | Mean (SE) | SD |
| Mother Educational Level | No Education Primary Secondary Higher |
35.98(0.03) 35.9(0.04) 35.78(0.06) 35.71(0.08) |
0.58 0.97 1.18 1.38 |
3.22(0.04) 3.32(0.03) 3.24(0.04) 3.30(0.04) |
0.90 0.89 0.71 0.70 |
| Region | Tigray Afar Amhara Oromiya Somali Benishangul Gambela SNNPR Dire Dewa Addis Abeba Harari |
35.96(0.03) 35.58(0.29) 35.86(0.08) 35.82(0.10) 35.97(0.03) 36.03(0.07) 35.52(0.11) 35.98(0.07) 35.86(0.07) 35.81(0.06) 35.96(0.04) |
0.54 1.81 0.75 1.20 0.33 0.87 1.44 0.98 1.07 1.25 0.56 |
3.30(0.05) 3.03 (0.16) 3.00(0.10) 3.35(0.09) 3.31(0.08) 3.19(0.06) 3.18(0.06) 3.50(0.08) 3.30(0.05) 3.16(0.03) 3.43(0.05) |
0.78 0.96 0.87 1.05 0.93 0.75 0.80 1.12 0.76 0.66 0.72 |
| Husband Educational Level | No Education Primary Secondary Higher |
35.96(0.04) 35.84(0.06) 35.84(0.06) 35.86(0.05) |
0.72 1.18 1.18 1.02 |
3.24(0.05) 3.25(0.03) 3.25(0.03) 3.30(0.04) |
0.95 0.71 0.71 0.70 |
| Size of Child at birth/td> | Very large Average Large than average Smaller than average Very small Don’t know |
35.9(0.04) 35.93(0.03) 35.92(0.03) 35.87(0.09) 35.41(0.14) 36.00(0) |
0 .75 0.83 0.63 1.01 2.03 0 |
3.97(0.04) 3.12(0.02) 3.50(0.03) 2.59(0.05) 2.44(0.05) 3.10(0) |
0.92 0.57 0.58 0.61 0.66 0 |
| Preferred waiting time for birth | <1 year 2 year 3 year 4 year 5year >6 year |
35.80(0.08) 35.86(0.06) 35.92(0.06) 35.89(0.08) 35.82(0.07) 35.79(0.12) |
1.06 0.92 0.86 0.94 1.06 1.44 |
3.30 (0.06) 3.29(0.06) 3.20(0.05) 3.17(0.07) 3.28(0.06) 3.21(0.06) |
0.87 0.84 0.81 0.83 0.84 0.80 |
| Desire for more children | Wants within 2 years Wants after 2 years Wants, unsure timing Undecided Wants no more Sterilized Declared in fecund |
35.88(0.05) 35.85(0.04) 36.05(0.11) 35.74(0.15) 35.90(0.03) 34.86(0.74) 36.00(0) |
0.90 1.15 1.01 1.34 0.71 1.95 0 |
3.28(0.05) 3.26(0.03) 3.31(0.09) 3.19(0.09) 3.30(0.03) 3.29(0.36) 3.10(0.10) |
0.88 0.83 0.77 0.83 0.84 0.95 0.22 |
| Number of tetanus injections before birth | No 1-3 4-6 >7 |
35.89(0.05) 35.84(0.03) 35.94(0.04) 35(1) |
0.87 1.08 0.47 2 |
3.33(0.05) 3.27(0.03) 3.31(0.07) 2.83(0.43) |
0.82 0.84 0.84 0.85 |
| Number of tetanus injections before pregnancy | No 1-3 4-6 >7 |
35.88(0.06) 35.74(0.09) 35.81(0.12) 36(0) |
1.01 1.10 1.17 0 |
3.23(0.05) 3.36(0.07) 3.27(0.09) 3.01(0.6) |
0.79 0.80 0.89 0.2 |
| Mother drink alcohol | No Yes |
35.90(0.03) 35.81(0.04) |
1.02 0.99 |
3.28(0.02) 3.26(0.03) |
0.87 0.77 |
Table 2: Descriptive analysis of explanatory variables.
From Region point of view, the average duration of pregnancy for mother who lives SNNPR and Gambela were 35.98 and 35.52 respectively. Furthermore, the standard deviation of the duration of pregnancy mothers who live in Somali region and Afar region were 0.33 and 1.81 respectively. The standard error of duration of pregnancy for mother who lives Tigray and Somali was low which shows the sample means an accurate reflection of the actual population mean. But the standard error of duration of pregnancy for mother who lives Oromiya, Afar, and Gambela was high which show the samples mean a less accurate reflection of the actual population mean.
Moreover, the average duration of pregnancy for mothers who preferred less than 1 year and greater than the 5-year waiting time for birth was a little over 35.80. But the standard deviation for mother who preferred less than 1 year and greater than the 5-year waiting time for birth was a little over 1.06 which shows that the individual mother had on average were a little over 1.06 weeks away from mean.
Generally, pregnant who received greater than 7 times tetanus injections before birth, the sample mean of the duration of pregnancy is a less accurate reflection of the actual population mean.
The average birth weight for non-educated, primary, secondary and higher educated were 3.22, 3.32, 3.24 and 3.30 kg respectively. Also, the standard deviation of birth weight for no educated, primary, secondary and higher educated were 0.90, 0.89, 0.71and 0.70 shows that the individual mother had on average were a little over 0.7 kg away from mean. Moreover, the standard error of birth weight for no educated, primary, secondary and higher educated were 0.04, 0.03, 0.04 and 0.04 respectively and concluded that sample mean is a more accurate reflection of the actual population mean.
From region point of view the average birth weight for mother who lives Amhara, Afar and SNNPR were 3.00, 3.03 and 3.50 respectively. Furthermore, the standard deviation of the birth weight of mothers who live Amhara, Afar and SNNPR were 0.87, 0.96 and 1.12 respectively. The standard error of birth weight for mother who lives Addis Ababa was low which shows the samples mean the accurate reflection of the actual population means. But the standard error of birth weight for mother who lives A far and Amhara were high which shows the sample mean a less accurate reflection of the actual population mean.
Furthermore, the average birth weight for mothers who preferred less than 1 year and greater than the 5-year waiting time for birth was a little over 3.21. But the standard deviation for mothers who preferred less than 1 year and greater than the 5-year waiting time for birth was a little over 0.80 which shows that the individual mother had on average were a little over 0.80 kilogram away from mean. Finally, pregnant who received greater than 7 times tetanus injections before birth, the sample mean of birth weight is a less accurate reflection of the actual population mean.
Under this study, E-statistic was used to test of multivariate normality that showed multi-variate normality with a P-value equal to 0.825.
Also, residuals plot shown in Figure 1, indicate that the residuals and the fitted values confirm linearity without distinct patterns and show constant variance and Figure 2 confirms normality of error which was residual points follow the straight dashed line.

Figure 1: Residual plot.

Figure 2: Normal QQ plot.
After the overall assumptions test, the bi-variate multiple linear regression model of birth weight and gestational age over the significant predictors was modeled based on the estimated value of the parameter shown in Table 3. The fitted bi-variate linear regression models that relating birth weight and gestational age with the explanatory variables is given as:-
Table 3: Parameter estimation of bi-variate multiple linear regression model.
| Gestational Age | Birth Weight | ||||
|---|---|---|---|---|---|
| Variables | levels | Mean (SE) | SD | Mean (SE) | SD |
| Mother Educational Level | No Education Primary Secondary Higher |
35.98(0.03) 35.9(0.04) 35.78(0.06) 35.71(0.08) |
0.58 0.97 1.18 1.38 |
3.22(0.04) 3.32(0.03) 3.24(0.04) 3.30(0.04) |
0.90 0.89 0.71 0.70 |
| Region | Tigray Afar Amhara Oromiya Somali Benishangul Gambela SNNPR Dire Dewa Addis Abeba Harari |
35.96(0.03) 35.58(0.29) 35.86(0.08) 35.82(0.10) 35.97(0.03) 36.03(0.07) 35.52(0.11) 35.98(0.07) 35.86(0.07) 35.81(0.06) 35.96(0.04) |
0.54 1.81 0.75 1.20 0.33 0.87 1.44 0.98 1.07 1.25 0.56 |
3.30(0.05) 3.03 (0.16) 3.00(0.10) 3.35(0.09) 3.31(0.08) 3.19(0.06) 3.18(0.06) 3.50(0.08) 3.30(0.05) 3.16(0.03) 3.43(0.05) |
0.78 0.96 0.87 1.05 0.93 0.75 0.80 1.12 0.76 0.66 0.72 |
| Husband Educational Level | No Education Primary Secondary Higher |
35.96(0.04) 35.84(0.06) 35.84(0.06) 35.86(0.05) |
0.72 1.18 1.18 1.02 |
3.24(0.05) 3.25(0.03) 3.25(0.03) 3.30(0.04) |
0.95 0.71 0.71 0.70 |
| Size of Child at birth | Very large Average Large than average Smaller than average Very small Don’t know |
35.9(0.04) 35.93(0.03) 35.92(0.03) 35.87(0.09) 35.41(0.14) 36.00(0) |
0 .75 0.83 0.63 1.01 2.03 0 |
3.97(0.04) 3.12(0.02) 3.50(0.03) 2.59(0.05) 2.44(0.05) 3.10(0) |
0.92 0.57 0.58 0.61 0.66 0 |
| Preferred waiting time for birth | <1 year 2 year 3 year 4 year 5 year >6 year |
35.80(0.08) 35.86(0.06) 35.92(0.06) 35.89(0.08) 35.82(0.07) 35.79(0.12) |
1.06 0.92 0.86 0.94 1.06 1.44 |
3.30 (0.06) 3.29(0.06) 3.20(0.05) 3.17(0.07) 3.28(0.06) 3.21(0.06) |
0.87 0.84 0.81 0.83 0.84 0.80 |
| Desire for more children | Wants within 2 years Wants after 2 years Wants, unsure timing Undecided Wants no more Sterilized Declared in fecund |
35.88(0.05) 35.85(0.04) 36.05(0.11) 35.74(0.15) 35.90(0.03) 34.86(0.74) 36.00(0) |
0.90 1.15 1.01 1.34 0.71 1.95 0 |
3.28(0.05) 3.26(0.03) 3.31(0.09) 3.19(0.09) 3.30(0.03) 3.29(0.36) 3.10(0.10) |
0.88 0.83 0.77 0.83 0.84 0.95 0.22 |
| Number of tetanus injections before birth | No 1-3 4-6 >7 |
35.89(0.05) 35.84(0.03) 35.94(0.04) 35(1) |
0.87 1.08 0.47 2 |
3.33(0.05) 3.27(0.03) 3.31(0.07) 2.83(0.43) |
0.82 0.84 0.84 0.85 |
| Number of tetanus injections before pregnancy | No 1-3 4-6 >7 |
35.88(0.06) 35.74(0.09) 35.81(0.12) 36(0) |
1.01 1.10 1.17 0 |
3.23(0.05) 3.36(0.07) 3.27(0.09) 3.01(0.6) |
0.79 0.80 0.89 0.2 |
| Mother drink alcohol | No Yes |
35.90(0.03) 35.81(0.04) |
1.02 0.99 |
3.28(0.02) 3.26(0.03) |
0.87 0.77 |
Birth Weight = -0.61 average size –1.22 smaller than average size –0.98 Very small size +3.31 tetanus injection for 4 up to 6 times -0.97 preferred waiting time 3 years for other born – 0.88 preferred waiting time 4 year for other born.
Gestational age =9.59 -0.16 tetanus injection for 4 up to 6 times - 0.56 mother live Oromiaya +0.11 drink alcohol +0.17 higher educational level of husband-0.69 undecided desire to born more child - 0.70 sterilized desire.
Based on Table 3 results, the mean birth weight of a child who has average size at birth decreased by factor 0.61 as compared to a child who has a very large size at birth when the effect of other variables remains constant.
In addition, the mean birth weight of a child who has smaller than the average size at birth decreased by factor 1.22 as compared to a child who has a very large size at birth. This finding is consistent with the study by [10,11].
Furthermore, the mean birth weight of a child whose mother received injections of tetanus between 4 up to 6 times before birth increased by a factor of 3.31 as compared with mothers who have not received injections of tetanus before birth . This result lined with the previous study [12,13].
Moreover, the mean birth weight whose mothers waiting three years for the birth of another child decreased by factor 0.79 as compared to those waiting less than one year for the birth of another child respectively.
Finally, the mean birth weight whose mothers waiting four years for the birth of another child decreased by factor 0.88 as compared to those waiting less than one year for the birth of another child respectively. This had been confirmed by the study [14].
In similar way from result of Table 3, the mean of the gestational age of the mother who received injections of tetanus between 4 up to 6 times before birth decreased by a factor of 0.16 as compared with mothers who have not received injections of tetanus before birth when the effect of other variable remains constant. This result is linked with the previous study by [15].
In addition, the mean of gestational age for mothers who lived Oromiaya decreased by factor 0.56 as compared to those who lived Tigray.
Furthermore, the mean of gestational age for mothers who drink alcohol increased by factor 0.11 as compared to those who were not drinking alcohol. This result is linked with the previous study of [16].
Moreover, the mean of gestational age for fathers who had higher education increased by factor 0.17 as compared to non-educated. This result is in line with the previous study [17]. The mean of gestational age whose mother wants or desire of the child to be undecided for birth decreased by factor 0.69 as compared to those wants more children within 2 years. The mean of gestational age whose mother wants to be sterilized or block birth increased by factor 0.7 as compared to those wants more children within 2 years [18].
Finally, Table 3 shows about 75% and 84% of the variation in birth weight and gestational age was explained by those significant explanatory variables respectively while the remaining 25% and 16% of the variation are explained by other factors which are not included in the model respectively.
Conclusion
The study determines the factors of birth weight and gestational age among pregnant women in Ethiopia simultaneously. The variable preferred waiting time for birth, size of child and number of tetanus injections before pregnancy are statistically significant at a 5% level of significance for birth weight in Ethiopia. Furthermore, the number of tetanus injections before pregnancy, educational level of husband, desire for more children, drink alcohol, and region are statistically significant at a 5% level of significance for gestational age in Ethiopia. The risk of low birth weight in Ethiopia increase when the mother received less tetanus injection during pregnancy and when a parent prefers the high number of waiting time to birth another child. The risk of small gestational age in Ethiopia increase when the mother received more tetanus injection during pregnancy and when the parent was not educated. The result of this study helps for policy-makers, programmers and health professional to design how tetanus injection is given to pregnant mother produce the risk of low birth weight and small gestational age simultaneously.
Acknowledgements
Authors are thankful to the measure DHS for the permission to use the data.
Authors’ Contributions
KK have made substantial contribution to conception, design, and interpretation of data. SK made analysis of data. MY involved in drafting the manuscript, revising it critically for important intellectual content and all have given final approval of the version to be published.
Ethics Approval and Consent to Participate
Letter of consent was received from the measure of EDHS International Program, which authorized the data sets. All the data that used in this study are publicly available. Confidentiality of data maintained anonymously.
Competing Interests
The authors declare that they have no competing interests.
References
- Aras RY (2013) Is maternal age risk factor for low birth weight?. Arc of Med Heal Sci 1: 33.
- Blencowe H, Cousens S, Oestergaard MZ, Chou D, Moller AB, et al. (2012) National, regional, and worldwide estimates of preterm birth rates in the year 2010 with time trends since 1990 for selected countries: a systematic analysis and implications. Lancet 379: 2162-72.
- ICF International CSA (2012) Ethiopia demographic and health survey 2011. Addis Ababa, Ethiopia and Calverton, Maryland, USA: Central Statistical Agency and ICF Inter-national: 430.
- James MG (2011) Non-cardiac problems of the neonatal period. Pediatric Cardiovas Med.
- Gunderson EP (2009) Childbearing and obesity in women: weight before, during, and after pregnancy. Obstetrics and Gynecology Clinics 36: 317-32.
- Kastro S, Demissie T, Yohannes B (2018) Low birth weight among term newborns in Wolaita Sodo town, south Ethiopia: a facility based cross-sectional study. BMC Preg Childbirth 18: 160.
- Lilja DJ (2016) Linear Regression Using R: An Introduction to Data Modeling. Univer Minnesota Libraries Pub.
- Nkurunziza S, Ejaz Ahmed S (2011) Estimation strategies for the regression coefficient parameter matrix in multivariate multiple regression. Statistica Neerlandica 65: 387-406.
- Sharma SR, Giri S, Timalsina U, Bhandari SS, Basyal B, et al. (2015) Low birth weight at term and its determinants in a tertiary hospital of nepal: A case-control study. PloS one 10: e0123962.
- Singh S, Shehu CE, Nnadi DC (2016) The relationship between maternal body mass index and the birth weight of neonates in north-west Nigeria. Sahel Med J 19: 185.
- Sutan R, Mohtar M, Mahat AN, Tamil AM (2014) Determinant of low birth weight infants: A matched case control study. Open J Preventive Med 4: 91.
- Furlong KR, Anderson LN, Kang H, Lebovic G, Parkin PC, et al. (2016) BMI-for-age and weight-for-length in children 0 to 2 years. Pediatrics 138: e20153809.
- Conde-Agudelo A, Rosas-Bermúdez A, Kafury-Goeta AC (2007) Effects of birth spacing on maternal health: a systematic review. Am J Obst Gynecol 196: 297-308.
- Eide MG, Øyen N, Skjœrven R, Nilsen ST, Bjerkedal T, et al. (2005) Size at birth and gestational age as predictors of adult height and weight. Epidemiology 175-81.
- Chu HY, Englund JA (2014) Maternal immunization. Clin Infect Diseases 59: 560-8.
- Tafere TE, Afework MF, Yalew AW (2018) Providers’ adherence to essential contents of antenatal care services increases birth weight in Bahir Dar City Administration, North West Ethiopia: a prospective follow up study. Repro Heal 15: 163.
- Nicolaidis C, Ko CW, Saha S, Koepsell TD (2004) Racial Discrepancies in the Association between Paternal vs. Maternal Educational Level and Risk of Low Birth weight in Washington State. BMC Preg Childbirth 24: 10.
- Leite IC, Koifman S (2009) Oral clefts, consanguinity, parental tobacco and alcohol use: a case-control study in Rio de Janeiro, Brazil. Brazilian Oral Res 23: 31-7.
Citation: Gebre KK, Gebre SK, Zeru MA (2021) Joint Modeling on the Determinants of Birth Weight and Gestational Age among Pregnant Women in Ethiopia . J Preg Child Health 8: 485. DOI: 10.4172/2376-127X.1000485
Copyright: © 2021 Gebre KK, et al. This is an open-access article distributed under the terms of the Creative Commons Attribution License, which permits unrestricted use, distribution, and reproduction in any medium, provided the original author and source are credited.
Select your language of interest to view the total content in your interested language
Share This Article
Recommended Journals
Open Access Journals
Article Tools
Article Usage
- Total views: 3935
- [From(publication date): 0-2021 - Dec 06, 2025]
- Breakdown by view type
- HTML page views: 3032
- PDF downloads: 903