Long-Term Tillage and Crop Rotation Impacts on a Northern Great Plainsmollisol
Received: 24-May-2015 / Accepted Date: 25-Jul-2015 / Published Date: 01-Aug-2015 DOI: 10.4172/2329-8863.1000178
Abstract
Soil properties can be altered by tillage and rotation, however, these effects cannot be detected in short-term studies. This study was conducted to assess the long-term (14 years) tillage and rotation impacts on selected soil surface properties. A long-term experimental site comprised of two tillage systems [no tillage (NT) and conventional tillage (CT)], and three crop rotations [corn (Zeamays)-soybean (Glycinemax), corn-soybean-wheat (Triticumaestivum), and corn-soybean-wheat-alfalfa (Medicagosativa)] were used for the present analysis. Surface (0-15 cm) soil samples were collected every year from 1991 through 2004 and analyzed for soil organic matter (SOM), available P, available K, and nitrate (NO3Ãâ¹Ãâ°-N). Results indicated that SOM concentration (averaged across all years) under NT (37 g kg-1) was significantly higher compared to that of CT (36 g kg-1). However, overall crop rotation did not impact SOM. Soil P concentration under NT (208 mg kg-1) was significantly higher (8.3%) than that of CT (191 mg kg-1). Available P concentration was the highest in the 2-year-rotation, intermediate in the 3-year-rotation, and lowest in the 4-year-rotation. Tillage system did not significantly impact NO3 - concentration; nonetheless, its concentration was the highest in the 4-year-rotation followed by the 3-year-rotation, and the lowest was in the 2-year-rotation. The available K concentration under NT was not significantly different from that under CT; however, its concentration under the 2-year-rotation (340 mg kg-1) was significantly lower than those under the other two rotations. This 14-year tillage and rotation study had minimal impact on surface soil properties at this location.
Keywords: No-tillage; Conventional tillage; Soil nutrients; Soil organic matter
403802Introduction
Tillage and crop rotation systems impact soil organic matter (SOM) and soil nutrients; however, the impact of these systems cannot be observed in the short term experiments but rather in the long term experiments. Tillage and crop rotation impacts on soils depend on multiple factors such as soil type, cropping system, residue management, and environmental conditions [1,2]. No-tillage (NT) management can increase soil organic carbon (SOC) compared with conventional tillage [3]. Applying different crop rotations is important in recycling nutrients because plants differ in their ability of taking up nutrients from different depths, and releasing these nutrients after death and decay [4]. Increased SOM in a tillage system can be achieved via adding more organic materials to the soil, decreasing the rate of SOM decomposition, or a combination of both [5] Pulverizing soil surface via conventional tillage (CT) mixes the organic materials for the depth of plowing (25 cm depth), and increases the aeration and microbial activity, which in turn may lead to decreased SOM in the upper 15 cm of the soil [6].
During the first few years in long-term experiments, NT and CT may have the same content of SOM; nonetheless, CT may have more SOM compared with NT [7]. However, after several years of using NT system, SOM concentrations may significantly increase for the surface depth (0-15 cm) compared with that under CT [8,9] observed a significant increase in SOM in the upper layer of soil under NT compared with that under CT after 20 years of continuous corn. In another long-term (30 years) study, Godsey et al. [10] found a significant increase in SOM concentrations in the surface layer of soil under NT compared with that under CT.
Similarly, tillage and crop rotation may impact soil nutrients contents and their availability to crops. These nutrients can be added to soils in the form of fertilizers, manure, leguminous crops, or crop residues. Soil nutrients usually include N, P, and K. Nitrogen is one of the most important nutrients for the crop growth. However, when its availability exceeds plant requirements, the excess reactive N moves freely to the ground water (in the form of NO3-), or volatiles to the atmosphere (in the form of N2O), and negatively impacts the environment. For example, N is of a major environmental concern because of NO3-, which could be leached to the ground water and decrease its quality [11]. The CT system enhances SOM Therefore, innovative and holistic management practices are needed for minimizing the off-site movement of applied N. These practices include: (i) multi-purpose cover crops facilitating biological N fixation, (ii) organic farming improving soil biology diversity and soil health, and (iii) use of conservation tillage and diverse cropping systems. These alternative practices help in minimizing N and other nutrient losses from agro ecosystems, and greatly benefit the environment. Therefore, introducing these conservation practices to existing cropping systems is helpful in reducing N losses. The leached NO3- in the tile drainage was found to be smaller under NT compared with that under CT in a corn-soybean rotation [12].
Soil management systems greatly affect the distribution of K vertically and horizontally in the soil profile [13,14]. Previous studies indicated that K content in the surface layer of 3-5 cm was often higher than other depths under NT [13]. In contrast, under CT system, the distribution of K in the soil profile is relatively uniform [15]. The source of P in soils could be inorganic (e.g., fertilizers or parent materials) or organic (e.g., released P from decomposed plant residue) [16]. Immobile nutrients such as P could be concentrated at the soil surface as a result of applying NT [17]. Mineralization of SOM may significantly affect the concentration of some nutrients like P and N, but does not affect K concentration Calonego et al. [18] and Karlen et al. [19] found that there was no difference between K concentration under NT and CT system. At the soil surface, nutrients concentrations are higher but they may decrease with depth under NT; however, CT may result in a homogenous distribution of these nutrients with depth [7,13] in their work in Spain found that P and K concentrations at the soil surface (0-15 cm) were higher under NT compared with CT, which could be due to the high SOM concentration under NT as well as maintaining the applied P fertilizers. Further, crop rotation may also impact the distribution of nutrients such as P and K in the soil profile [13] The present study was conducted with the specific objective to assess the long-term (14 years) tillage and crop rotation impacts on soil organic matter and soil nutrients.
Materials And Methods
Experiment location and design
The experimental site is located at the Southeast Research Farm of the South Dakota State University South Dakota located at Clay County (43° 02’ 58” N, 96° 53’ 30” W), South Dakota (Figure 1). The experiment was initiated in 1990 to assess the impact of different tillage systems and crop rotations on the long term production and economics of cropping systems. The first growing season started in the spring of 1991. The experiment was conducted on Egan soil series (Fine-silty, mixed, superactive, mesic Udic Haplustolls) [20]. The study soil series occupies 3,931,019 acres (or 99.6% of the total area occupied by this soil series in USA), and it is nearly level with a slope of 0-1%. The daily average temperature ranges from -14.1°C in January to 31.8°C in July, and the mean annual precipitation is 627.4 mm [21].
The experimental site has 80 plots distributed randomly in a complete block design. Each plot has a width of 20 m and a length of 100 m. The experimental plots were designed to be large so that field operations could be carried out using commercial sized farm equipment. The experiment had three different tillage systems which were no till (NT), conventional till (CT), and ridge till (RT). Ridge till system had only a two year crop rotation of corn (Zea mays L.) – soybean (Glycine max. L.). In the fall of every year after harvest, residues of corn, soybean, and wheat were disked and chiseled in all of the conventionally tilled plots. The RT plots were excluded from this study because it had only one rotation system. Both NT and CT had three rotation systems, which were a two year rotation of corn-soybean, a three year rotation of corn-soybean-wheat (Triticum aestivum L.), and a four year rotation of corn-soybean-wheat-alfalfa (Medicago sativa L.) (Figure 1).
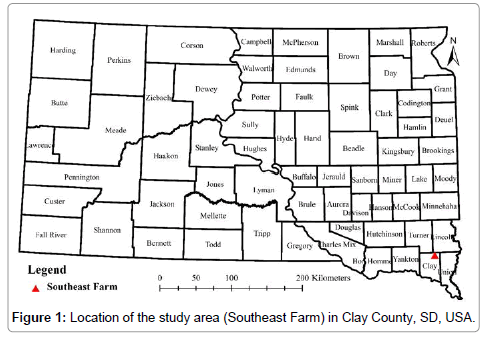
Figure 1: Location of the study area (Southeast Farm) in Clay County, SD, USA.
Soil sampling and analyses
It is of importance to mention that the data we used here were collected from 1991 to 2004, but they have not been published in scientific journals. Also, not all of the soil properties were analyzed every year; that is why we selected the years that have data of the same soil properties. Soil samples were collected every fall after harvesting the crops from 1991 to 2004 from each plot. Three cores of soil samples from each plot were collected at a depth of 0-15 cm using a 3.5-cmdiameter and 50-cm-tall hand probe(Inc. JMC Soil Samplers) and mixed together to make a composite sample. Composited soil samples were labeled, sealed in plastic zip-lock bags, and transported to the laboratory. Every year, after bringing the soil samples to the laboratory, all of them were air dried, ground, and sieved to pass a 2-mm sieve. All of the analyses were carried out using the soil fine fraction (
Soil organic matter (SOM) was measured using the loss on ignition (LOI) method [22]. Briefly, 10 g of each soil sample was weighed in an aluminum crucible, transferred to a muffle at a temperature of 450-500oC for 4 h, and then the loss of weight was determined. P was extracted using a 0.5 M NaHCO3 solution and then the extraction was measured colorimetrically [23]. Nitrate was determined using a nitratespecific ion electrode [24]. Available K was extracted by 1 M NH4OAc at pH 7.0, and it was determined using an atomic absorption (AA) [25].
Statistical analysis
Soil organic matter and soil nutrients that measured in all of the tillage and crop rotation systems of each year were analyzed separately and together. An analysis of variance (ANOVA) was conducted using the SAS software (version 9.3, SAS Institute, Cary, NC, USA). An estimate for the least significant difference (Duncan’s LSD) between two tillage systems and three crop rotations were obtained using the ‘GLIMMIX procedure’ in SAS. Statistical differences were declared significant at the α = 0.05 level.
Results And Discussion
Tillage and crop rotation impacts on soil organic matter
The NT system increased SOM (37 g kg-1) for the 0-15 cm depth after 14 years compared to CT system (36 g kg-1) (Figure 2A). This was attributed to the mixing of SOM content within the plowing depth (25 cm) and the increased aeration under CT treatment leading to SOM decomposition [26,27]. Compared with SOM concentration under NT in 1991, its concentration significantly increased across the years of the experiment under all of the crop rotation systems. For example, under the 4-year-rotation, the highest and lowest SOM concentrations of 39.3 and 32.6 g kg-1 were observed in 2004 and 1991, respectively (Table 1). Furthermore, SOM concentrations under CT followed atrend similar to those under NT (Table 1). In 2002, however, SOM concentration under NT and CT drastically declined, which could be attributed to the higher temperature in that year leading to more oxidation of SOM. Concentrations of SOM under CT were lower than those under NT in almost all of the years of the experiment, which could be due to the mixing action of the surface layer to the depth of the plowing (25 cm) and the increased aeration and oxidation under CT [28] (Table 1). However, the differences between SOM concentrations under NT vs CT for individual years were mostly not significant especially under the 2 and 3-year-rotations (Table 1). In the 4-year-rotation; however, SOM concentration under NT was significantly higher by 5.4, 4.7, and 4.1% than that under CT in 1994, 1997, and 2004, respectively (Table 1).
| Treatments | SOM (g kg-1) | |||||
|---|---|---|---|---|---|---|
| 1991 | 1994 | 1995 | 1997 | 2002 | 2004 | |
| 4-year-rotation (corn-soybean-wheat-alfalfa) | ||||||
| NT | 32.6dA† | 37.1bA | 38.5aA | 38.6aA | 34.6cA | 39.2aA |
| CT | 33.5dA | 35.1cB | 38.6aA | 36.8bB | 33.3dA | 37.6abB |
| 3-year-rotaion (corn-soybean-wheat) | ||||||
| NT | 34.3dA | 36.0cA | 39.3aA | 37.6bA | 33.9dA | 37.9bA |
| CT | 32.2cB | 35.7bA | 38.2aA | 37.9aA | 32.4cB | 37.6aA |
| 2-year-rotation (corn-soybean) | ||||||
| NT | 32.0eB | 36.3cA | 39.1aA | 37.1bcA | 33.9dA | 38.9abA |
| CT | 34.0cA | 37.1bA | 38.9aA | 37.6abA | 33.9cA | 38.8aA |
Table 1: Soil organic matter (SOM) concentration as impacted by no-tillage and conversional tillage systems under three different rotation systems for the 0-15 cm depths.
Generally, SOM concentrations under the three different crop rotations (corn-soybean, corn-soybean-wheat, and corn-soybeanwheat- alfalfa) were not significantly different among each other (Figure 2B), which agreed with what was observed by Karlen et al. [29]. Moreover, data in Table 2 indicated that there was no impact of the crop rotations under NT system on SOM concentration in almost all of the years [30]. In contrast, crop rotations under CT impacted SOM concentration in some of the years. For example, SOM concentrations under the 2-year-rotation were significantly higher than that under the 3 and 4-year-rotation systems for 1994, 2002, and 2004 (Table 2). The majority of SOM under the 2-year-rotation was sourced from corn. Organic materials sourced from corn have wider C/N ratio and decompose slower compared with those sourced from legumes [30]. That may interpret why the 2-year-rotation had some higher values of SOM under CT compared with those under the other two rotations under CT. Overall, NT system enhanced the accumulation of SOM compared with CT. However, crop rotation systems did not significantly impact SOM concentration.
| Treatments | SOM (g kg-1) | |||||
|---|---|---|---|---|---|---|
| 1991 | 1994 | 1995 | 1997 | 2002 | 2004 | |
| No tillage | ||||||
| 4-yr-rot | 32.6b† | 37.1a | 38.5a | 38.6a | 34.6a | 39.2a |
| 3-yr-rot | 34.3a | 36.0a | 39.3a | 37.6a | 33.9a | 37.9b |
| 2-yr-rot | 32.0b | 36.3a | 39.1a | 37.1a | 33.9a | 38.9ab |
| Conventional tillage | ||||||
| 4-yr-rot | 33.5a | 35.1b | 38.6a | 36.8a | 33.3b | 37.6b |
| 3-yr-rot | 32.2b | 35.7b | 38.2a | 37.9a | 32.4b | 37.6b |
| 2-yr-rot | 34.0a | 37.1a | 38.9a | 37.6a | 33.9a | 38.8a |
Table 2: Soil organic matter (SOM) concentrations as impacted by crop rotations under no-tillage and conversional tillage systems for the 0-15 cm depths.
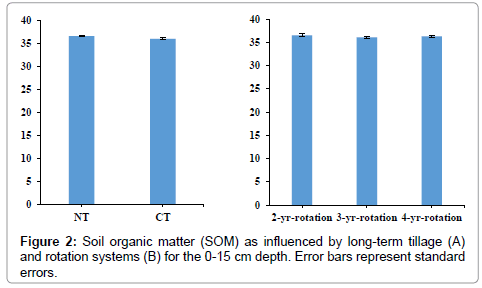
Figure 2: Soil organic matter (SOM) as influenced by long-term tillage (A) and rotation systems (B) for the 0-15 cm depth. Error bars represent standard errors.
Tillage and crop rotations impacts on available phosphorus
Averaged across all the years, the available P concentrations under NT vs CT systems were significantly different. For example, available P concentration of 208 mg kg-1 under NT was significantly higher (8.4%) compared with that of 191 mg kg-1 under CT (Figure 3A). Similar findings were also found by Wyngaard et al. [31]. In their work on tillage effects on soil properties of a Mollisol in Argentina. On a yearly basis, available P concentration was significantly higher under NT vs CT under all of the rotation systems (Table 3). For example, in the 4-year-rotation, P concentrations were higher under NT and these were 40, 30, 22, 32.6, and 21.5% higher than those under CT for 1994, 1995, 1997, 2002, and 2004, respectively. This high concentration of available P under NT vs CT could be due to the application of P fertilizer to crops every year which may cause an accumulation of P at the soil surface as a consequence of the low mobility of P and due to the mixing of the plowing depth, which distributed the P content within a 25 cm depth. In contrast, in the yearly basis in the 2 and 3-year-rotations, NT and CT exhibited no significant impact on available P concentration [32] (Table 3).
| Treatments | P (mg kg-1) | |||||
|---|---|---|---|---|---|---|
| 1991 | 1994 | 1995 | 1997 | 2002 | 2004 | |
| 4-year-rotation (corn-soybean-wheat-alfalfa) | ||||||
| NT | 196cA† | 150dA | 149dA | 179cdA | 243bA | 284aA |
| CT | 144bB | 90cB | 103cB | 140bB | 164bB | 226aB |
| 3-year-rotaion (corn-soybean-wheat) | ||||||
| NT | 148cdB | 128dB | 157cdA | 232bA | 172cA | 325aA |
| CT | 213bA | 195bA | 167bA | 202bA | 195bA | 290aA |
| 2-year-rotation (corn-soybean) | ||||||
| NT | 138cA | 165bcA | 128cA | 183bcA | 198bA | 388aA |
| CT | 168bA | 148bA | 148bA | 190bA | 175bA | 418aA |
Table 3: Soil available phosphorus (P) concentration as impacted by no tillage vs conventional tillage under three rotation systems at the soil surface (0-15 cm).
Available P concentrations differed significantly among all of the three crop rotations. For example, its concentration under the 2-yearrotation of 236 mg kg-1 was significantly higher than that under the 3-year-rotation of 211 mg kg-1, which was higher than that of 172 mg kg-1 under the 4-year-rotation (Figure 3B), similar results were found in Canada [30], Across the years of the experiment under NT and for the 4-year-rotation, P concentration under NT significantly decreased from 1991 to 1997, but significantly increased in both 2002 and 2004 (Table 4). However, in the 2 and 3-year-rotations under NT, available P concentration generally increased from 1991 to 2004 (Table 4). In contrast, available P concentration generally increased from the beginning of the experiment to 2004 under NT and CT in both the 2 and 3-year-rotations (Table 4). Data in Table 4 under NT revealed that there was almost no significant difference in available P concentrations under all of the three crop rotations. However, under CT, available P concentrations under the 4-year-rotation were significantly lower compared with those under the other two crop rotations (Table 4), which could be attributed to the higher demand of P for the [33] under the 4-year-rotation than that under the other two crop rotations.
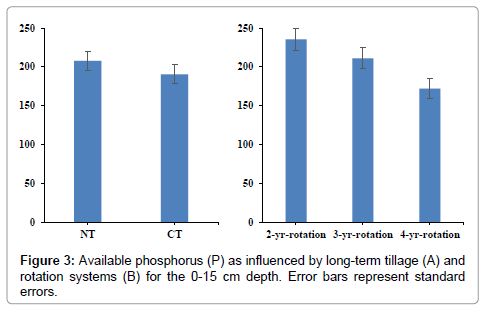
Figure 3: Available phosphorus (P) as influenced by long-term tillage (A) and rotation systems (B) for the 0-15 cm depth. Error bars represent standard errors.
| Treatments | P (mg kg-1) | |||||
|---|---|---|---|---|---|---|
| 1991 | 1994 | 1995 | 1997 | 2002 | 2004 | |
| No tillage | ||||||
| 4-yr-rot | 196a† | 150a | 149a | 179b | 243a | 284b |
| 3-yr-rot | 148a | 128a | 157a | 232a | 172b | 325b |
| 2-yr-rot | 138a | 165a | 128a | 183ab | 198ab | 388a |
| Conventional tillage | ||||||
| 4-yr-rot | 144b | 90b | 103b | 140b | 164b | 226c |
| 3-yr-rot | 213a | 195a | 167a | 202a | 195a | 290b |
| 2-yr-rot | 168ab | 148ab | 148a | 190a | 175ab | 418a |
Table 4: Soil available phosphorus (P) concentrations as impacted by crop rotations under no tillage and conventional tillage at the soil surface layer (0-15 cm).
Tillage and crop rotations impacts on soil nitrate (NO3- -N)
In general, averaged across all of the years, the nitrate (NO3- ) concentrations for the soil surface (0-15 cm) under the two tillage systems were not significantly different (Figure 4A). Similarly, from 1991 to 2004, nitrate concentrations under NT for the same crop rotation were not significantly different. Nitrate concentration in 1995, however, was significantly lower than those in the other years, which could be due to the very wet weather in 1995, which caused a delay in planting all of the crops as well as leaching NO3- from the surface layer of the soil (Table 5). Although SOM concentration under CT significantly increased from 1991 to 1995, nitrate concentration significantly decreased from 1991 to 1995 (Tables 1 and 5). This opposite relation could be attributed to the nitrate downward movement under CT (especially during the very wet weather in 1995). Generally, in each separate year under all of the crop rotations, nitrate concentrations under NT were not significantly different from those under CT (Table 5). Overall, CT exhibited higher but not significantly different NO3- concentrations than those under NT [34], which could be ascribed to the higher rate of decomposing SOM, which released more nitrate under CT compared with NT.
| Treatments | NO3- (kg ha-1) | |||||
|---|---|---|---|---|---|---|
| 1991 | 1994 | 1995 | 1997 | 2002 | 2004 | |
| 4-year-rotation (corn-soybean-wheat-alfalfa) | ||||||
| NT | 17.8abA† | 19.3aA | 15.0bA | 20.7aA | 20.8aA | 17.5abB |
| CT | 19.9aA | 15.0bB | 11.0cB | 18.3aA | 17.9abA | 20.8aA |
| 3-year-rotaion (corn-soybean-wheat) | ||||||
| NT | 17.2aA | 16.4aA | 11.1bA | 15.7aA | 13.6abA | 15.7aA |
| CT | 22.1aA | 19.4abA | 10.5cA | 16.8bA | 18.0abA | 19.0abA |
| 2-year-rotation (corn-soybean) | ||||||
| NT | 13.5abA | 15.3aA | 11.5bA | 12.1bB | 12.9bA | 12.8bB |
| CT | 12.3dA | 16.2bA | 12.8cdA | 15.6bcA | 14.9bcdA | 23.3aA |
Table 5: Soil nitrate (NO3-) Concentration differences between no tillage and conventional tillage under three rotation systems for the soil surface layer (0-15 cm).
Generally, nitrate concentrations were significantly different among all of the applied three crop rotations (Figure 4B). For example, NO3- concentration in the 4-year-rotation of 18 kg ha-1 was significantly higher than that of 16 kg ha-1 in the 3-year-roatation, which was significantly higher than that of 15 kg ha-1 in the 2-year rotation of (Figure 4B). Such a trend could be attributed to the narrow C/N ratio in the legumes – soybean and alfalfa – in the 4-yearrotation which caused faster decomposition of SOM and released more nitrate [35-37]. Similarly, in each separate year, under the NT system, nitrate concentrations in the 4-year-rotation were significantly higher than those under the other two rotations Table 6 which also could be attributed to the narrow C/N ratio in the organic materials of the leguminous crops in the 4-year-rotation. Nevertheless, nitrate concentrations under CT were almost not significantly different among the three crop rotation systems (Table 6).
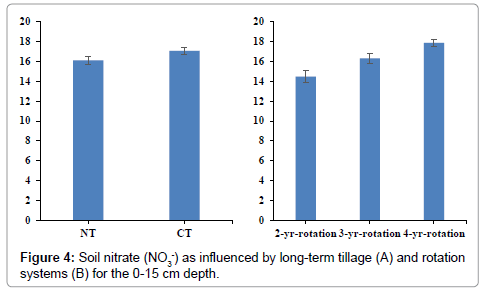
Figure 4: Soil nitrate (NO3 -) as influenced by long-term tillage (A) and rotation systems (B) for the 0-15 cm depth.
| Treatments | NO3- (kg ha-1) | |||||
|---|---|---|---|---|---|---|
| 1991 | 1994 | 1995 | 1997 | 2002 | 2004 | |
| No tillage | ||||||
| 4-yr-rot | 17.8a† | 19.3a | 15.0a | 20.7a | 20.8a | 17.5a |
| 3-yr-rot | 17.2ab | 16.4a | 11.1b | 15.7b | 13.3b | 15.7ab |
| 2-yr-rot | 13.5b | 15.3a | 11.5b | 12.1b | 12.9b | 12.8b |
| Conventional tillage | ||||||
| 4-yr-rot | 19.9a | 15.0b | 11.0a | 18.3a | 17.9a | 20.8a |
| 3-yr-rot | 22.1a | 19.4a | 10.5a | 16.8a | 18.0a | 19.0a |
| 2-yr-rot | 12.3Bb | 16.2ab | 12.8a | 15.6a | 14.9a | 20.3a |
Table 6: Soil nitrate (NO3-) concentrations as impacted by crop rotations under no tillage and conventional tillage at the soil surface layer (0-15 cm).
Tillage and crop rotations impacts on soil potassium
Averaged across all of the 14 years of the experiment, there was no significant difference in available K concentrations between the NT (359 mg kg-1) and CT system (347 mg kg-1) (Figure 5A). Across the years of the experiment, available K concentration was decreasing under both of the tillage systems (Table 7). For example, its concentration under NT within the 4-year-rotation in 2004 was 34.4% lower than that in 1991. During the experiment, crops were consuming K from the soil while there was no supplemental K applied as a fertilizer, which could interpret the decreased trend in K concentration from 1995 to 2004 under all of the treatments. In each separate year within the 4-year-rotation, K concentration was significantly higher under NT than that under CT in 1994, 1995, and 1997. This could partially attributed to the reason that the content of K in the NT plots were higher at the beginning compared with that of CT plots [30] (Table 7). In the 2 and 3-year- rotation for each separate year, however, available K concentration under NT and CT was not significantly different (Table 7). Within the crop rotations, the 3-year-rotation had the lowest concentration of available K (340 mg kg-1) which was significantly different from the other two rotations, and there was no significant difference between its concentration in the 2-year-rotation (365 mg kg-1) and 4-year-rotation (357 mg kg-1) (Figure 5B). Data in Table 8 indicated that the available K concentrations under NT in each separate year were significantly lower under the 3-year-rotation system than those under the other two rotations. However, under the CT system, the available K concentrations were not significantly different among the three crop rotation systems.
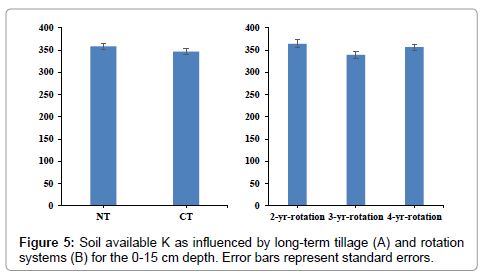
Figure 5: Soil available K as influenced by long-term tillage (A) and rotation systems (B) for the 0-15 cm depth. Error bars represent standard errors.
| Treatments | K (mg kg-1) | |||||
|---|---|---|---|---|---|---|
| 1991 | 1994 | 1995 | 1997 | 2002 | 2004 | |
| 4-year-rotation (corn-soybean-wheat-alfalfa) | ||||||
| NT | 419bA† | 412bA | 472aA | 372cA | 326dA | 275eA |
| CT | 359abB | 336bcB | 364aB | 317cB | 311cA | 315cA |
| 3-year-rotaion (corn-soybean-wheat) | ||||||
| NT | 351aA | 362aA | 379aA | 313bA | 286bcA | 277cB |
| CT | 351abA | 387aA | 380aA | 340bcA | 308cA | 329bcA |
| 2-year-rotation (corn-soybean) | ||||||
| NT | 390bA | 451aA | 389bA | 337cA | 275dA | 270dA |
| CT | 357bA | 433aA | 412aA | 333bA | 322bcA | 293cA |
Table 7: Soil potassium (K) concentration differences between no tillage and conventional tillage under three rotation systems for the soil surface layer (0-15 cm).
| Treatments | K (mg kg-1) | |||||
|---|---|---|---|---|---|---|
| 1991 | 1994 | 1995 | 1997 | 2002 | 2004 | |
| No tillage | ||||||
| 4-yr-rot | 419a† | 412a | 472a | 372a | 326a | 275a |
| 3-yr-rot | 351b | 362b | 379b | 313b | 286b | 277a |
| 2-yr-rot | 390a | 451a | 389b | 337ab | 275b | 270a |
| Conventional tillage | ||||||
| 4-yr-rot | 359a | 336b | 364b | 317a | 311a | 315a |
| 3-yr-rot | 351a | 387ab | 380b | 340a | 308a | 329a |
| 2-yr-rot | 357a | 433a | 412a | 333a | 322a | 293a |
Table 8:Soil available potassium (K) concentrations as impacted by crop rotations under no tillage and conventional tillage at the soil surface layer (0-15 cm).
Conclusions
In the long term experiment (14 years) data showed that the SOM concentration at a depth of 0-15 cm under NT system was significantly higher than that under CT. However, there was no significant difference in SOM concentrations between under crop rotations. Soil P concentration under NT was significantly higher compared with that under CT. The 2-year-rotation had the highest P concentration followed by the 3-year-rotaion, and the lowest concentration was observed in the 4-year-rotation. Nitrate concentration under NT was not significantly different from that under CT; however, the 4-yearrotation had the highest NO3- concentration followed by the 3-year-rotation, and the lowest concentration was observed in the 2-year-rotation. The K concentration was not significantly different under NT and CT; however, the 3-year-rotation had the lowest K concentration compared with the other two rotations.
Acknowledgements
The authors acknowledge the financial support from the Agriculture Experiment Station of the South Dakota State University.
References
- Johnson MG, LevineER, KernJS(1995) Soil organic matter: Distribution, genesis, and management to reduce greenhouse gas emissions. Water Air Soil Pollut 82: 593-615.
- Paustian K, Collins HP, Paul EA(1997) Management controls on soil carbon. In: Paul EA (eds.) Soil Organic Matter in Temperate Ecosystems: Long Term Experiments in North America. CRC Press, Boca Rotan, FL 15-49.
- Logan, TJ, Lal R, Dick WA (1991) Tillage systems and soil properties in North America. Soil and Tillage Research20: 241-270.
- Eltz FLF, Norton LD (1997) Surface roughness changes as affected by rainfall erosivity, tillage, and canopy cover. Soil Sci 61: 1746-1754.
- Follett RF (2001) Soil management concepts and carbon sequestration in cropland soils. Soil Tillage Res 61: 77-92.
- Sainju UM, Singh BP, Whitehead WF, Wang S (2006) Carbon supply and storage in tilled and non-tilled soils as influenced by cover crops and nitrogen fertilization. J Environ Qual 35: 1507-1517.
- Martin-Rueda I, Munoz-Guerra LM, Yunta F, Esteban E, Tenorio JL, et al.(2007) Tillage and crop rotation effects on barley yield and soil nutrients on a CalciortidicHaploxeralf. Soil and Tillage Research92: 1-9.
- Kumar S, Kadono A, Lal R, Dick W (2012) Long-term no-till impacts on organic carbon and properties of two contrasting soils and corn yields in Ohio. Soil Sci Soc Am J 76: 1798-1809.
- Ismail L, BlevinsRL, FryeWW (1994) Long-term no-tillage effects on soil properties and continuous corn yields. Soil Sci Soc Am J 58: 193-198.
- Godsey CB, Pierzynski GM, Mengel DB, Lamond RE (2007) Changes in soil pH, organic carbon, and extractable aluminum from crop rotation and tillage. Soil Sci SocAm J 71: 1038-1044.
- Campbell CA, Myers RJK, Curtin D(1995) Managing nitrogen for sustainable crop production. Fertilizer research42: 277-296.
- Weed DAJ, KanwarRS(1996) Nitrate and water present into continuous corn and flowing from root-zone soil. J Environ Qual 25: 709-719.
- Holanda FSR, Mengel DB, Paula MB, Carvalho JG, Berton JC(1998) Influence of crop rotations and tillage systems on phosphorus and potassium stratifications and root distribution in the soil profile. Commun. Soil Sci Plant Anal 29: 2383-2394.
- Zhou G, Yin X, Verbree DA(2014) Residual effects of potassium to cotton on corn productivity under no-tillage. Agronomy Journal106: 893-903.
- Cruse RM, YakleGA, ColvinTC, TimmonsDR, Mussleman AL(1983) Tillage effects on corn and soybean production in farmer-managed, university-monitored field plots. J Soil Water Conserv 38: 512-514.
- O’Halloran IP, Stewart JWP, De Jong E (1987) Changes in P forms as influenced by management practices. Plant Soil 100: 113-126.
- Robbins SG, Voss RD (1991) Phosphorus and potassium stratification in conservation tillage systems. J Soil Water Conserv 46: 298-300.
- Calonego JC, Rosolem CA(2013) Phosphorus and potassium balance in a corn-soybean rotation under no-till and chiseling. Nutrient Cycling in Agro ecosystems96: 123-131.
- Karlen DL, Berti WR, Hunt PG, Matheny TA(1989) Soil-Test Values after eight years of tillage research on a Norfolk Loamy Sand. Commun. Soil SciPlant Anal 20: 1413-1426.
- Natural Resources and Conservation Service (NRCS) Staff (2015)aOfficial soil series description.
- Natural Resources and Conservation Service (NRCS) Staff (2015) South Dakota online soil survey manuscripts.
- Mikha MM, VigilMF, LiebigMA, BowmanRA, McConkey B, et al. (2006) Cropping system influences on soil chemical properties and soil quality in the Great Plains. Renew Agric Food Syst 21: 26-35.
- Olsen SR, ColeCV, Watanabe FS, Dean LA(1954) Estimation of available phosphorus in soils by extraction with sodium bicarbonate. United States Department of Agriculture Circular 939:18-19.
- Gelderman RH, Beegle D (1998) Nitrate-nitrogen. In: Brown JR (ed.), recommended chemical soil test procedures for the North Central Region. NCR Publ 221: 17-20.Â
- Warncke D, Brown JR(1998) Potassium and other basic cations. In: Brown JR (ed.), recommended chemical soil test procedures for the North Central Region. NCR Publ221: 31-33.
- Carter MR (2005) Long-term effects on cool-season soybean in rotation with barley, soil properties, and carbon and nitrogen storage for fine sandy loams in the humid climate of Atlantic Canada. Soil Tillage Res81: 109-120.
- Junior CC, Corbeels M, Bernoux M, Piccolo MC, Neto MS, et al. (2013) Assessing soil carbon storage rates under no-tillage: Comparing the synchronic and diachronic approaches. Soil and Tillage Research134: 207-212.
- Scopel E, Findeling A, Guerra EC, Corbeels M (2005) Impact of direct sowing mulch-based cropping systems on soil carbon, soil erosion and maize yield. Agronomy for Sustainable Development 25: 425-432.
- Karlen DL, Berry EC, Colvin TS, Kanwar RS(1991) Twelve-year tillage and crop rotation effects on yields and soil chemical properties in northeast Iowa. Communications in Soil Science & Plant Analysis22: 1985-2003.
- Van Eerd LL, Congreves KA, Hayes A, Verhallen A, Hooker DC(2014) Long-term tillage and crop rotation effects on soil quality, organic carbon, and total nitrogen. Canadian Journal of Soil Science 94: 303-315.
- Wyngaard N, EcheverrÃa HE, Rozas HR, Divito GA (2012) Fertilization and tillage effects on soil properties and maize yield in a Southern Pampas Argiudoll. Soil and Tillage Research119: 22-30.
- Deubel A, Hofmann B,Orzessek D(2011) Long-term effects of tillage on stratification and plant availability of phosphate and potassium in a loess chernozem. Soil Tillage Res 117: 85-92.
- Hejcman M, Kunzová E, Šrek P (2012) Sustainability of winter wheat production over 50 years of crop rotation and N, P and K fertilizer application on illimerizedluvisol in the Czech Republic. Field Crops Research 139: 30-38.
- Dao TH (1998) Tillage and crop residue effects on carbon dioxide evolution and carbon storage in a paleustoll. Soil Sci 62: 250-256.
- Carpenter-Boggs L, Pikul JL, VigilMF, Riedell WE(2000) Soil nitrogen mineralization influenced by crop rotation and nitrogen fertilization. Soil Sci Soc Am J 64: 2038-2045.
- Power JF, DoranJW, WilhelmWW (1986) Uptake of nitrogen from soil fertilizer and crop residues by no-till corn and soybean. Soil Sci Soc Am J 50: 137-142.
- Riedell WE, Osborne SL, Pikul JL (2013) Soil Attributes, Soybean Mineral Nutrition, and Yield in Diverse Crop Rotations under No-Till Conditions. Agronomy Journal105: 1231-1236.
Citation: Ibrahim MA, Alhameid AH, Kumar S, Chintala R, Sexton P, et al. (2015) Long-Term Tillage and Crop Rotation Impacts on a Northern Great Plainsmollisol. Adv Crop Sci Tech 3:178. DOI: 10.4172/2329-8863.1000178
Copyright: © 2015 Ibrahim MA, et al. This is an open-access article distributed under the terms of the Creative Commons Attribution License, which permits unrestricted use, distribution, and reproduction in any medium, provided the original author and source are credited.
Select your language of interest to view the total content in your interested language
Share This Article
Recommended Journals
Open Access Journals
Article Tools
Article Usage
- Total views: 16001
- [From(publication date): 8-2015 - Jul 14, 2025]
- Breakdown by view type
- HTML page views: 11349
- PDF downloads: 4652