Modeling Impact of Climate Change and Variability on SorghumProduction in Southern Zone of Tigray, Ethiopia
Received: 02-Dec-2015 / Accepted Date: 10-Dec-2015 / Published Date: 16-Dec-2015 DOI: 10.4172/2157-7617.1000322
Abstract
Even though, there is a general understanding on the impact of climate change and variability on agricultural crops,the spatial and temporal variability of these impacts remains yet uncertain. Thus, modeling the likely impact of climate change on cereal crops at local level is crucial for developing possible future options of adaptation and mitigation strategies. This research was conducted with the objective of modeling the impact of climate change and variability on sorghum production. Hence, calibration and evaluation of agricultural production system simulator (APSIM) model was conducted using four years research data (2006 to 2009) and its performance was assessed using coefficient of determination (r2), root mean square error (RMSE) and index of agreement (d). According to the HadGEM2-ES model, an increase of maximum (5.9°C) and minimum (6.4°C) temperature was revealed in the end term (2080s) over the base year. Similarly precipitation was predicted to increase by 27% in the end term while almost constant for the other periods. The monthly accumulated heat unit was increased in all periods and this has shortened the maturity date of sorghum by about a week compared to the historical. Keeping the current sowing window (April) and other management activities the same, future Sorghum yield has simulated to decrease between 5% and 24%. Using both the historical and predicted climate data, sowing on March followed by April has shown a reasonable yield advantage in both RCPs. The response of the different sorghum cultivars to the future climate changes should further be studied for deciding which cultivar could give a better yield for the future under different management options.
Keywords: GDD; APSIM; HadGEM2-ES; Climate; Modeling
10438Introduction
Agriculture is the source of livelihood to majority of the Ethiopian population and is the basis of the national economy, where small-scale subsistence farming is predominant. This sector employs more than 80% of the labor force and accounts for 45% of the GDP and 85% of the export revenue [1]. Ethiopian agriculture is heavily dependent on natural rainfall, with irrigation agriculture accounting for less than 1% of the country’s total cultivated land. The amount and temporal distribution of rainfall and other climatic factors during the growing season are critical to crop yields and can induce food shortages and famine.
Climate change due to greenhouse gas emissions is expected to increase temperature and alter precipitation patterns which put pressure and uncertainty to crop production in Africa. Crop production in such regions is therefore, expected to become increasingly risky [2].The sensitivity, adaptive capacity and degree of exposure make it agricultural production vulnerable to climate impacts [3]. Besides, 89% of cereals in sub-Saharan Africa are rain fed [4] that makes climate a key driver of food security [5] in the region. There is a growing consensus in the scientific literature that over the coming decades, higher temperature and changing precipitation levels caused by climate change will depress crop yields in many countries [6]. This is particularly crucial in low-income countries, where adaptive capacity is perceived to be low [7]. Many African countries, which have economies largely based on weather-sensitive agricultural production, are particularly vulnerable to climate change [7]. For many poor countries that are highly vulnerable to the effects of climate change, understanding farmers’ responses to climatic variation is crucial in designing appropriate coping strategies to climate change [8].
Human activity is increasing the level of greenhouse gases (GHGs) in the atmosphere, causing changes in weather patterns. Agriculture is also the first to be adversely affected by climate variability and change. Warming of the climate system is unequivocal (IPCC, 2007), moreover, impacts will not be felt evenly and hence, modeling the impacts of climate change, addressing and selecting appropriate agricultural development pathways remains still complex [9]. Not only this but also, the magnitude of climate change impacts depends on the type of crop and growth stage. As crops are phenol typically and genetically different, they respond to changes differently. Agricultural production in arid and semi-arid areas is mostly dominated by a very few cereal crops and hence, is less diversified in crop production. As a result, giving due attention to crops which are importantly grown and produce reasonable yield in such harsh environments is timely indispensable. Hence, this study was designed to evaluate the impact of climate change and variability on Sorghum bicolor L. Moench production in Alamata Wereda. The historical and likely future growing degree days (GDD) of sorghum bicolor under the changing climate and its implication on maturity will be evaluated.
Materials and Methods
Area description
Alamatawereda is located at 12°15’N and 39°35’E which is about 600 km north of Addis Abeba and180 km south of the Tigray Regional capital city, Mekelle. According to office of land use and administration of the Wereda, the total area of the Wereda is about 75,618.7 hectare and of this, 49% is cultivable, 34.4% forest area and 6.3% are miscellaneous land. Majority of Alamata land mass is situated in the lowlands, where flood water deposits a huge amount of silt from the surrounding mountains. As a result, fertile soils in the bottom lands of Alamata are being silted, affecting productivity of many farmlands.
Although use of flood water as a source of spate irrigation is common, when the intensity of the floods increase a significant amount of farmlands becomes out of production. Even with these and other challenges, Alamata remains yet, being the most agriculturally potential areas in the Region. Farmers in the Wereda extensively cultivate cereals, vegetables and rear mainly sheep and cattle in the valley. The surrounding mountains in the Wereda are potential source of runoff to the Alamata valley substantially important for crop growth using irrigation. The major crops grown are sorghum and maize in the lowland areas while, wheat, barley and pulses in the highland part of the Wereda. Shortage of rainfall (moisture stress) is a major constraint of agricultural production in the area.
Research methods
Sorghum is mainly cultivated in the southern, central, western and north western zones of Tigray administrative region. However, Alamatawereda was purposefully selected for this study, because it is one of the predominantly sorghum producing Wereda’s in the region and also is an area where long term (>30 years) climate data was available.
Data collection and preparation
To undertake this research both primary and secondary data has been collected from different sources. As a primary data, soil sample and cultivar specific characteristics such as the common sowing date, sowing depth and density of the crop were collected from farmers and extension agents. Soil profile with a depth of 120 cm was opened from the most dominant soil type of the area and took three (3) soil samples at vertical interval of 40 cm for analysis of its physical properties such as bulk density, permanent wilting point, field capacity, texture (percent of sand, silt and clay) and soil saturation.
Observed climate data (1980 up to 2012) were obtained from the Ethiopian National Metrological Service Agency (NMSA). Future GCM data that were the coupled model inter comparison phase5 (CMIP5) were used from the earth system grid federation (ESGF). A complete set of daily weather data (1980-2010) was obtained from the global bias shifted modern era retrospective analysis for research and applications (MERRA) dataset provided by Alex Ruane (NASA) to fill some missed observed climate data. Simple interpolations were also used to fill short data gaps from neighboring good values (free of strong outliers) on either side. Doing this, “r” scripts were used to prepare delta based downscaled climate scenarios of the study area in formats required by APSIM and other crop models. Folder hierarchy (below directory structure) was prepared for ease of running the agricultural model inter-comparison and improvement project (AgMIP) climate scenario scripts. These scenarios are based on historical baseline daily weather data, with each day’s weather variables perturbed using the changes in climate model outputs for future time periods versus those same model outputs for the historical time period. Even though, there are many GCM outputs in the CMIP5, only HadGEM2-ES climate model was used in this study. On top of this, four years (4) different sorghum parameters (sowing date, flowering, maturity date and grain yield) including the applied management activities were also collected from Alamata agricultural research center for calibration and evaluation of the model.
Model Input Data Preparation
Climate data preparation
Met files of the observed data were prepared in column format in excel according to the model data format requirements. It was also changed to the required file format using the notepad and saved as met file. The constants average ambient (Tav) and average amplitude (Amp) temperatures which are important for running of APSIM were calculated using Tav Amp software and provided to the model. However, GCM climate data’s were changed in to AgMIP format by using the AgMIP tools ADA and QuadUI. To do this, data over lay, seasonal strategy and field survey excel templates were used and the climate data which was prepared in notepad form was given to the model.
Crop, soil and managements
The most common sorghum cultivars which are importantly grown in the Wereda were identified through interviewing of farmers, development agents and crop experts. Accordingly, despite its late maturity and being vulnerable to climate variability, Degalit was the most preferable local Sorghum cultivar in the area. However, due to early maturity, Gigrite is becoming the most commonly sown sorghum cultivar nowadays. It was not even able to get research data for Degalit cultivar and hence, Gigrite sorghum cultivar was used for this study. Hence, inputs for the model about this specific cultivar (such as sowing depth, row spacing, common sowing date of the cultivar and others) were collected and provided to the APSIM model accordingly. Soil water parameters such as bulk density, field capacity, wilting point were also directly provided to the model in the paddock. Beyond the above data, genetic coefficients of sorghum (Table 1) were given to APSIM and hence, calibrate the model accordingly for future simulations.
Soil sample was also taken from the study area and analyzed for its physical properties at Mekelle University soil laboratory. Based on the laboratory results the following soil data (Table 2) were given to the model as an input. However, air dry, KL and XF were used the default values from the APSIM sorghum CERES model.
Method of Data Analysis
Growing degree day (GDD) was computed from daily data’s for the historical (observed) and predicted temperatures using an instant software. The default base temperature of sorghum (5.7°C) and an upper threshold of 35°C were used with none linear temperature through the day. The Agricultural Production Systems simulator (APSIM), which is the robust, process based model that provides sophisticated modules of important field crops were used for modeling of sorghum production. TAV and AMP constants which are the most important inputs for the model were calculated by TAV_AMP software and by using the AgMIP tools ADA and QuadUI. Two climate (RCP 4.5 and RCP 8.5) and four sowing scenarios (March, April, May and June) were used to assess the impact of climate change on Sorghum production in the study area. A sowing window from 1st up to 30th of each month (March, April, May and June) was given for the model to sow after cumulative rainfall amount of 20 mm occurred over three consecutive days. It was achieved by introducing this condition in the sowing rule of the manager file. Sorghum was sown at a planting density of 6 plants per meter square with 75 cm spacing between rows. The amount of nitrogen fertilizer used was 64 kg/ha with no application of irrigation.
The APSIM model was calibrated and evaluated using experimental data (2006 up 2009) obtained from Alamata agricultural research center. Crop parameters such as flowering, maturity date and grain yield were used for calibration and evaluation of the model. Gigrite sorghum cultivar was mainly grown in the study area and hence, used for future simulations. APSIM model does not contain parameters for the local Gigrite sorghum cultivar and hence, it was made to have its own characteristics. After preparing the inputs, the model was run and analyzed the results by excel and GenStat soft ware’s for cumulative density functions (CDFs). Analysis of variance (ANOVA) with LSD mean separation was used at 5% level of significance to assess the difference in yield between base and predicted yield of each scenario. For detecting the impact of climate change on Sorghum, the future simulated yield of each sowing window was computed from its respective historical yield and similarly, as April is the common sowing window in the area, the merit of the remaining three sowings was evaluated using the following formula.
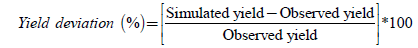 (1)
(1)
Model Calibration and Evaluation
The genetic coefficients (Table 1) were calibrated with crop research data of 2006 and 2008 under optimum growth conditions (no nutrient and water limitation) and with actual weather data. The root mean square error and index of agreement between observed and predicted values were calculated. The genetic coefficients of the crop that achieved the lowest RMSE and the highest index of agreement for the measured parameters was assumed most appropriate for the cultivar (Gigrite) and used for further modeling. Similarly, the performance of the APSIM model in predicting the crop phenology and grain yield was evaluated compared with the observed research data of (2007-2009) using the root mean square error (RMSE), the index of agreement (d) and coefficient of determination (r2).
| Coefficients | Heat units (°C) | Description |
|---|---|---|
| tt_emerg_to_endjuv | 110 | Thermal time from seedling emergence to end of juvenile (°C) |
| tt_flower_to_maturity | 750 | Thermal time accumulation from flowering to maturity (°C) |
| tt_flag_to_flower | 200 | Thermal time accumulation from flag stage to flowering (°C) |
| tt_flower_to_start_grain | 50 | Thermal time from flowering to start of grain filling (°C) |
| TPLA_max | 2.9 | Coefficient of total maximum plant leaf area |
| tpla_prod_coef | 0.031 | curvature coefficient for total plant leaf area |
Table 1: Genetic coefficients used for modeling sorghum in APSIM.
Root mean square error (RMSE)
It quantifies the patterns of similarity by measuring the differences between values predicted by the model and the values actually observed.
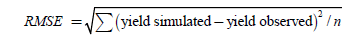 (2)
(2)
Where n is the number of years in which data have collected from an experiment.
Index of agreement (ID)
The agreement of the observed and simulated model (0 ≤ d ≤ 1).
The index of agreement (d) was developed by [10] as a standardized measure of the degree of model prediction error and varies between 0 and 1. A computed value of 1 indicates a perfect agreement between the measured and predicted values, and 0 indicates no agreement at all. The index of agreement represents the ratio between the mean square error and the “potential error” [11]. The author defined potential error as the sum of the squared absolute values of the distances from the predicted values to the mean observed value and distances from the observed values to the mean observed value. The index of agreement can detect additive and proportional differences in the observed and simulated means and variances; however, similar to coefficient of determination, index of agreement is also over sensitive to extreme values due to the squared differences [12]. They suggested a modified index of agreement (d) that is less sensitive to high extreme values because errors and differences are given appropriate weighting by using the absolute value of the difference instead of using the squared differences.
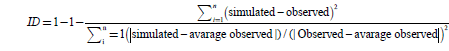 (3)
(3)
Coefficient of determination (r2)
It is the square of correlation coefficient (r) and shows the proportion of the variance of the measured data explained by the model. This was merely computed using the excel Microsoft. It ranges from 0 to 1, with higher values indicating less error variance, and typically values greater than 0.5 are considered acceptable [13,14]. Although coefficient of determination has been widely used for model evaluation, these statistics are over sensitive to extreme values (outliers) and insensitive to additive and proportional differences between model predictions and measured data [12].
Result and Discussion
Projected climate of the study area
According to the model (HadGEM2-ES) rain fall has predicted to increase by 27% from the base period in the end term (2080s) under the RCP 8.5 (Table 3). This increment was mostly in the Belg cropping season. To the other side, there seems no deviation of annual precipitation from the base period in the near and mid-terms in both representative concentration pathways and similarly in the RCP 4.5 end term. Precipitation has been predicted to increase in East Africa by many different models (IPCC, 2007)and this model also consistently predicted rainfall in the area.
| Depth (cm) | DUL | LL mm/mm | KL | Airdry | BD(g/cc) | SAT(mm/mm) | Clay (%) | Silt (%) | Sand (%) | XFmm/mm |
|---|---|---|---|---|---|---|---|---|---|---|
| 40 | 0.35 | 0.12 | 0.10 | 0.27 | 1.02 | 0.55 | 44.4 | 46 | 9.6 | 1 |
| 80 | 0.41 | 0.27 | 0.08 | 0.29 | 1.07 | 0.61 | 50.4 | 38 | 11.6 | 1 |
| 120 | 0.45 | 0.28 | 0.06 | 0.30 | 1.17 | 0.63 | 58.4 | 32 | 9.6 | 1 |
DUL (drainage upper limit and also called field capacity), LL (Lower limit also called permanent wilting point), BD (Bulk density), SAT (saturation point), Air dry, KL (root water extraction) and XF (root extension factor).
Table 2: Soil parameters that were used for modeling of sorghum in APSIM.
| Variables | Near_Term(2010-2039) | Mid_Term(2040-2069) | End_Term(2070-2099) | |||
|---|---|---|---|---|---|---|
| RCP_4.5 | RCP_8.5 | RCP_4.5 | RCP_8.5 | RCP_4.5 | RCP_8.5 | |
| Tmax (°C) | 1.8 | 1.9 | 3.1 | 3.8 | 3.9 | 5.9 |
| Tmin (°C) | 1.6 | 1.9 | 2.9 | 3.8 | 3.7 | 6.4 |
| Rainfall (%) | -1.5 | -1.5 | 0 | 0 | 0.85 | 27 |
RCP- representative concentration pathways.
Table 3: Summarized future changes of rainfall, minimum and maximum temperatures.
Globally temperature is predicted to increase in the future putting its consequences mostly on developing countries which have less adaptive capacity to cope the challenges. Similarly both the minimum and maximum temperatures have increased in a very similar pattern in all periods of each concentration pathways except for the RCP 8.5 (end term) at which the increment of minimum temperature exceeds by 0.5°C over the change of maximum temperature (Table 3). The change of maximum temperature over the base period in the near term was almost the same in both concentration pathways. However, the minimum temperature in the RCP 8.5 has increased by 0.3°C over RCP 4.5 of the same period. In the mid-term, the maximum and minimum temperatures in RCP 8.5 increased by 0.7 and 0.9C respectively from RCP 4.5 of the same period. Similarly in the end term, the maximum and minimum temperatures in RCP 8.5 increased by 2 and 2.7°C respectively from RCP 4.5 of the same period. The difference in temperature between RCP 4.5 and RCP 8.5 with in the same period is due to the elevated concentrations of greenhouse gases (GHGs). Generally, the highest temperature change was predicted for both maximum and minimum temperatures in the end term RCP 8.5 followed by RCP 8.5 midterm and RCP 4.5 end term (Table 3). This temperature could seriously reduce crop yield particularly if it coincides with the reproductive stage of the crops like the flowering stage. The increases in temperature were obvious in the mean annual value, and more importantly, during the growing season. This phenomenon has the potential of shortening the growth cycle of the sorghum variety as its growth duration is controlled by accumulated thermal degree days.
Although C4 plants like sorghum have a higher temperature optimum than C3 plants, photosynthesis is usually inhibited when leaf temperatures exceed about 38°C [15]. Sage and Kubien [16] also stated that climate change will not necessarily favor C4 over C3 plants, because the timing of warming could be more critical than the warming itself. Thus, the timing of temperature increase is very important for the growth and development of the crop. The effect on pollen viability, seed set, and hence yield depends on the magnitude of the temperature event and its duration during the critical developmental window around flag leaf full expansion [17]. According to these authors, the effect of temperatures below 36°C, was very little but became severe if maximum temperature was set to be greater than 38°C. It was very similar to the results of this study that indicates lower yields in the end term which could be as a result of higher temperature (≥ 38°C) occurrence (Figure 1) mainly in the growing season.
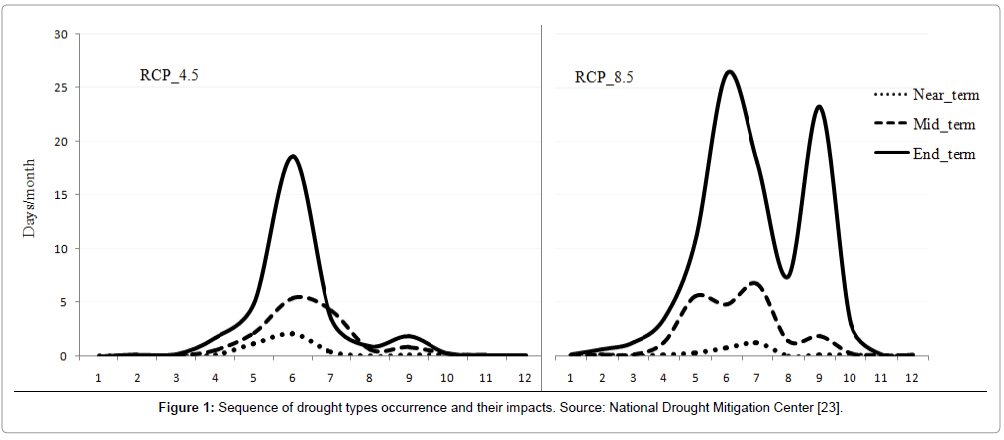
Figure 1: Sequence of drought types occurrence and their impacts. Source: National Drought Mitigation Center [23].
In the base year, the occurrence of maximum temperature (≥ 38°C) was very rare or almost none (Figure 1). Moreover, in the near term, the number of days projected to experience beyond the specified temperature value was almost similar to the base year (very small) in both RCPs, which is unlikely to have an impact on sorghum production in the area. In the midterm, five days were projected to have ≥ 38°C in June and July months for RCP 4.5 and including May in RCP 8.5. If these temperatures happen consecutively at critical growth stages (such as flowering) of the crop it may have a considerable impact on grain yield of the crop. Unlike the other periods, the highest number of days with higher temperatures was projected to occur in the end term (Figure 1). In the end term RCP 4.5 about 18 days were able to demonstrate greater than or equal to 38°C in June. In the RCP 8.5 the occurrence of this event was very high in magnitude and temporal coverage as well. Generally, as the occurrence of higher temperatures was manifested mostly in the end term, more impacts of climate change could be likely in this period. Similarly, Wheeler et al., [18] declared that short episodes of high temperature at critical stages of crop development can impact yield, independent of any substantial changes in mean temperature. Generally, maximum temperature was observed in the main crop production season, while lower temperatures (<5°C) lie outside the crop growing season and hence, the impact on sorghum production could be unlikely from minimum temperatures.
Increase in rainfall in the tail and middle portion of the growing season (especially August, February, March and April (Figure 2) observed for projected climate change scenarios could result in favorable conditions for the early planting of sorghum in the study area. However, in the end term RCP 8.5 and near term RCP 4.5 rainfall was projected to decrease in the Belg season and this could shrink the length of growing period and provide an opportunity for other Meher short season growing crops.
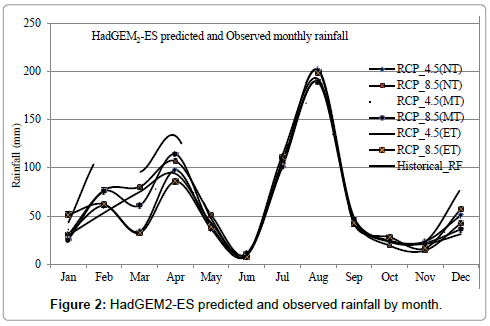
Figure 2: HadGEM2-ES predicted and observed rainfall by month.
The peak of the rainy season for the base and predicted period occurred starting from the end decade of July to the end decade of August (Figure 2). The model has predicted the rainy season to have a similar pattern with the historical rainfall with more variability indicated in the Belg season. Significant decreases in monthly rainfall figures were projected in the future for the months of April, June and September. February and December recorded the highest increase in precipitation (Figure 2).
Growing degree days
The growth of organisms is controlled by temperature as each stage has a unique heat unit requirement. Knowing the heat unit requirement of crops and the possible GDD accumulation in a specific site is very crucial for determining the possible maturity of crops. Accordingly, a base temperature of 5.7°C (lower threshold) and 35°C an upper threshold values was used to compute the growing degree day of the study area for sorghum production. The sine curve which gives a better estimate of the heat accumulation, but uses a more complex calculation than the standard method, was fitted to the maximum and minimum temperature to simulate how the daily temperature would vary and thus, the area under the curve and above the base temperature was then calculated [19].
Using the historical climate data of (1980-2009) the maximum heat accumulation occurs in June 600 heat units (Figure 3). Similarly, in the near term (both RCPs) it peaks on June and July to 650 heat units that was about 50 heat units increment over the historical GDD of June. In the midterm of RCP 4.5 and 8.5 the heat units peaks on May, June and July months. It has on average increased about 100 heat units over the historical heat units. In the end term RCP 4.5 the heat units has exceeded by about 150 units over the historical data particularly on May, June and July months. However, the deviation of heat units in the RCP 4.5 from the historical was similar to the midterm RCP 8.5 (Figure 3). Generally, the highest heat unit accumulation occurs in the main sorghum growing months in all the historical and predicted periods. The predicted increase in heat units has shortened the length of growing period of sorghum in the study area (Table 4).
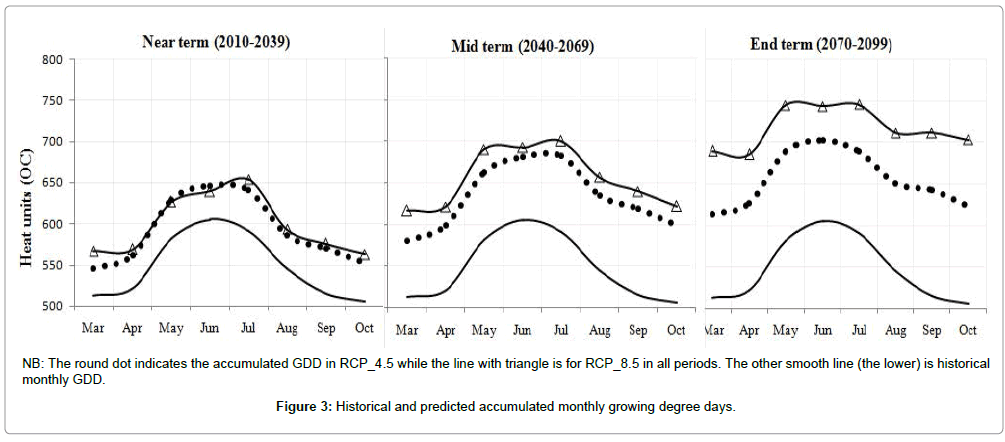
Figure 3: Historical and predicted accumulated monthly growing degree days.
The difference in maturity date between RCP 4.5 and 8.5 was very low (about 2 days) in March and April sowing dates (Table 4) this was also further supported by the very low difference in yield between the two RCPs of all periods. Similarly, for May and June the difference was below one day. This indicates that the increase in temperature on the currently hotter months adds almost nothing on the GDD of sorghum because growth ceases when it goes beyond the upper threshold value of the crop. On average Sorghum maturity has reduced by about a week over the historical maturity date in all periods of both RCPs except the near term RCP 4.5 that reveals lower deviations that is about 5 days (Table 4).
| RCP4.5 | RCP8.5 | ||||||
|---|---|---|---|---|---|---|---|
| Sowing windows | Base year | NT | MT | ET | NT | MT | ET |
| March | 133.7 | 129.3 | 127.1 | 126.2 | 127.3 | 125.1 | 124.0 |
| April | 129.5 | 126.0 | 124.2 | 124.9 | 123.8 | 122.3 | 123.0 |
| May | 129.8 | 126.9 | 126.0 | 126.3 | 125.1 | 124.9 | 128.6 |
| June | 139.2 | 131.5 | 129.6 | 128.3 | 130.7 | 129.5 | 129.3 |
| Mean | 133.0 | 128.4 | 126.7 | 126.4 | 126.7 | 125.5 | 126.2 |
| Deviation from base (days) | -4.6 | -6.3 | -6.6 | -6.3 | -7.5 | -6.8 | |
NB: The NT, MT and ET represents the Near, Mid and End term periods respectively; RCP- representative concentration pathways.
Table 4: Historical and predicted maturity date of sorghum at different sowing dates and RCPs.
Model calibration and evaluation
The APSIM model was calibrated and evaluated using experimental data (2006 up 2009) obtained from Alamata agricultural research center. Cultivar specific crop parameters such as sowing, flowering, and maturity date and grain yield which are critical for calibration and evaluation of the model were available. The sorghum cultivar that mainly grows in the study area (locally called Gigrite) was selected for this study due to the relative availability of research data. However, APSIM model does not contain parameters for this local variety and was not able to agree with the other parameterized sorghum cultivars of the model. Accordingly, it was done to have its own characteristics in the APSIM model and then simulated with certain modification of thermal time requirement. For calibration of the model, research data of 2006 and 2008 which were not used for validation purpose was used. The index of agreement for flowering, maturity and yield were 80%, 80% and 98 % respectively. Moreover, the root mean square errors of these Sorghum parameters were 3 days for flowering, 1 day for maturity and 258 kg ha-1 for yield. This reveals that the agreement between the simulated and observed values of all the sorghum parameters was very good and hence, was convincing in projecting the yield of sorghum using this model.
After calibration process, the performance of the APSIM model in predicting the crop phenology and grain yield was evaluated using the root mean square error (RMSE), coefficient of determination (r2) and the index of agreement (Table 5). The Root mean square error (RMSE) quantifies the patterns of similarity by measuring the differences between values predicted by the model and the values actually observed while index of agreement (d) is a measure of agreement of the observed and simulated model.
| Flowering (DAS) | Maturity (DAS) | Yield (kg/ha) | ||||
|---|---|---|---|---|---|---|
| Year | Observed | Simulated | Observed | Simulated | Observed | Simulated |
| 2007 | 79 | 77 | 132 | 130 | 3235 | 2961 |
| 2008 | 82 | 83 | 136 | 141 | 4088 | 4043 |
| 2009 | 81 | 78 | 132 | 133 | 2481 | 2569 |
| R2 | 0.72 | 0.96 | 0.82 | |||
| RMSE | 1.7 | 2.45 | 130 | |||
| D index | 0.70 | 0.77 | 0.98 | |||
Table 5: Evaluation of model performance in reproducing the observed data.
It is expected for a good simulation to have values of RMSE and “d” as close as possible to 0 and 1 respectively. High values of d close to 1 indicate good model performance and better relationship of observed verses simulated. The index of agreement (d) indicates there was a very good agreement between the simulated and observed data of all parameters (Table 5). Besides, the coefficient of determination which shows the proportion of the explained simulated data by the observed data has revealed a very good agreement and hence, the model can be used for assessing impacts of climate change on sorghum production in the study area.
Impact of climate change on grain yield of sorghum
Apart from the historical data, predicted climate data were also used to simulate grain yield and accordingly evaluate the impact of climate change on yield of each sowing dates. The likely future deviation of yield from the base year yield of each sowing window was summarized in the following (Table 6) below.
| Yield deviations (%) from base period at different sowings | ||||
|---|---|---|---|---|
| Periods and RCP | March | April | May | June |
| NT_rcp_4.5 | 10.3 | 8.6 | 1 | 18.8 |
| NT_rcp_8.5 | 2.7 | 5.3 | 4.1 | 16.5 |
| MT_rcp_4.5 | 14 | 12.2 | 0 | 23.7 |
| MT_rcp_8.5 | 19 | 10.1 | 2.2 | 28 |
| ET_rcp_4.5 | 22.5 | 15.4 | 0 | 27.8 |
| ET_rcp_8.5 | 25 | 23.7 | 16.4 | 30.4 |
NB: NT, MT, ET and RCP represents the near term, mid-term, end term and representative concentration pathways respectively; while the numbers 4.5 and 8.5 are the expected extra energy (energy out of balance) retained due to the greenhouse gas concentrations in the atmosphere. Future yield deviations were computed from the respective historical sowing windows and all the values indicated in the table above are negatives (meaning yield has simulated to reduce in all sowing windows from their respective bases).
Table 6: Impact of climate change on Sorghum yield using the different climate and sowing scenarios.
The impact of climate change on June sowing window was very high (-16.5 to -30.5%) while the reverse on May sowing (0 to -16.4%). On the other side, March (-2.7 to -25%) and April (-5.3 to -23.7%) sowing windows has shown a similar yield deviation from their respective historical sowings (Table 6). The reason why the yield deviation obtained on May sowing was very low could be due to poor establishment of seedlings. This indicates, climate change has already signaled its impacts on May sowing which couldn’t even be greater than what is happening currently for the future. On the contrary, the late sowing (June) was projected to experience more impacts of climate change as rainfall ceases during the critical growth stages of the crop, however, the yield was still better from May sowing.
Apart from this, Analysis of variance (ANOVA) with 5% level of significance was used to see if there was a statistically significant difference between the base year yield and the other two RCPs of each period at different sowing time and LSD was used for mean separation of variables (Figure 4). Consequently, all sowing dates in both RCPs except May revealed that the reduction of yield over the base period was significant in the end term. March and June also demonstrated a statistically significant yield reduction in the mid-term, while no yield difference in April and May from the base year. Moreover, in the near term, only June has shown a statistically significant yield reduction over the base year in both concentration pathways. Generally, there was no statistically significant yield difference between both RCPs of the same period in all sowing dates (Figure 4).
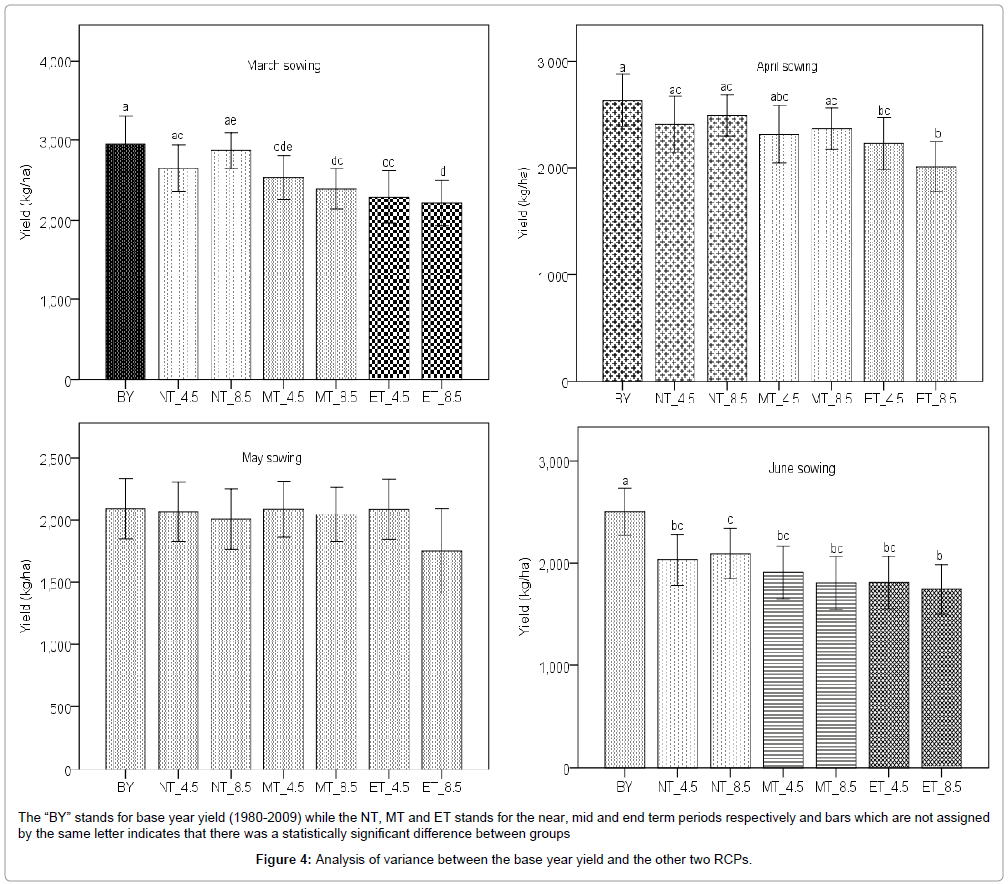
Figure 4: Analysis of variance between the base year yield and the other two RCPs.
Besides the above analysis, using the June sowing window, in all periods (near, mid and end terms) and both RCPs (4.5 and 8.5) yield has significantly reduced from the base year. The yield difference between near and end term of RCP8.5 was statistically significant (p=0.044). In April sowing, there was a significant yield difference between all periods and both RCPs except between the RCPs of end term (p=0.185) and similarly between the end term RCP 8.5 and mid-term 4.5 (p=0.65). In March showing, there was no statistically significant yield difference between the base year and both RCPs of the near term. There was a significant difference in yield of near term RCP8.5 compared to the midterm RCP 8.5, end term RCPs of 4.5 and 8.5. However, no statistically significant difference (p=0.44) was observed between the base year yield and all other periods and both RCPs of May sowing. As discussed in the historical yield, the probability of getting the lowest yield was on May sowing (Figure 5) and this shows the impact of climate change on this sowing window will not be as worsen as currently. Even though, the impact of climate change seems to remain unchanged over the base year production, the current yield return from May sowing window was very low compared to the other sowings (March, April and June) which even experience higher climate change impacts. As a result, May was not an appropriate sowing date for sorghum production in the study area.
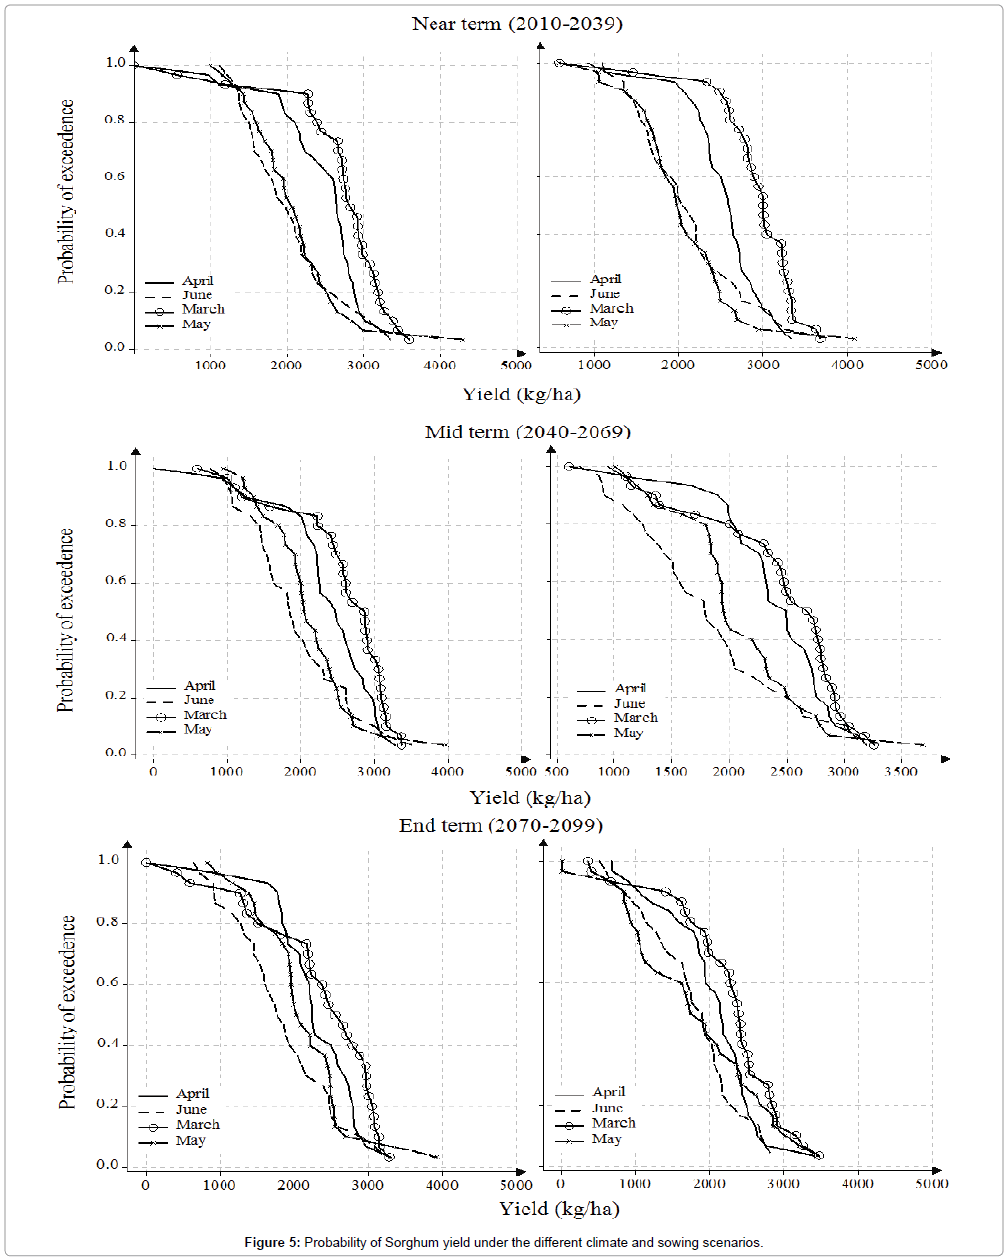
Figure 5: Probability of Sorghum yield under the different climate and sowing scenarios.
In all near, mid and end term periods, figures from the left and right indicate RCP 4.5 and RCP 8.5 respectively, in the near term, using the June and May sowing windows, the probability of getting 2000 kg/ ha was about 50% in RCP 4.5 while 40% for RCP8.5 of the same period on May sowing (Figure 5). This has declared that the probability of getting 2000 kg/ha in the near term has reduced from 60% to 50% on May and from 80% to about 50% on June over the base year. However, the probability of getting the same amount of yield was maintained for the near term RCP 4.5 of March and April sowing periods. In the RCP 8.5 of April sowing, the probability has increased from 80% (base year) to about 90%. The probability of 3000 kg/ha in the near term RCP 4.5 was about 30% which reduced by halve from the base year. Similarly for RCP 8.5 the probability has reduced by 20% from the base period. To the other side, the probability of 2500 kg/ha has increased to about 90% in both RCPs of March and April sowing (Figure 5).
In the midterm, the probability of getting 2000 kg/ha of yield in both RCPs of June and May sowing was about 40% which was similar to the near term. However, probabilities for 1500 kg/ha has reduced from the base period and somehow from the near term. The probability of getting 3000 kg/ha of yield has almost changed to history in this term, particularly the midterm RCP 8.5 which dropped from 60% (base March) to below 20% probability while to about 30% in the RCP 4.5 midterm. In addition, the probability of getting 2500 kg/ha has reduced from the base while generally increased for April sowing (Figure 5).
Similar to the midterm RCP 8.5, the 3000 kg/ha yield probability of both RCPs of the end term have fall below 20%. Moreover, the probability of getting 2000 kg/ha of yield was 40% in both RCPs for June sowing window. In this term, the variation in yield due to shifting of sowing dates seems to become of less important. This threatens the sustainable production of sorghum in the area and puts pressure on the small holder farmers.
Impact of sowing date on grain yield of sorghum
In the study area, April is the most and common sowing period of sorghum while some on March and May. Accordingly, the historical impact of climate change was evaluated based on these showing windows. Once the model (APSIM) was calibrated and evaluated using the observed research data’s, it was run for producing the historical yield using the historical climate data (1980-2009). The highest mean yield was obtained in March (3054.5 kg/ha) followed by April (2630 kg/ ha), June (2504 kg/ha) and May (2092.5 kg/ha) sowing windows (Figure 6). Besides the lowest yield of May, there was also the highest coefficient of variation (31.5%) compared to March (25.3%), April (24.6%) and June (24.4%) sowings which have similar and less variability. This states that sowing on May has high inter annual variability of yield.
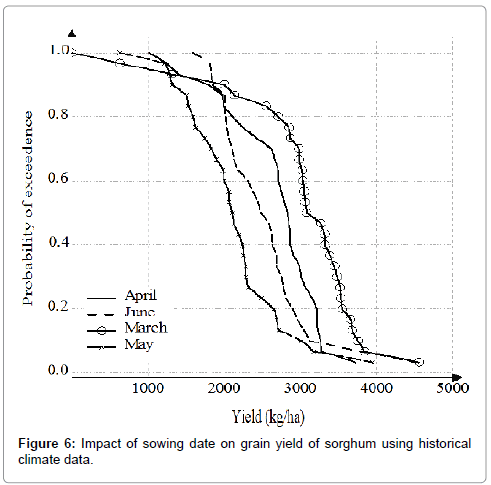
Figure 6: Impact of sowing date on grain yield of sorghum using historical climate data.
Even though it is mostly uncommon practice, sowing sorghum on March in the study area revealed the highest probability of obtaining better yields (Figure 6). With the same risk of probability (40%), sowing on March has 10 quintal yield advantage over May sowing. Moreover, the probability of getting 2000 kg/ha was 80% both on April and June sowings, while it was about 2800 kg/ha for March sowing at the same probability. The probability of getting 2000 kg/ha in May sowing was low (40%) which indicates many different adaptation strategies that minimize the impact should be undertaken to get this yield and hence, incurs more cost of adaptation which may be difficult for small holder farmers. Generally, while the probability of getting below 2000 kg/ha was safe, getting 3000 kg/ha and above yield was almost none (>70% risky) for all sowing dates except March (60%) that indicates the highest probability with some adaptation strategies.
Apart from the analysis of historical yield of each sowing windows, the projected climate data of the area was also used to simulate future grain yield of sorghum and hence, recommend the best sowing window accordingly. This was undertaken by computing the deviation of each yield obtained in each sowing window from the common sowing window (i.e. April) of the area (Table 7).
| Periods and RCPs | Sowing windows and yield deviations (%) | |||
|---|---|---|---|---|
| March | April | May | June | |
| NT_rcp4.5 | 0.7 | -8.6 | -21.3 | -22.7 |
| NT_rcp8.5 | 9.2 | -5.3 | -23.7 | -20.5 |
| MT_rcp4.5 | -3.4 | -12.2 | -20.6 | -27.4 |
| MT_rcp8.5 | -9.1 | -10.1 | -22.2 | -31.4 |
| ET_rcp4.5 | -13.0 | -15.4 | -20.6 | -31.2 |
| ET_rcp8.5 | -15.8 | -23.7 | -33.4 | -33.7 |
| Historical | 12.3 | - | -20.4 | -4.8 |
| Yield Deviation (%) | 0.7 to -16% | -5.3 to -24% | -20.6 to -33.4% | -20.5 to -34% |
Where: NT, MT and ET stands’ for the near (2010-2039), mid (2040-2069) and end term (2070-2099) periods; RCP- representative concentration pathways.
Table 7: Impact of sowing date on future grain yield of sorghum.
Using the historical climate data, May and June sowing windows indicated lower yields compared to the common sowing window (April). However, March sowing has 12.3% yield advantage over April sowing window. Keeping other factors constant, if April sowing window continues for the future, there will be a 5 to 24% yield reduction from its historical (Table 7). Similar results have been presented for Sub Sahara Africa (47% to -7%) and Zimbabwe (-22%) by Elodie [20] and John et al., [21] for the end term. Hence, an alternative sowing window which provides better yield in the future was assessed through using the projected climate data. Accordingly, May and June sowing windows revealed the highest yield reduction, while March followed by April has shown the least yield deviation from April showing window [22].
Conclusion
The yielding ability of crops is determined by genotype and the environment where it is used to grow. Climate, particularly rainfall and temperature are the limiting environmental factors of yield. The variability or total shift in mean of these and other climate parameters could put its signal on the yield return of crops. The HadGEM2- ES model has predicted an increase of maximum and minimum temperature in all periods with the highest in the end term RCP 8.5. Precipitation similarly predicted to increase by 27% over the base in this period. Even though the highest maximum and minimum temperature are predicted in the end term its impacts on crop production could reduce by the predicted increase in precipitation. The precipitation (rainfall?) in the remaining periods was predicted to be almost the same with the historical data and hence, the increase in temperature in these periods could induce a significant impact on crop production. The growing degree day which is the most important factor for estimating maturity of crops was found the highest in June for the base period while it includes May and July for the other periods. The GDD has shown a significant increase over the base and consequently maturity of sorghum has shortened by about a week.
In modeling sorghum production, APSIM has sufficiently able to reproduce the observed data and hence, was found convincing in using this model for predicting the impact of climate change. This was approved by measuring the performance of the model using coefficient of determination, root mean square error and index of agreement. In the area, April is the most common sowing window of sorghum used by the farmers and as a result, the likely future impact of using this planting window was evaluated and found better than May and June sowing windows. However, March planting window has indicated a better yield than April in both the historical and predicted climate scenarios. Even though the impact of climate change was higher in March compared to May and April, it was this planting window that provide reasonably better yield than the others. This was also strengthened by the significant shortening of the growing season particularly September and hence, sowing one month earlier provides better yield than delaying. Even though, the impact of climate change on March sowing was greater than April and May, it was found better in providing a reasonable yield in all periods. An important implication of this analysis was that adoption of shorter duration rather than longer duration sorghum cultivars seems an important response in dealing with the main effects of climate change.
References
- MoFED (2006) Ministry of Finance and Economic Development (2006) Survey of the Ethiopian economy, MoFED, Addis Ababa.
- SlingoJ, Challinor AJ, Hoskins BJ, Wheeler R(2005) Introduction, food crops in a changing climate. Philos Trans R SocLond 360:1983-1989.
- IPCC (2001) Climate Chang, Synthesis report. Cambridge University Press. Cambridge.
- Cooper P(2004) Coping with climatic variability and adapting to climate change: rural water management in dry-land areas. International Development Research Centre, London.
- VerdinJ, Funk C, Senay G, Choularton R (2005) Climate science and famine early warning. J Philosophical transactions B 360:2155-2168.
- Orindi V, Ochieng A, Otiende B, Bhadwal S, Anantram K, et al. (2006) Mapping climate vulnerability and poverty in Africa.
- IPCC (2007) Summaryfor policymakers. Climate change 2007: the physical science basis, Working Group I contribution to IPCC fourth assessment report.
- Ringler SD (2011) Estimating the Impact of Climate Change on Agriculture in Low-Income Countries: Household Level Evidence from the Nile Basin, Ethiopia.
- Richard L, Nelson V (2011) Emerging approaches for responding to climate change in African agricultural advisory services, African Forum for Agricultural Advisory Services, Kampala, Uganda.
- Willmott CJ (1984) On the evaluation of model performance in physical geography. in Spatial Statistics 40:443-460.
- Legates DR, McCabeGJ (1999) Evaluating the use of “goodness-of-fit†measures in hydrologic and hydroclimatic model validation Water Resources Research 35: 233-241.
- Santhi CJ, Arnold JR, Dugas R, Srinivasan LM, Hauck(2001) Validation of the SWAT model on a large river basin with point and nonpoint sources. J. American Water Resources Association 37:1169-1188.
- Van Liew MW, Arnold JG, Garbrecht JD(2003) Hydrologic simulation on agricultural watersheds: Choosing between two models 46:1539-1551.
- Crafts B, Salvucci SJ (2002) Sensitivity of photosynthesis in a C4 plant, maize, to heat stress. Plant Physiology 129:1773-1780.
- Sage RF, Kubien DS (2007) The temperature response of C3 and C4 photosynthesis. Plant, Cell & Environment 30:1086-1106.
- Hammer GL, Cooper MC, Tardieu FT, WelchSW, Walsh BM, et al. (2006) Models for navigating biological complexity in breeding improved crop plants. Trends Plant Science 11:587-593.
- Wheeler TR, Craufurd PQ, Ellis RH, Porter JR, Prasad PV (2006) Temperature variability and the yield of annual crops. AgricEcosyst Environ 82:159-167.
- Fraisse CW, Bellow J, Brown C (2011) Degree Days: Heating, Cooling and Growing.
- Elodie B (2012) The Impact of Climate Change on Crop Yields in Sub-Saharan Africa, Joint Program on the Science and Policy of Global Change, Massachusetts Institute ofTechnology, Cambridge, USA 1:1-13.
- John D, Peter C, KPC Rao (2008) Climate change impact on crop productivity in the semi-arid tropics of Zimbabwe in the 21st century, ICRISAT.
- Evrendilek F, WaliMK(2001)Modelling long-term C dynamics in croplands in the context of climate change: a case study from Ohio. Environmental Modelling& Software 16: 361-375.
Citation: Gebrekiros G, Araya A, Yemane T (2016) Modeling Impact of Climate Change and Variability on Sorghum Production in Southern Zone of Tigray, Ethiopia. J Earth Sci Clim Change. 7:322. DOI: 10.4172/2157-7617.1000322
Copyright: © 2016 Gebrekiros G, et al. This is an open-access article distributed under the terms of the Creative Commons Attribution License, which permits unrestricted use, distribution, and reproduction in any medium, provided the original author and source are credited.
Select your language of interest to view the total content in your interested language
Share This Article
Recommended Journals
Open Access Journals
Article Tools
Article Usage
- Total views: 13598
- [From(publication date): 1-2016 - Jul 12, 2025]
- Breakdown by view type
- HTML page views: 12307
- PDF downloads: 1291