Modeling of Acute Rectal Toxicity to Compare Two Patient Positioning Methods for Prostate Cancer Radiotherapy: Can Toxicity Modeling be Used for Quality Assurance?
Received: 26-Oct-2018 / Accepted Date: 26-Nov-2018 / Published Date: 03-Dec-2018 DOI: 10.4172/2167-7964.1000302
Abstract
Purpose: Intensity Modulated Radiation Therapy (IMRT) allows for significant dose reductions to organs at risk in prostate cancer patients. However, the accurate delivery of IMRT plans can be compromised by patient positioning errors. The purpose of this study was to determine if the modeling of grade ≥ 2 acute rectal toxicity could be used to monitor the quality of IMRT protocols.
Materials and Methods: 79 patients treated with Image and Fiducial Markers Guided IMRT (FMIGRT) and 302 patients treated with trans-abdominal ultrasound guided IMRT (USGRT) was selected for this study. Treatment plans were available for the FMIGRT group, and hand recorded dosimetric indices were available for both groups. We modeled toxicity in the FMIGRT group using the Lyman Kutcher Burman (LKB) and Univariate Logistic Regression (ULR) models, and we modeled toxicity in USGRT group using the ULR model. We performed Receiver Operating Characteristics (ROC) analysis on all of the models and compared the Area under the ROC curve (AUC) for the FMIGRT and the USGRT groups.
Results: The observed Incidence of grade ≥ 2 rectal toxicity was 20% in FMIGRT patients and 54% in USGRT patients. LKB model parameters in the FMIGRT group were TD50=56.8 Gy, slope m=0.093, and exponent n=0.131. The most predictive indices in the ULR model for the FMIGRT group were D25% and V50 Gy. AUC for both models in the FMIGRT group was similar (AUC=0.67). The FMIGRT URL model predicted less than a 37% incidence of grade ≥ 2 acute rectal toxicity in the USGRT group. A fit of the ULR model to USGRT data did not yield a predictive model (AUC=0.5).
Conclusion: Modeling of acute rectal toxicity provided a quantitative measure of the correlation between planning dosimetry and this clinical endpoint. Our study suggests that an unusually weak correlation may indicate a persistent patient positioning error.
Keywords: Prostate cancer; Ultrasound; Fiducial markers; Rectal toxicity; Modeling
Abbreviations
FMIGRT: Fiducial Markers Guided IMRT; IMRT: Intensity Modulated Radiation Therapy; USGRT: Ultrasound Guided IMRT; LKB: Lyman Kutcher Burman; ULR: Univariate Logistic Regression; ROC: Receiver Operating Characteristics; AUC: Area Under the ROC Curve; CTV: Clinical Tumor Volume; PTV: Planning Tumor Volumes; SIB: Simultaneous Integrated Boost; TPS: Treatment Planning System; ESAPI: Eclipse Application Programmers Interface; MLE: Maximum Likelihood Estimation
Introduction
Accurate assessment of the effectiveness of radiation therapy is increasingly important due to recent technological trends towards more conformal techniques that provide improved dose distributions and enable dose escalation and hypo-fractionation. The technical ability to deliver highly conformal dose distributions brings significant benefits to patients but also creates challenges during the delivery of radiation therapy as errors in daily positioning of patients can lead to clinically significant differences between planned and delivered dose distributions [1-4]. Recent trends towards hypo-fractionation [5-7] exacerbate these concerns because delivering therapeutic doses in fewer but larger fractions reduces the opportunities for averaging of delivery errors over a treatment course.
The best available method of ensuring that planned dose distributions are clinically delivered combines rigorous patient immobilization with daily kilo voltage imaging [8,9]. The accuracy of imaging protocols has been studied extensively and assessments of residual positioning errors can be found in the literature [1-3,8,10]. However, such assessments are based on research protocols which may not fully reflect the reality of a routine clinical practice due to time pressures and personnel training issues that may not be present in a research project.
The goal of the present study was to investigate whether the modeling of grade ≥ 2 acute rectal toxicity in prostate treatments could be used as a tool to assess the accuracy of the clinical delivery of radiation therapy for prostate cancer. Modeling of toxicity is done under the assumption that planned dose distributions closely approximate clinically delivered dose distributions. If planned and delivered dose distributions are correlated one expects to observe a correlation between planned dosimetry and toxicity. If the quality of the clinical delivery of treatments is degraded however, the correlation between planned dosimetry and clinically observed toxicity could also be diminished.
To achieve the goal of the study we compared grade ≥ 2 acute rectal toxicity in two databases of prostate cancer patients who were treated with IMRT at our institution. The first group of 79 patients was treated with 7 field IMRT and daily patient positioning using image guidance with implanted gold seed markers (FMIGRT) [11]. The second group of 302 patients was treated with 5 field IMRT and daily patient positioning using less accurate trans-abdominal ultrasound system (USGRT) [12,13]. We modelled acute rectal toxicity in both groups to determine if differences in the incidence of acute rectal toxicity could be explained by differences in planning dosimetry alone and whether predictive models of grade ≥ 2 acute rectal toxicity could be derived for both groups. By choosing acute, rather than late, rectal toxicity we aimed to reduce the minimum number of patients needed to perform the analysis as acute toxicity is more commonly observed and can be assessed without a lengthy follow up period.
Materials and Methods
Patients
The first group of 302 patients was treated between 2000 and 2005 on IRB approved protocol using 5 Field IMRT technique and daily patient positioning using abdominal ultrasound technique (BAT system, NOMOS Corp) [13]. The second group of 79 patients was treated between 2009 and 2012 on IRB approved protocol using 7 field IMRT technique and daily patient positioning using X-ray imaging and implanted fiducial markers [11]. Both protocols were carried out by the same group of physicians, dosimetrists and physicists. Patient characteristics are summarized in Table 1.
| Treatment years | 2000-2005 | 2009-2012 |
|---|---|---|
| Patient Positioning Technique | Trans-abdominal Ultrasound USGRT |
Kilovoltage imaging + gold markers FMIGRT |
| Number of Patients | N=302 | N=79 |
| Age [years] | 74.3 ± 5.6 | 74.9 ± 7 |
| Follow up time [months] | 68.7 ± 33.1 [4–138.4] |
23.7 ± 13.4 [3–55.3] |
| Prostate Volume [ccm] | 78.9 ± 32.0 | 75.3 ± 26.6 |
| Baseline PSA | 9.1 ± 8.0 | 8.6 ± 6.7 |
| Hormones [%] | 35% | 42% |
| Gleason ≥ 6 [%] | 56% | 69% |
| Gleason ≥ 8 [%] | 17.6% | 18.4% |
| T stage > T2a [%] | 25.5% | 39.9% |
| Fraction with more than 33% of positive biopsy cores [%] | 53.7% | 46.8% |
| Fraction with highest NCCN score [%] | 22.5% | 23.2% |
| Treatment Technique | 5 field IMRT | 7 field IMRT |
| Dose Prescription | 75.6 Gy / 42 fx to whole prostate | 77.4 Gy / 43 fx to whole prostate boost to prostate sub-volume identified by MRI: 5.1 Gy (mean) [2.6 Gy, 5.6 Gy] (range) |
| Rectum Indices | ||
| Max Dose | 79.5 ± 1.2 Gy | 81.2 ± 1.2 Gy |
| D1.8% | 75.4 ± 4.4 Gy | 77.5 ± 1.7 Gy |
| D10% | 68.4 ± 5.2 Gy | 65.0 ± 5.9 Gy |
| D30% | 52.5 ± 6.6 Gy | 42.4 ± 6.6 Gy |
| D40% | 47.4 ± 6.6 Gy | 34.5 ± 7.6 Gy |
| Mean Dose | 42.1 ± 6.7 Gy | 33.3 ± 5.9 Gy |
| Acute Rectal Toxicity | ||
| Grade 0 | 18.2% (N=55) |
29.1% (N=23) |
| Grade 1 | 28.2% (N=85) |
50.6% (N=40) |
| Grade 2 | 53% (N=160) |
20.3% (N=16) |
| Grade 3 | 0.7% (N=2) |
0% (N=0) |
| Late Rectal Toxicity | ||
| Grade 0 | 59.6% (N=180) |
86.1% (N=68) |
| Grade 1 | 28.2% (N=85) |
10.1% (N=8) |
| Grade 2 | 11.3% (N=34) |
3.8% (N=3) |
| Grade 3 | 1% (N=3) |
0% (N=0) |
Table 1: Patient characteristic, treatment planning details and incidence of grade ≥ 2 acute rectal toxicity.
Treatment planning and dose prescription
The whole prostate was designated as a Clinical tumor volume (CTV) and two planning tumor volumes (PTV) were created using uniform 3 mm (PTV1) and 6 mm (PTV2) expansions. The group of 302 patients was treated with 5 field IMRT technique, dose of 75.6 Gy to PTV1 and 70 Gy to PTV2, delivered in 42 fractions. The group of 79 patients was treated with 7 field IMRT technique, dose of 77.4 Gy to PTV1, 70 Gy to PTV2, and simultaneous integrated boost (SIB) to areas suspicious of cancer as demonstrated in a planning multi-parametric magnetic resonance scan which was a combination of T2-weighted imaging, diffusion weighted imaging, and dynamic contrast enhanced imaging [11]. The SIB volume was identified by a diagnostic radiologist specializing in genitourinary imaging, was not expanded, and was prescribed 81-83 Gy. The rectum was drawn as a whole organ bounded by ischial tuberosity inferiorily and sigmoid flexure superiorily. The 302 patients were planned using Corvus Treatment Planning System (TPS) by Nomos, Inc, while 79 patients were planned using Eclipse TPS by Varian, Inc. Six rectal DVH indices were manually recorded during treatment planning for all patients: Maximum Dose, Mean Dose, D1.8%, D10%, D30%, D40%.Treatment plans were preserved for 79 patients whose treatments were planned with the Eclipse TPS and their dosimetric information was extracted for the purpose of the present study using Eclipse Application Programmers Interface (ESAPI). Summary of selected treatment planning information is shown in Table 1.
Toxicity modeling
Acute rectal toxicity was scored using CTCAEv4 criteria by experienced physicians. Acute toxicity was defined as toxicity recorded during treatment or within the first 90 days immediately following the treatment.
For the group of 79 patients whose treatment plans were fully preserved we used both the Lyman-Kutcher-Burman (LKB) [14,15] and Univariate Logistic Regression (ULR) models [16]. The LKB model has been used extensively in the past to model late [17] and acute [18] rectal toxicity in prostate cancer treatments, while the ULR model was based on standard dosimetric indices and could therefore be used to compare the two databases.
A standard formulation of the LKB model was used [17]:
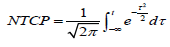

Where TD50, m, n were adjustable parameters of the model
The ULR model was formulated as follows:
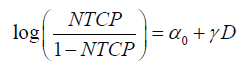
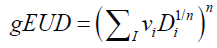
Where D is a standard dosimetric variable such as V%D, which is a volume fraction that receives a dose D or greater, or DX% which is the lowest dose received by the volume fraction X% and parameters α0 and γ are parameters of the model. We used a Maximum Likelihood Estimation (MLE) technique and specifically the Nelder-Mead method [19] that has been implemented in the statistical software, “R” [20] The asymptotic theorem of MLE [21] was used to calculate confidence intervals.
We used planning DVHs in the database of 79 patients to fit a family of URL models which spanned a wide range of dosimetric indices which are typically used in treatment planning. We performed the Receiver Operating Characteristics (ROC) analysis for each model and selected the model with the largest area under the ROC curve (AUC) as the “optimum dosimetric index” which is the best predictor of acute rectal toxicity. We fit the ULR models to manually extracted indices and compared the AUC of these models to the AUC of models which relied on the full DVH information. A comparison of AUCs obtained with DVHs and with hand extracted indices was a practical measure of biases which could be introduced by the manual extraction of dosimetric indices during treatment planning.
We applied the ULR model obtained with the database of FMIGRT patients to indices stored in the database of USGRT patients and calculated the expected incidence of acute rectal toxicity for this group of patients, which we compared to the actually observed incidence. We performed a fit of the ULR model to indices stored in the database of the USGRT patients. The ROC analysis was performed for each model and the AUC of the model was compared to the AUC obtained in the database of 79 patients.
A statistical technique called Power Analysis [22] was used to estimate the likelihood that a correlation between planning dosimetry and toxicity would not be detected if one was present.
Model fitting that utilized full dosimetry of FMIGRT patients included dose corrections to 2 Gy dose equivalent in accordance with QUANTEC report [17], using  ratio of 3 Gy. We used a voxel-by-voxel correction which corrected the dose in each voxel that belonged to the rectum to the 2 Gy equivalent dose. Fitting of the ULR models which relied on hand-extracted DVH indices did not include dose corrections.
We used 79 FMIGRT patients to simulate a systematic patient setup error which would displace the isocenter posteriorly by the distance of 5 mm. For each patient the dose was recalculated and the ULR model was used to estimate the expected increase in the incidence of acute rectal toxicity relative to unperturbed treatment plan. Based on the simulated NTCP values we generated synthetic toxicity data which would have been expected in clinical data if this systematic patient setup error was occurring for every patient. We then performed a fit of the ULR model using treatment planning dosimetry and synthetic toxicity data. No random setup error was included in this simulation.
Results
The incidence of acute and late rectal toxicity is summarized in Table 1. The incidence of grade ≥ 2 rectal toxicity, acute and late, was approximately three times higher in USGRT patients when compared to FMIGRT patients.
Parameters of the fit of FMIGRT patient data to the LKB model are shown in Table 2. The values of dose-volume parameters of the model (m, n) and of the AUC were similar to the values typically found in the literature for studies that modeled late rectal toxicity [17]. As an additional, practical verification of this similarity we performed ROC analysis of the QUANTEC model when applied to acute rectal toxicity in our FMIGRT data. The AUC of the model was also 0.67 (Table 2), which demonstrated that the model predicted a relative risk of acute rectal toxicity equally well as our own fit. The QUANTEC model predicted a 3.5% incidence of grade ≥ 2 late rectal toxicity in our FMIGRT data which was qualitatively consistent with the observed late toxicity (Table 2), though with a large margin of error due to small patient numbers. Because of a relatively small number of patients in the FMIGRT group we tested the robustness of the LKB fit by the statistical oversampling technique. Parameters of the fit remained within their error intervals while the minority class was doubled, tripled, and quadrupled. Since it has been previously reported that acute rectal toxicity may depend on mean rectal dose [18] we tested the robustness of the LKB fit when the gEUD exponent (parameter ‘n’ in Table 2) was set to n=1. The ROC analysis of the modified fit showed that the AUC of the model decreased from 0.67 to 0.56 and the confidence interval no longer excluded 0.5 which strongly suggests that the model favors n<1.
| TD50 | m | n | AUC | |
|---|---|---|---|---|
| Acute Toxicity | 56.8 [53.7, 59.9] |
0.093 [0.077, 0.108] |
0.131 [0.099, 0.163] |
0.67 [0.54, 0.80] |
| QUANTEC | 76.9 [73.7, 80.1] |
0.13 [0.10, 0.17] |
0.09 [0.04, 0.14] |
0.67 [0.54, 0.81] |
Table 2: Parameters and 95% confidence intervals of the LKB model obtained with DVHs for FMIGRT patients, describing grade ≥ 2 acute rectal toxicity. QUANTEC late rectal toxicity model is shown for comparison with the AUC obtained when QUANTEC model was applied to acute rectal toxicity data in this work.
Results of the search for the “optimum index” in the ULR model are summarized in Figures 1 and 2 and Table 3. These results qualitatively agreed with the LKB model, indicating that medium to high doses, applied to small volumes, were most predictive for acute rectal toxicity (corresponding to n<1 in the LKB model). The AUC of the “optimum” ULR model was 0.66, also similar to the LKB model. The optimum indices were determined to be D25% and V50 Gy.

Figure 1: The dependence of AUC of the ULR model on the dosimetric index. The analysis was performed on DVHs of FMIGRT patients. The optimum index was D25% and with the AUC=0.66; Dose in 2 Gy equivalent units.

Figure 2: The dependence of the fit quality p-value (maximum likelihood ratio) of the ULR model on the dosimetric index. The analysis was performed on DVHs of FMIGRT patients. The optimum index was D20% with the p-value = 0.04; Dose in 2 Gy equivalent units.
| D25% |  |
| α0 | -5.23 [-9.93, -1.40] P=0.015 |
| γ | 0.098 [0.002, 0.212] P=0.064 |
| AUC | 0.66 [0.49, 0.76] |
Table 3: parameters of the ULR model for the “optimum” index with the highest AUC.
| D1.8% | D10% | D30% | D40% | |
|---|---|---|---|---|
| AUC DVH based indices |
0.63 [0.48.0.78] P=0.038 |
0.64 [0.51,0.77] P=0.046 |
0.63 [0.47,0.77] P=0.084 |
0.58 [0.43,0.74] P=0.316 |
| AUC recorded indices |
0.63 [0.48.0.78] P=0.037 |
0.58 [0.43,0.72] P=0.045 |
0.62 [0.47,0.77] P=0.084 |
0.58 [0.43,0.74] P=0.317 |
| Cross estimate of toxicity incidence | 28% | 20% | 20% | 20% |
| Actual toxicity incidence | 20% | |||
Table 4: A comparison of ULR modeling results based on full DVH and on recorded indices in FMIGRT patients. AUC rows show results of independent ULR modeling based on DVH and on recorded indices. Cross estimate of toxicity incidence was obtained by applying the ULR model derived from DVHs to recorded indices.
A comparison of toxicity modelling based on DVHs and on manually extracted indices for FMIGRT patients is summarized in Table 4. The AUCs of respective models were comparable. When DVH based ULR models were applied to recorded indices the predicted incidence of toxicity was consistent with the observed incidence, with an exception of d1.8% for which the incidence was over predicted.
The comparison between FMIGRT and USGRT databases is summarized in Table 5. The estimated incidence of grade ≥ 2 acute rectal toxicity in USGRT database ranged from 12% to 37%. The observed incidence of acute rectal toxicity in USGRT patients was 54%. The last two columns compare AUC of ULR models which were fit to recorded indices in both databases. One observes that ULR models were predictive in FMIGRT database, and non-predictive in the USGRT database in spite of the significantly higher number of patients in the USGRT database.
| Mean Index Value FMIGRT | Mean Index Value USGRT | Estimated incidence of acute rectal toxicity in USGRT | Observed incidence of acute rectal toxicity in USGRT | AUC and Fit Quality (based on recorded indices) FMIGRT | AUC and Fit Quality (based on recorded indices) USGRT | |
|---|---|---|---|---|---|---|
| D1.8% | 77.5 ± 1.7 Gy | 75.4 ± 4.4 Gy | 12% | 54% | 0.63 | 0.54 |
| [0.48.0.78] | [0.47,0.6] | |||||
| P=0.037 | P=0.8 | |||||
| D10% | 64.9 ± 5.8 Gy | 68.4 ± 5.2 Gy | 29% | 0.58 | 0.52 | |
| [0.43,0.72] | [0.45,0.58] | |||||
| P=0.045 | P=0.82 | |||||
| D30% | 42.5 ± 6.8 Gy | 52.5 ± 6.6 Gy | 37% | 0.62 | 0.52 | |
| [0.47,0.77] | [0.46,0.59] | |||||
| P=0.084 | P=0.78 | |||||
| D40% | 34.6 ± 7.6 Gy | 47.4 ± 6.3 Gy | 30% | 0.58 | 0.49 | |
| [0.43,0.74] | [0.44,0.57] | |||||
| P=0.317 | P=0.85 |
Table 5: A comparison of FMIGRT and USGRT databases; ULR models derived from the FMIGRT database were applied to USGRT to estimate expected incidence of acute rectal toxicity in USGRT patients under an assumption that planning dosimetry was the only factor that influenced toxicity in both databases. ULR models were fit to hand extracted indices in both databases and AUCs for both databases are shown in the last two columns.
We used Power Analysis [22] technique to determine the likelihood that the correlation between planning dosimetry and toxicity was not detected in the USGRT database because of statistical fluctuation alone. Assuming that the true correlation between planning dosimetry and toxicity in the USGRT database was the same as in the FMIGRT database, the likelihood of detecting the correlation in the USGRT was greater than 95%. Hence, results shown in Table 5 strongly suggest that the correlation in USGRT database was not as strong as the correlation in the FMIGRT database.
The simulation of a systematic patient setup error in FMIGRT patients, which displaced the isocenter posteriorly by 5 mm in every patient, yielded an estimate that the systematic setup error of this magnitude could have approximately doubled (2.35 ± 0.3) the incidence of acute rectal toxicity. Results of the simulation are summarized in Table 6. It is noteworthy that shifting the isocenter for each patient by the same distance did not break the correlation between the planning dosimetry and the synthetic toxicity (Table 6).
| D1.8% | D10% | D30% | D40% | |
|---|---|---|---|---|
| AUC DVH based indices |
0.57 [0.45, 0.70] |
0.63 [0.51,0.75] |
0.64 [0.52,0.76] |
0.64 [0.51,0.76] |
| AUC recorded indices |
0.58 [0.45.0.71] |
0.64 [0.52,0.76] |
0.64 [0.51,0.77] |
0.63 [0.50,0.75] |
| Cross estimate of toxicity incidence | 50.7% | 49.0% | 48.4% | 47.9% |
| Actual toxicity incidence | 47% | |||
Table 6: Results of fitting of the URL models to the synthetic toxicity data based on the simulation of the 5 mm posterior shift of the isocenter. The AUC for models based on DVH based indices and hand extracted indices are shown in the first two rows. Cross estimate of toxicity incidence shows the estimate of incidence when a DVH based model is applied to hand-extracted indices. The actual toxicity incidence shows the incidence implied by the synthetic data.
Discussion
The Modeling of acute rectal toxicity in FMIGRT patients strongly suggests that the planning rectal dosimetry was correlated with grade ≥ 2 acute rectal toxicity in this patient cohort. We fit two models to DVH data (LKB and ULR) and obtained predictive results with similar AUC values which were also consistent with the majority of published literature on the modeling of rectal toxicity [17]. Both models were in a qualitative agreement that medium to high doses, when applied to small volumes, were most predictive for acute rectal toxicity.
An extrapolation of the ULR model from the FMIGRT database to USGRT patients significantly under predicted the observed incidence of acute grade ≥ 2 rectal toxicity in USGRT patients. The highest estimate of expected incidence of toxicity was 37%, while the incidence of 54% was actually recorded. Moreover, fits of the ULR model to recorded indices in the USGRT database failed to produce a predictive model for any of the four indices (Table 5). This strongly suggests that there was little to no correlation between planning dosimetry and the relative risk of developing acute rectal toxicity among USGRT patients.
The patient setup error was the most plausible cause of observed differences between FMIGRT and USGRT patients. A prior “in silico” study of the impact of random setup error on rectal toxicity [23] in fractionated prostate treatments suggested that random errors may not necessarily lead to a significant increase in toxicity because of averaging of rectal doses. Larger than expected incidence of rectal toxicity in USGRT patients may thus be an indication of a systematic setup error. The BAT abdominal ultrasound-based localization system which was used in this study was also used by other institutions during the decade of the 2000s [12,24-28], with published reports of clinically acceptable accuracies and workflow. More recent reports questioned the accuracy of ultrasound systems [29-31], however. In particular study by Foster et al. [29] compared the localization by the BAT system to the localization by implanted electromagnetic transponders and concluded that the localization by the BAT system might have been associated with a systematic posterior shift of the isocenter by as much as 5 mm, superimposed upon broadly distributed random errors. Our simulation of the systematic posterior shift of the isocenter in FMIGRT patients led to an estimate that a systematic setup error of this magnitude would have doubled the incidence of acute rectal toxicity. This estimate is qualitatively consistent with the data shown in Table 5. The average of four predictions of the incidence of toxicity in USGRT patients was 27%, while the incidence of 54% was actually recorded.
The simulation of a uniform, posterior shift of the isocenter in FMIGRT patients predicted the incidence of acute rectal toxicity which was consistent with the incidence observed in USGRT patients, but it did not break the apparent correlation between planning dosimetry and the simulated toxicity. This result strongly suggests that the ultrasound patient positioning system was generating a systematic shift of the isocenter, superimposed with a broad random error, which is consistent with the findings of Foster et al. [29].
One may consider several confounding factors that could have affected the results of our study but none of these factors was likely to be significant. A possible bias in toxicity scoring between the two databases was unlikely because toxicities in both databases were scored by the same group of experienced physicians using CTCAEv4 criteria. A possible bias in the recording of dosimetric indices in the two databases was unlikely because treatment planning for all patients was done by the same group of dosimetrists and recorded indices agreed reasonably well with indices computed from DVHs in FMIGRT patients. The ULR model which was developed for FMIGRT patients could have been inaccurate because of the relatively low statistics in the FMIGRT group. An inaccurate model could explain the under prediction of the incidence of toxicity but it cannot explain a failure to fit a predictive model in a much larger USGRT database.
A database of 79 FMIGRT patients was sufficient to detect a correlation between planning dosimetry and acute rectal toxicity in this work. A statistical technique called power analysis [22] can be used to estimate the number of patients that would be recommended to ensure that one can reach statistically significant conclusions in an analysis which was similar to this work. Assuming the same correlation between dosimetry and toxicity that was seen in FMIGRT patients, the same incidence of grade ≥ 2 acute rectal toxicity of 20%, and the likelihood of falsely detecting a correlation which would be less than 5%, a cohort of 120 patients would be sufficient to ensure 80% likelihood that the correlation would be detected if one was present. A cohort of 200 patients would be sufficient to ensure 95% likelihood of detecting the correlation if one was present. Fewer patients would be required if the incidence was greater than 20%, while more patients would be required if the incidence was less than 20%.
In summary, our study suggests that a correlation between acute rectal toxicity and treatment planning dosimetry in IMRT treatments for prostate cancer can be measured in a relatively small cohort of patients. Lack of such a correlation in clinical data should be concerning and motivate a review of the quality of delivery of IMRT treatments. One can argue that the systematic shift in the isocenter which is supported by our data could be detected through a change in the incidence of toxicity relative to the baseline. The baseline incidence of toxicity which would be expected in the case of perfect treatment delivery is not known a priori however, particularly in relatively new treatment protocols which use unconventional fractionation schedules.
The methodology which was used in the present study could be implemented within existing commercial software platforms for radiation therapy. Many of these platforms (for example: Varian, Inc Aria system) integrate the treatment planning dosimetry with the information on toxicity type and score. Such integration could enable a commercial “single button” implementation of the entire analysis that was carried out in this study. An analysis which was discussed in this work can be relatively easily extended to a multivariate analysis which includes patient specific characteristics. We have shown in a prior work [32] that patient specific characteristics are not only important for full characterization of the toxicity risk but may even be a dominant predictor of toxicity in some cases. A commercial implementation of the present work could lead to the development of an “expert system” which quantifies a risk for toxicity for patients who are treated within a particular institution, using treatment protocols which are specific to this institution.
Conclusion
Modeling of acute rectal toxicity in radiation therapy for prostate cancer provides a quantitative measure of a correlation between planning dosimetry and this clinical endpoint. Our study suggests that an unusually weak correlation may indicate systematic flaws in treatment delivery which could be clinically significant. A combination of high incidence of toxicity and weak correlation between toxicity and planning dosimetry should be particularly concerning.
Acknowledgment
We thank Mayo Clinic AZ and Arizona State University Rising Star Initiative for providing funding support. We thank Varian, Inc for supporting this work through the grant to Arizona State University. SES acknowledges support for his research time from the North Central Cancer Treatment Group and Mayo Clinic with funding from the Public Health Service (CA-25224, CA-37404, CA-35267, CA-35431, CA- 35195, CA-63848, CA-63849, CA-35113, CA-35103, CA-35415, CA- 35101, CA-35119, CA-35090). The content is solely the responsibility of the authors and does not necessarily represent the views of the National Cancer Institute or the National Institute of Health.
Jing Li and Xiaonan Liu were responsible for the statistical analysis. There are no sources in the current document.
Conflicts of Interest
Authors declare no conflicts of interest.
References
- Van HM, Remeijer P, Rasch C, Lebesque JV (2000) The probability of correct target dosage: Dose-population histograms for deriving treatment margins in radiotherapy. Int J Radiat Oncol Biol Phys 47: 1121-35.
- Wen N, Kumarasiri A, Nurushev T, Burmeister J, Xing L, et al. (2013) An assessment of PTV margin based on actual accumulated dose for prostate cancer radiotherapy. Phys Med Biol 58: 7733-7744.
- Beltran C, Herman G, Davis B (2007) Planning target margin calculations for prostate radiotherapy based on intrafraction and interfraction motion using four localization methods. Int J Radiat Oncol Biol Phys 70: 289-295.
- Qin A, Sun Y, Liang J (2015) Evaluation of online/offline image guidance/adaptation approaches for prostate cancer radiation therapy. Int J Radiat Oncol Biol Phys 91: 1026-1033.
- Ricco A, Manahan G, Lanciano R, Hanlon A, Yang J, et al. (2016) The comparison of stereotactic body radiation therapy and intensity-modulated radiation therapy for prostate cancer by nccn risk groups. Front Oncol 6.
- Lischalk J, Kaplan I, Collins P (2016) Stereotactic body radiation therapy for localized prostate cancer. Cancer J 22: 307-313.
- Johnson S, Soulos P, Shafman T, Mantz CA, Dosoretz A et al. (2016) Patient-reported quality of life after stereotactic body radiation therapy versus moderate hypofractionation for clinically localized prostate cancer. Radiother Oncol 121: 294-298.
- Jason CY, Qureshi MM, Clancy P, Dise LN, Willins J, et al.( 2015) Daily patient setup error in prostate image guided radiation therapy with fiducial-based kilovoltage onboard imaging and conebeam computed tomography. Quant Imaging Med Surg 5: 665-672.
- Choong ES, Hruby G, Yang J, Kwong C, Patanjali N (2017) 78Gy with Fiducial Marker Imageâ€Guided Radiotherapy in Prostate Cancer: Single Center Analysis of 301 Patients. Asia Pac J Clin Oncol 13: e356-e363
- Tanyi JA, He T, Summers PA, Mburu RG, Kato CM, et al. (2010) Assessment of planning target volume margins for intensity-modulated radiotherapy of the prostate gland: Role of daily inter and intrafraction motion. Int J Radiat Oncol Biol Phys 78: 1579-1585.
- Schild MH, Schild SE, Wong WW, Vora SA, Silva AC (2014). Early outcome of prostate intensity modulated radiation therapy (IMRT) incorporating a simultaneous intra-prostatic MRI directed boost. OMICS J Radiol 3: 170
- Serago CF, Chungbin SJ, Buskirk SJ, Ezzell GA., Collie AC, et al. (2002) Initial experience with ultrasound localization for positioning prostate cancer patients for external beam radiotherapy. Int J Radiat Oncol Biol Phys 53: 1130-1138.
- Vora SA, Wong WW, Schild SE, Ezzell, GA, Andrews PE, et al. (2013) Outcome and toxicity for patients treated with intensity modulated radiation therapy for localized prostate patients. J Urol 190: 521-526.
- Kutcher GJ, Burman C, Brewster L, Goitein M, Mohan R, et al. (1991) Histogram reduction method for calculating complication probabilities for three-dimensional treatment planning evaluations. Int J Radiat Oncol Biol Phys 21: 137-146.
- Kutcher GJ, Burman C, Brewster L, Goitein M, Mohan R (1991) Fitting of normal tissue tolerance data to an analytic function. Int J Radiat Oncol Biol Phys 21: 123-135
- Cella L, D'Avino V, Liuzzi R, Conson M, Doria F, et al. (2013) Multivariate normal tissue complication probability modeling of gastrointestinal toxicity after external beam radiotherapy for localized prostate cancer. Radiat Oncol 8: 221-231
- Michalski JM, Gay H, Jackson A, Tucker SL, Deasy JO ( 2010) Radiation dose-volume effects in radiation-induced rectal injury. Int J Radiat Oncol Biol Phys 76: S123-S129.
- Tucker SL, Michalski JM, Bosch WR, Mohan R, Dong L, et al. (2012) Use of fractional dose volume histogram to model risk of acute rectal toxicity among patients treated on rtog 94-06. Radiother Oncol 104: 109-113.
- Neider JA, Mead R (1965) A simplex method for function minimization. Comput J 7: 308-313.
- Team RC (2013). R Core Team. A language and environment for statistical computing. R Foundation for Statistical Computing, Vienna, Austria.
- Lachenbruch PA, Cohen J (1989) Statistical power analysis for the behavioral sciences (2nd ed.). Journal of the American Statistical Association 84: 1096
- Fatyga M, Williamson JF, Dogan N, Todor D, Siebers JV (2009). A comparison of HDR brachytherapy and IMRT techniques for dose escalation in prostate cancer: A radiobiological modeling study. Med Phys 36: 3995-4006.
- Morr J, DiPetrillo T, Tsai JS, Engler M, Wazer DE (2002) Implementation and utility of a daily ultrasound-based localization system with intensity-modulated radiotherapy for prostate cancer. Int J Radiat Oncol Biol Phys 53
- Fuss M, Salter BJ, Cavanaugh SX, Fuss C, Sadeghi A, et al. (2004) Daily ultrasound-based image-guided targeting for radiotherapy of upper abdominal malignancies. Int J Radiat Oncol Biol Phys 59: 1246-1256.
- Lattanzi J, McNeeley S, Pinover W, Horwitz E, Das I, et al. (1999) A comparison of daily ct localization to a daily ultrasound-based system in prostate cancer. Int J Radiat Oncol Biol Phys 43: 719-725.
- Chandra A, Dong L, Huang E, Kuban DA, O’Neill L, et al. (2003) Experience of ultrasound-based daily prostate localization. Int J Radiat Oncol Biol Phys 56: 436-447.
- Little DJ, Dong L, Levy LB, Chandra A, Kuban DA, et al. (2003) Use of portal images and bat ultrasonography to measure setup error and organ motion for prostate imrt: Implications for treatment margins. Int J Radiat Oncol Biol Phys 56: 1218-1224
- Foster RD, Solberg TD, Li HS, Kerkhoff A, Enke CA, et al. (2010) Comparison of transabdominal and electromagnetic transponders for prostate localization. J Appl Clin Med Phys 11: 2924.
- Robinson D, Liu D, Steciw S, Field C, Daly H, et al. (2012) An evaluation of the clarity 3D ultrasound system for prostate localization. J Appl Clin Med Phys 13
- Fargier-Voiron M, Presles B, Pommier P, Rit S, Munoz A, et al. (2014) Impact of probe pressure variability on prostate localization for ultrasound-based image-guided radiotherapy. Radiother Oncol 111: 132-137.
- Liu X, Li J, Wu T, Schild SE, Schild MH, et al. (2016) Patient specific characteristics are an important factor that determines the risk of acute grade ≥ 2 rectal toxicity in patients treated for prostate cancer with imrt and daily image guidance based on implanted markers. OMICS J Radiol 5: 225.
Citation: Liu X, Li J, Schild SE, Schild MH, Wong W, et al. (2018) Modeling of Acute Rectal Toxicity to Compare Two Patient Positioning Methods for Prostate Cancer Radiotherapy: Can Toxicity Modeling is Used for Quality Assurance? OMICS J Radiol 7: 302. DOI: 10.4172/2167-7964.1000302
Copyright: © 2018 Liu X, et al. This is an open-access article distributed under the terms of the Creative Commons Attribution License, which permits unrestricted use, distribution, and reproduction in any medium, provided the original author and source are credited.
Select your language of interest to view the total content in your interested language
Share This Article
Open Access Journals
Article Tools
Article Usage
- Total views: 7771
- [From(publication date): 0-2018 - Oct 20, 2025]
- Breakdown by view type
- HTML page views: 6676
- PDF downloads: 1095